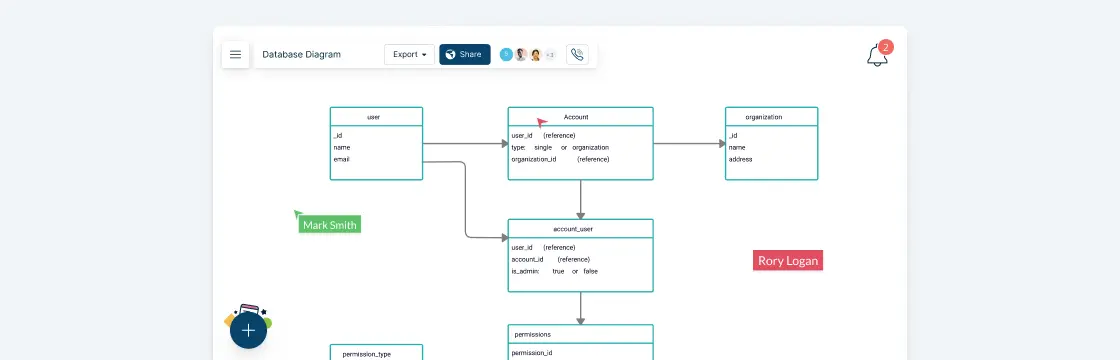
A database diagram is the very foundation of a database design and development effort. It represents the basic structure of a database; how information is stored, categorized and managed within it. A typical database diagram consists of entities, attributes, and relationships.
Effective database administration is crucial for businesses in today’s data-driven world to optimize operations, make informed decisions, and drive innovation. However, without the proper tools and processes, visualizing and understanding big databases can be difficult. Database modeling is useful in this situation. Database models give stakeholders a clear understanding of the relationships, dependencies, and structure of the database by visualizing them.
In this guide, we will explore various database model examples. Whether you’re a database administrator, developer, analyst, or decision-maker, this guide will provide you with practical examples and insights to effectively visualize databases.
- Why Are Database Diagrams Important?
- The Role of Different Database Examples
- Best Practices When Creating a Database Diagram
- Who Needs a Database Diagram
- Iterating and Updating Database Diagrams
- Use Creately Examples to Design Your Database Diagram
- More Diagramming Templates
Why Are Database Diagrams Important?
The value of a database diagram comes from its ability to show a database’s relationships and organizational structure graphically. Here are some key reasons why a database diagram is important.
- Database Design and Planning: A database diagram serves as a blueprint during the initial design and planning phase of a database. It helps visualize entities, attributes, and relationships, aiding in effective organization and structuring of the database.
- Communication and Collaboration: Database diagrams serve as a communication tool, making it easier to describe the database structure to stakeholders in a clear and succinct manner. They encourage communication and understanding between business analysts, database administrators, and developers.
- Documentation: Database diagrams are used as documentation to show the relationships and organizational structure of the database. In troubleshooting problems, making changes, and maintaining the database system, they offer a visual reference.
- Database Maintenance: Database diagrams are used as documentation to show the relationships and organizational structure of the database. In troubleshooting problems, making changes, and maintaining the database system, they offer a visual reference.
- Database Optimization: Database diagrams aid in identifying performance bottlenecks and optimizing the database schema. By visualizing relationships, they allow analysis of query efficiency, helping enhance overall performance and scalability.
The Role of Different Database Examples
Although a database diagram’s function differs between industries, its core objective remains constant: visually representing a database’s structure and relationships. To create such a database diagram, first identify the key entities (e.g., Patient, Doctor, Appointment) and their attributes. Then define the relationships (e.g., many-to-many) between entities.
Here are a few examples of how database diagrams are used in specific industries.
Healthcare Industry
Database diagrams are used to design and document the structure of Electronic Health Record (EHR) Systems. It aids in designing a database schema that efficiently manages patient records, tracks appointments, and supports accurate billing.
Retail Industry
Database diagrams are used to represent inventory databases containing product information, stock levels, suppliers, and sales, in inventory management systems, for instance. These diagrams help in optimizing inventory management processes, identifying stock shortages, and ensuring efficient supply chain management. The links between items like customers, accounts, and transactions can be visualized using a database diagram. It helps with creating a database schema that controls customer account data, keeps track of transactions, and facilitates loan management.
Financial Industry
Database diagrams play a crucial role in designing banking systems by visualizing customer accounts, transactions, balances, and associated entities such as branches, ATMs, and employees. These diagrams assist in ensuring data accuracy, security, and compliance with regulatory standards.
E-commerce Industry
Database diagrams are used to represent e-commerce databases for online shopping platforms. Such a database includes entities and attributes related to store product catalogs, customer profiles, orders, payments, and shipping details. These diagrams help in designing efficient data models, analyzing customer behavior, and optimizing the online shopping experience.
Education Industry
Student Information Systems: Database diagrams are used to structure Student Information Systems, including student profiles, courses, grades, and enrollment details. These diagrams assist in managing student data, generating reports, and facilitating administrative tasks in educational institutions.
Manufacturing Industry
Database diagrams are used to model production planning databases, including production orders, bill of materials, inventory, and resource allocation. These diagrams aid in optimizing production processes, tracking progress, and ensuring efficient utilization of resources.
Best Practices When Creating a Database Diagram
Clearly Define Entities and Relationships
Use meaningful and descriptive names for entities to ensure understanding. For example, in a customer management system, use entities like “Customer,” “Order,” and “Product” instead of generic terms.
Tip: Avoid ambiguous or overly generic entity names. Be specific and use industry-standard terminology where applicable.
Use Consistent Naming Conventions
Establish and follow consistent naming conventions for entities, attributes, and relationships. This conveys clarity and makes it easier to understand and maintain the database. Use descriptive attribute names like “first_name,” “email_address,” and “order_date”.
Tip: Choose a naming convention that aligns with industry standards or best practices. Consider using prefixes or abbreviations to indicate the type of object (e.g., “tbl” for tables, “fk_” for foreign keys)._
Define Primary Keys and Foreign Keys
Clearly identify primary keys (PKs) and foreign keys (FKs) in the database diagram. PKs ensure uniqueness, while FKs establish relationships between entities. For example, in a product catalog database, the “Product” entity may have a primary key “product_id,” while the “Order” entity may have a foreign key “fk_product_order” referencing the “Product” table.
Tip: Use appropriate symbols or annotations to indicate PKs and FKs in the diagram. Follow naming conventions for FKs, such as using the format “fk[referenced_table][referencing_table].”
Indicate Cardinality and Relationship Types
Clearly indicate the cardinality (one-to-one, one-to-many, many-to-many) and relationship types between entities in the diagram. This helps to understand the nature of the relationships. An example relationship notation could be: “Customer” (1) —< (many) “Order,” indicating that one customer can have multiple orders.
Tip: Use appropriate symbols, annotations, or crow’s foot notation to represent the cardinality and relationship types. Consider adding labels or annotations to describe the relationship.
Include Attribute Details
Provide attribute details within the entities, including data types, constraints, and additional notes. This adds clarity to the database structure. Within the “Customer” entity, specify attributes like “customer_id” (int), “name” (varchar(100)), “email” (varchar(255)), and any additional constraints or notes.
Tip: Use appropriate data type notations (e.g., “int” for integer, “varchar(50)” for a string of 50 characters). Indicate any constraints or special considerations, such as “NOT NULL” or “UNIQUE.”
Keep the Diagram Simple and Organized
Keep the database diagram clean, simple, and easy to understand. Avoid clutter and complex arrangements. For example, group related entities together, such as placing all customer-related entities in one section and all order-related entities in another section of the diagram.
Tip: Use appropriate spacing, alignment, and grouping of entities and relationships. Consider organizing related entities and relationships in logical clusters.
Regularly Update and Maintain the Diagram
Maintain the database diagram throughout the development and lifecycle of the database. When a new entity, such as “Payment,” is added to the database, update the diagram to include the new entity, its attributes, and relationships with other entities.
Tip: Update the diagram whenever there are changes to the database structure. Ensure that the diagram reflects the current state of the database.
Use Visual Tools or Software
Use dedicated database diagramming tools or software like Creately to create and maintain your diagrams. These tools provide features specifically designed for database modeling, making the process more efficient.
Tip: Choose a tool that aligns with your needs and preferences. Look for features like drag-and-drop functionality and export options to share the diagrams easily.
Add Documentation and Contextual Information
Include additional documentation and contextual information such as descriptions, business rules, assumptions, or other relevant details to enhance understanding.
Tip: Include a legend or key within the diagram to explain symbols, notations, or abbreviations used. Add textual notes or annotations to provide further explanation or clarification where necessary.
Collaborate and Get Feedback
Collaborate with other stakeholders and get their feedback on the database diagram. Multiple perspectives can help identify potential issues or improvements.
Tip: Share the diagram during design reviews or meetings and encourage open discussions. Incorporate feedback and iterate on the diagram to ensure accuracy and alignment with the requirements.
Who Needs a Database Diagram
- Database Administrators (DBAs): DBAs are responsible for managing and maintaining the database system. They use database diagrams to understand the database structure, relationships, and dependencies. DBAs use diagrams to carry out tasks like troubleshooting, capacity planning, and database performance tuning.
- Database Developers: Database diagrams are useful for developers who develop or alter the database schema and write queries. The diagrams represent the database structure visually, making it simpler to comprehend and make the necessary adjustments.
- System Architects: Database diagrams are used by system architects to create the entire system architecture, which includes the database component. Diagrams help them visualize the database structure and integrate it with other system components.
- Business Analysts: Business analysts use database diagrams to understand the data model and relationships between entities. Diagrams provide insights into the data flow and assist in requirements gathering, data analysis, and business process modeling.
- Project Managers: Project managers may not directly work with database diagrams but benefit from them for project planning and coordination. Thanks to diagrams, they can predict project schedules, understand the database structure, and effectively communicate with the development team.
- Quality Assurance (QA) Team: QA professionals can use database diagrams to understand the database structure and validate the data integrity during testing. Diagrams help with test case creation and make sure that the intended data linkages are upheld.
- Documentation Team: Database diagrams are important pieces of documentation. They can be used by documentation teams to produce user manuals, technical manuals, and system documentation. Diagrams offer a visual frame of reference for comprehending the linkages and database structure.
- Stakeholders and Decision-Makers: Database diagrams can help non-technical stakeholders and decision-makers understand the data model and how it fits with business requirements. Diagrams help with decision-making, communication, and giving a high-level picture of the database structure.
Iterating and Updating Database Diagrams
Iterating and updating a database based on feedback, market changes, and insights is crucial for the following reasons.
- Meeting User Needs: Iterating and updating the database based on user feedback enhances the user experience, addresses pain points, and ensures the database remains valuable and relevant to users.
- Adapting to Market Changes: Iterating and updating the database based on market changes enables organizations to stay competitive, meet customer demands, and seize new opportunities in a dynamic business environment.
- Enhancing Data Accuracy and Quality: Iterating and updating the database based on feedback improves data accuracy, completeness, and integrity, ensuring it remains a reliable source for decision-making and analysis.
- Optimizing Performance and Efficiency: Updating the database based on insights improves query execution, reduces response times, and optimizes resource utilization, leading to improved system performance and efficiency.
- Ensuring Compliance and Security: Updating the database based on feedback ensures compliance with evolving regulations, implements security measures, and protects sensitive data, addressing privacy concerns.
- Leveraging New Technologies and Techniques: Updating the database based on emerging technologies and best practices enables organizations to adopt advancements like cloud solutions, machine learning, or data analytics, gaining a competitive advantage.
- Ensuring Long-term Scalability and Maintainability: Iterating and updating the database addresses scalability challenges, accommodates growing data volumes, and simplifies maintenance tasks, ensuring long-term scalability and reducing technical debt.
Use Creately Examples to Design Your Database Diagram
The following database model examples are logical and physical database diagrams and they represent different scenarios, hence giving you a wide variety to choose from.
Creately supports all database models (i.e. relational model, hierarchical model, network model etc.), and the following database model examples or templates are made with its Database design software. Click the image to open it in the editor, so you can easily edit it or export it as a template.
- Online Channeling Database Diagram
- Network Database Model Diagrams for Stores
- Hierarchical Database Diagram Template
- A Database Diagram Template of a DVD Library
- Book Store Database Diagram
- Sales Management Database Diagram Template
- Color Bar Database Design Template
- Car Rental Relational Database Diagram Template
- Online Store Database Diagram Template
- Relational Database Diagram Template for Restaurants
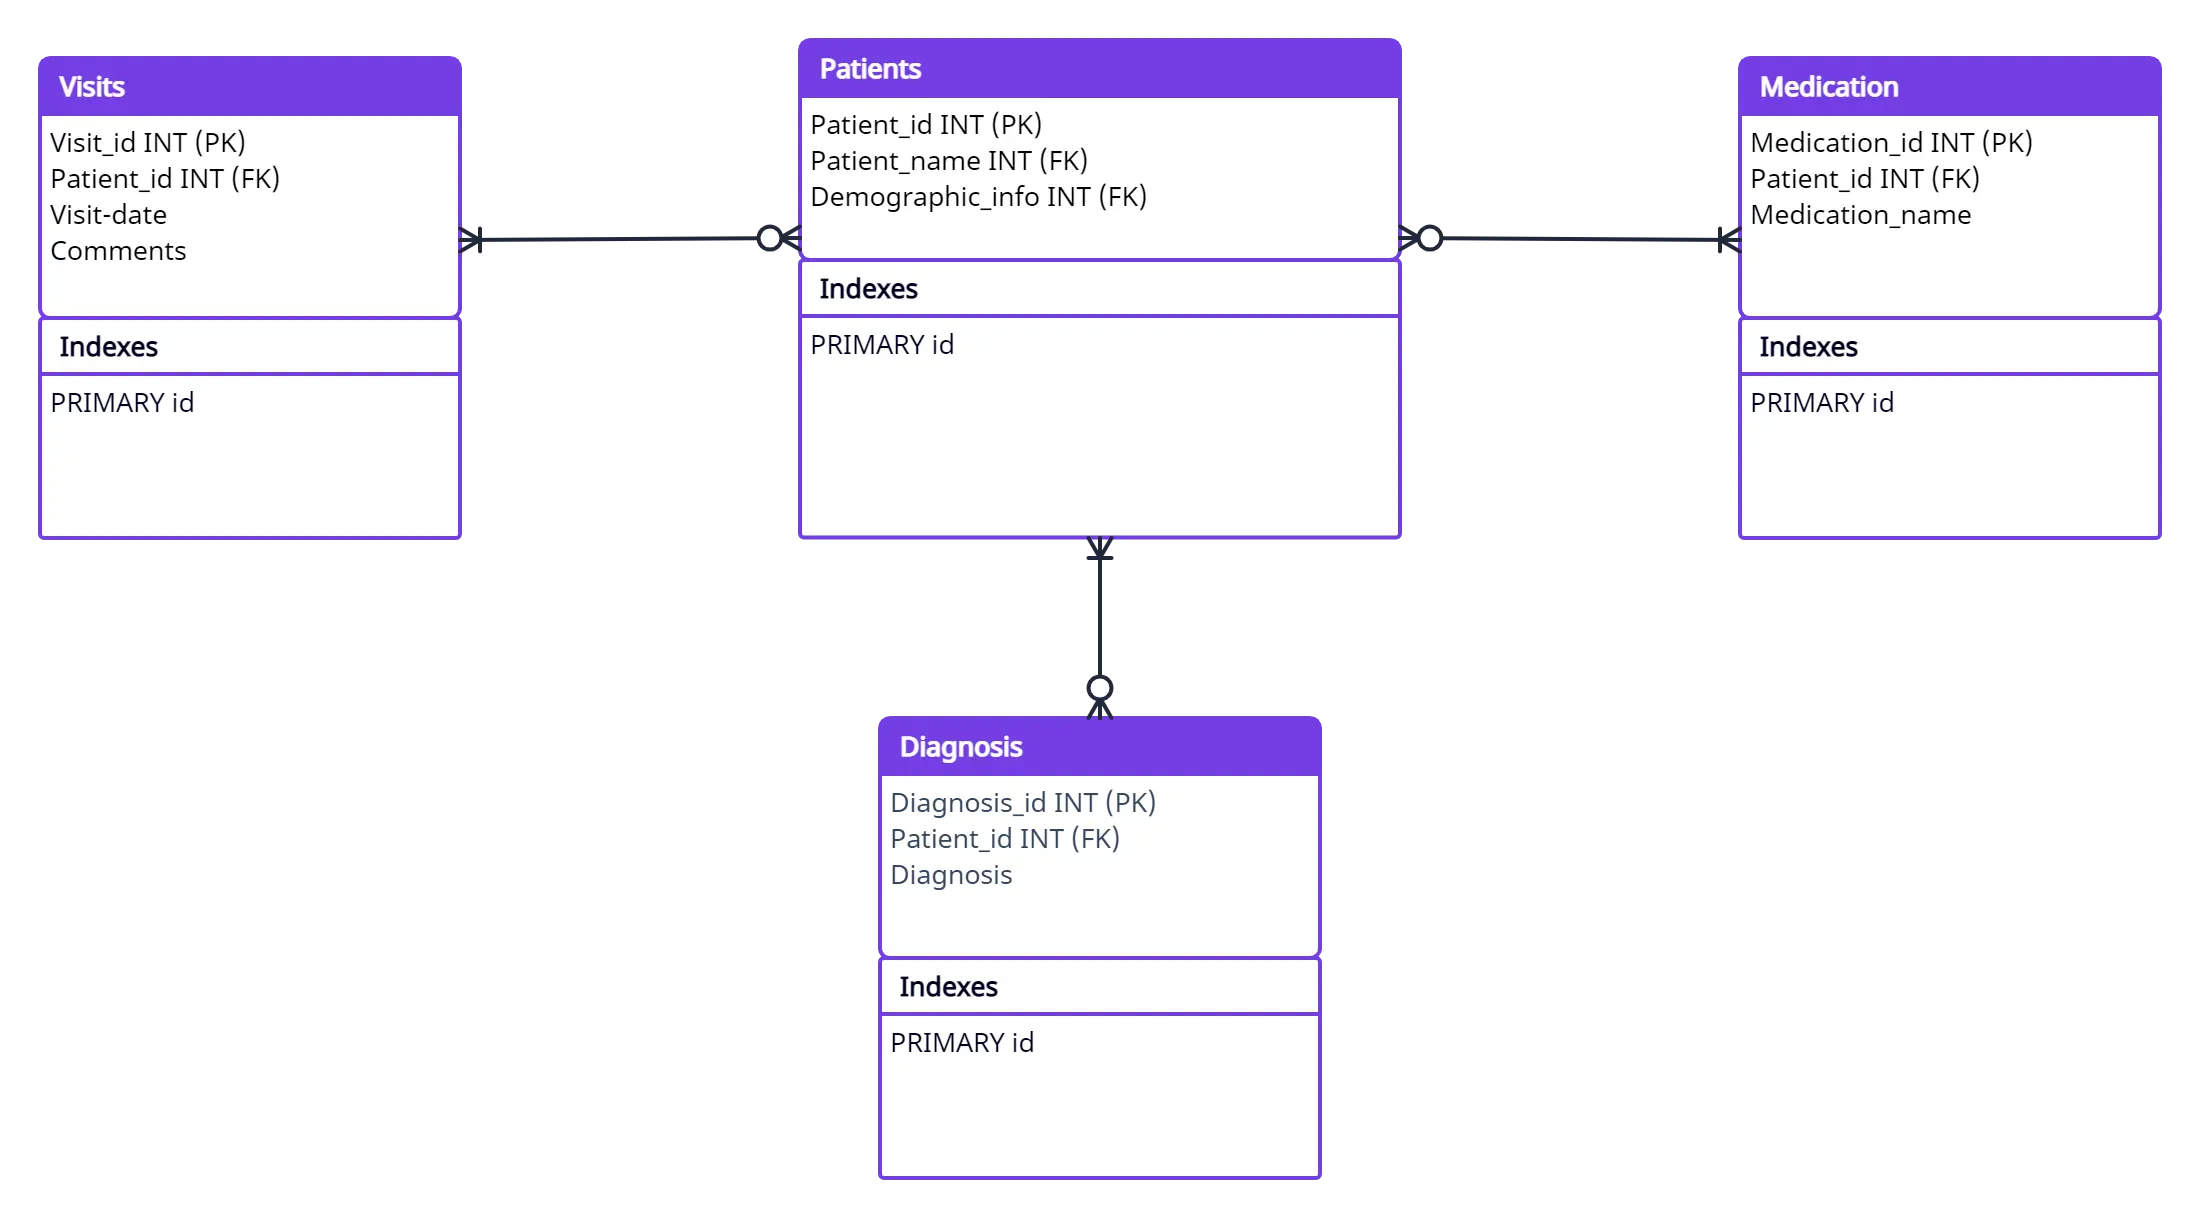
Online Channeling Database Diagram
Following is one of the database diagram examples available in Creately. It is a relational model database diagram and it shows an online channeling database. Out of the various types of DB models, relational model is the most frequently used type. The relational model consists of 3 components; relations, attributes and domains. Click the image to start editing the template with the information you want.
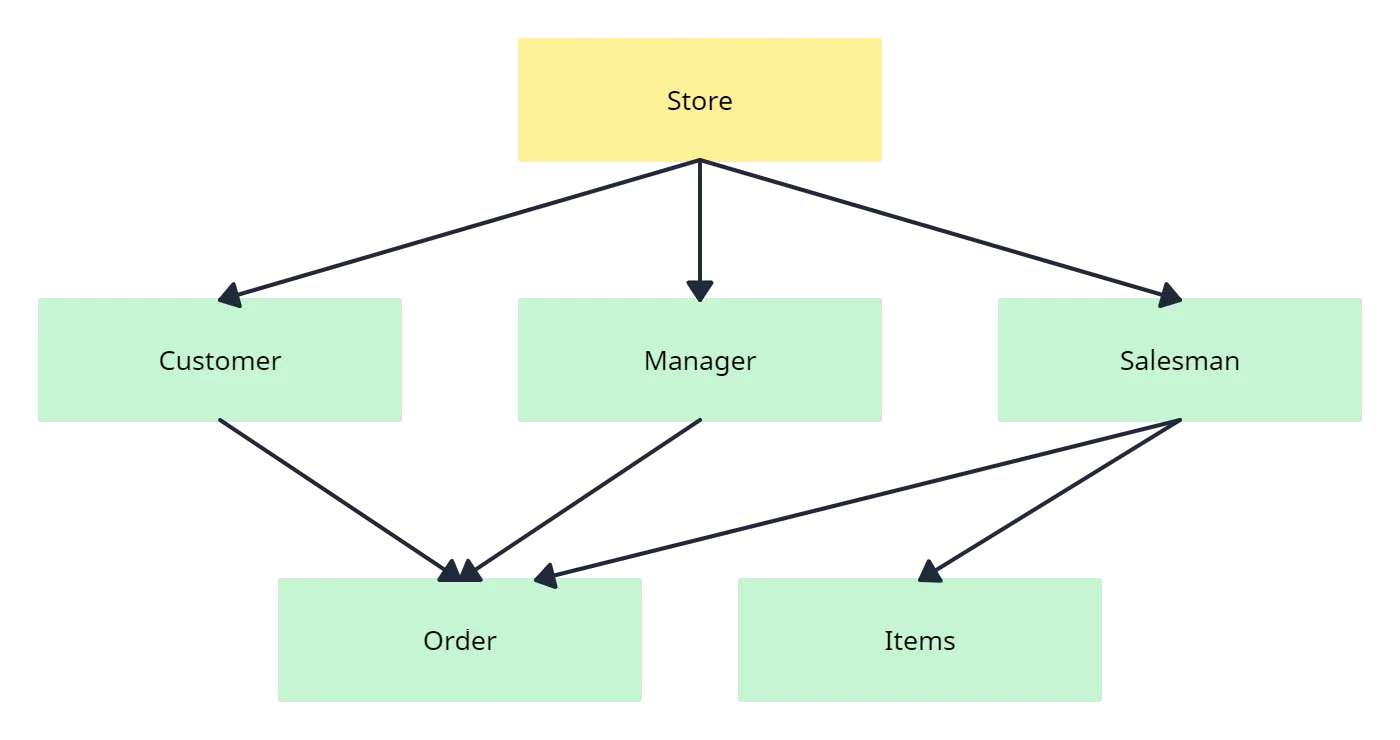
Network Database Model Diagrams for Stores
This is a database diagram of a store and it represents a network model, which unlike the relational model, takes the form of a tree like structure and uses a one-to-many relationship approach. Accordingly one node can have multiple parent nodes as shown in the database diagram example below. Click the image to edit and expand the template as per your requirements.
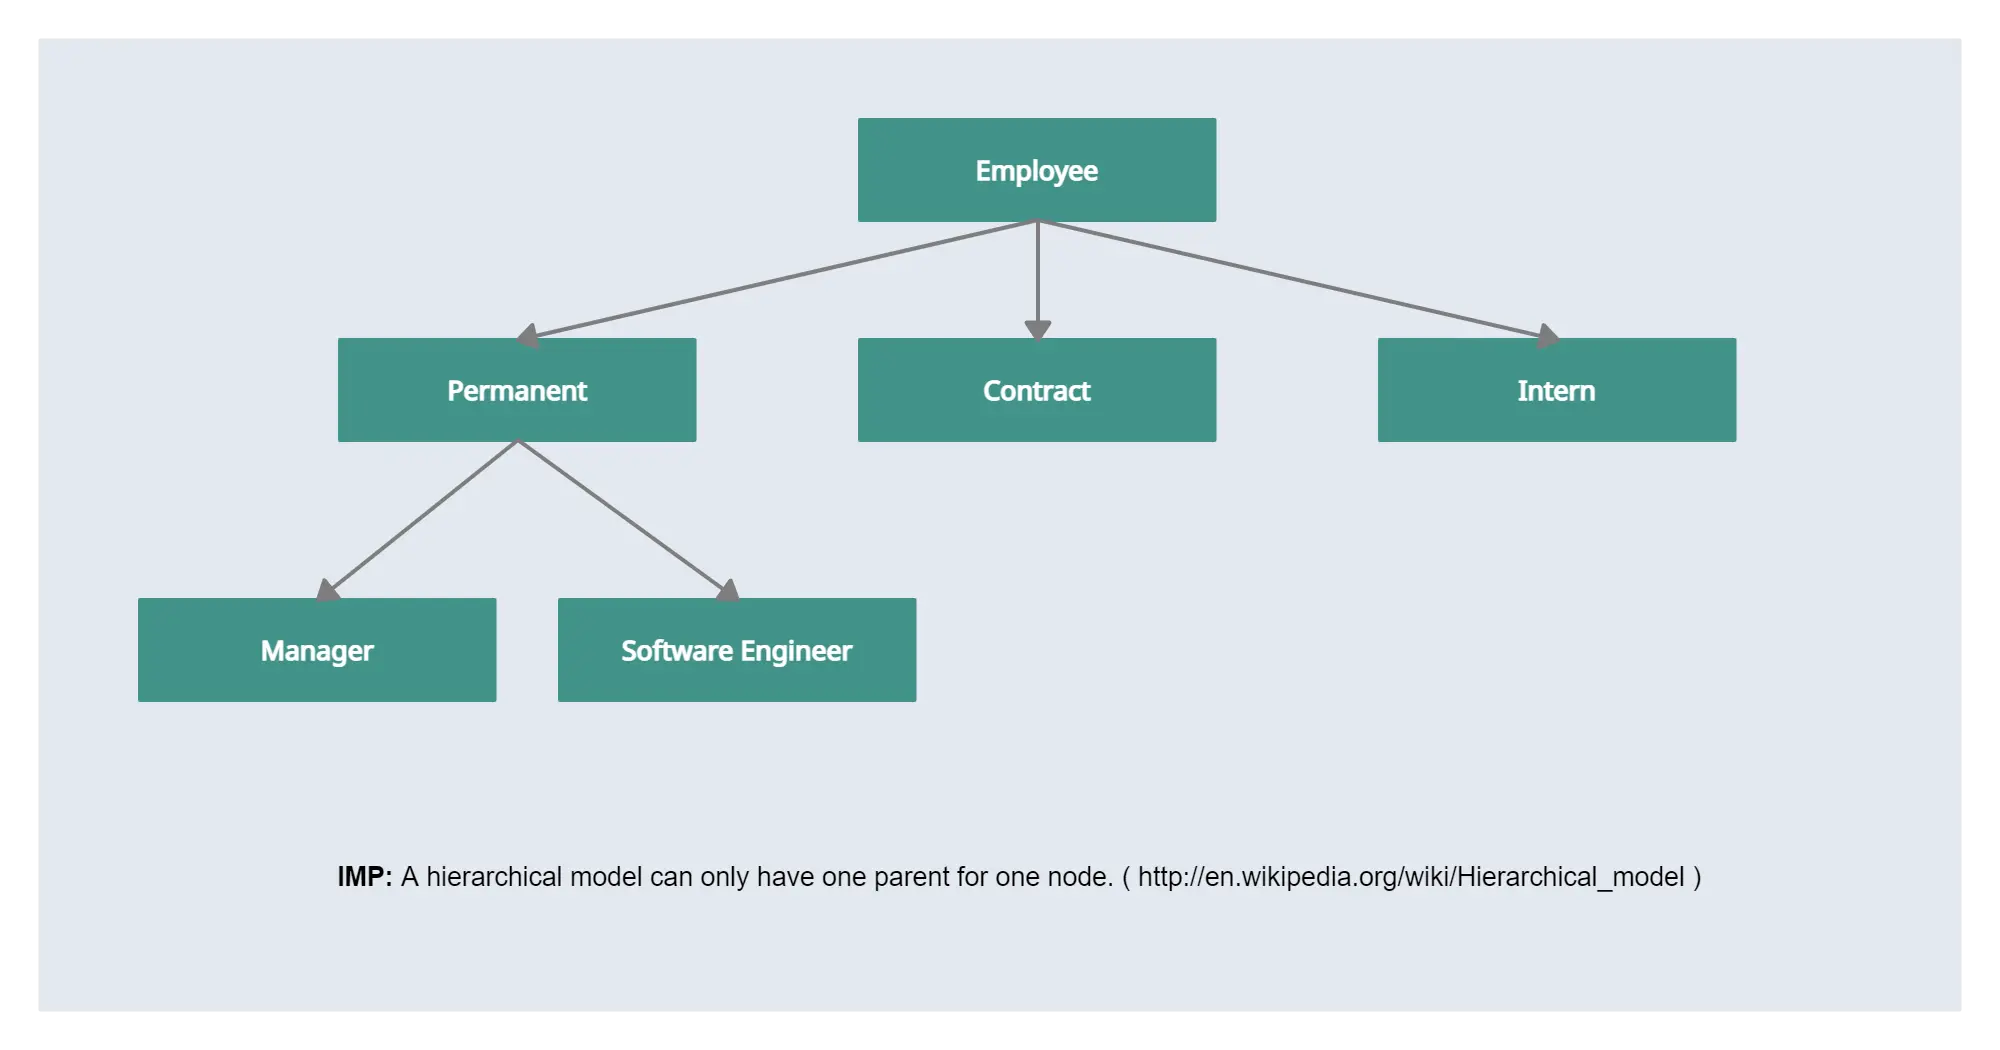
Hierarchical Database Diagram Example
The following database diagram example represents a hierarchical model, which uses a tree-like structure similar to an org chart. This model is usually used to structure XML documents, and with Creately, you can easily create even larger diagrams with its 1-click create feature. Click the image to change the color or extend the diagram according to your needs.
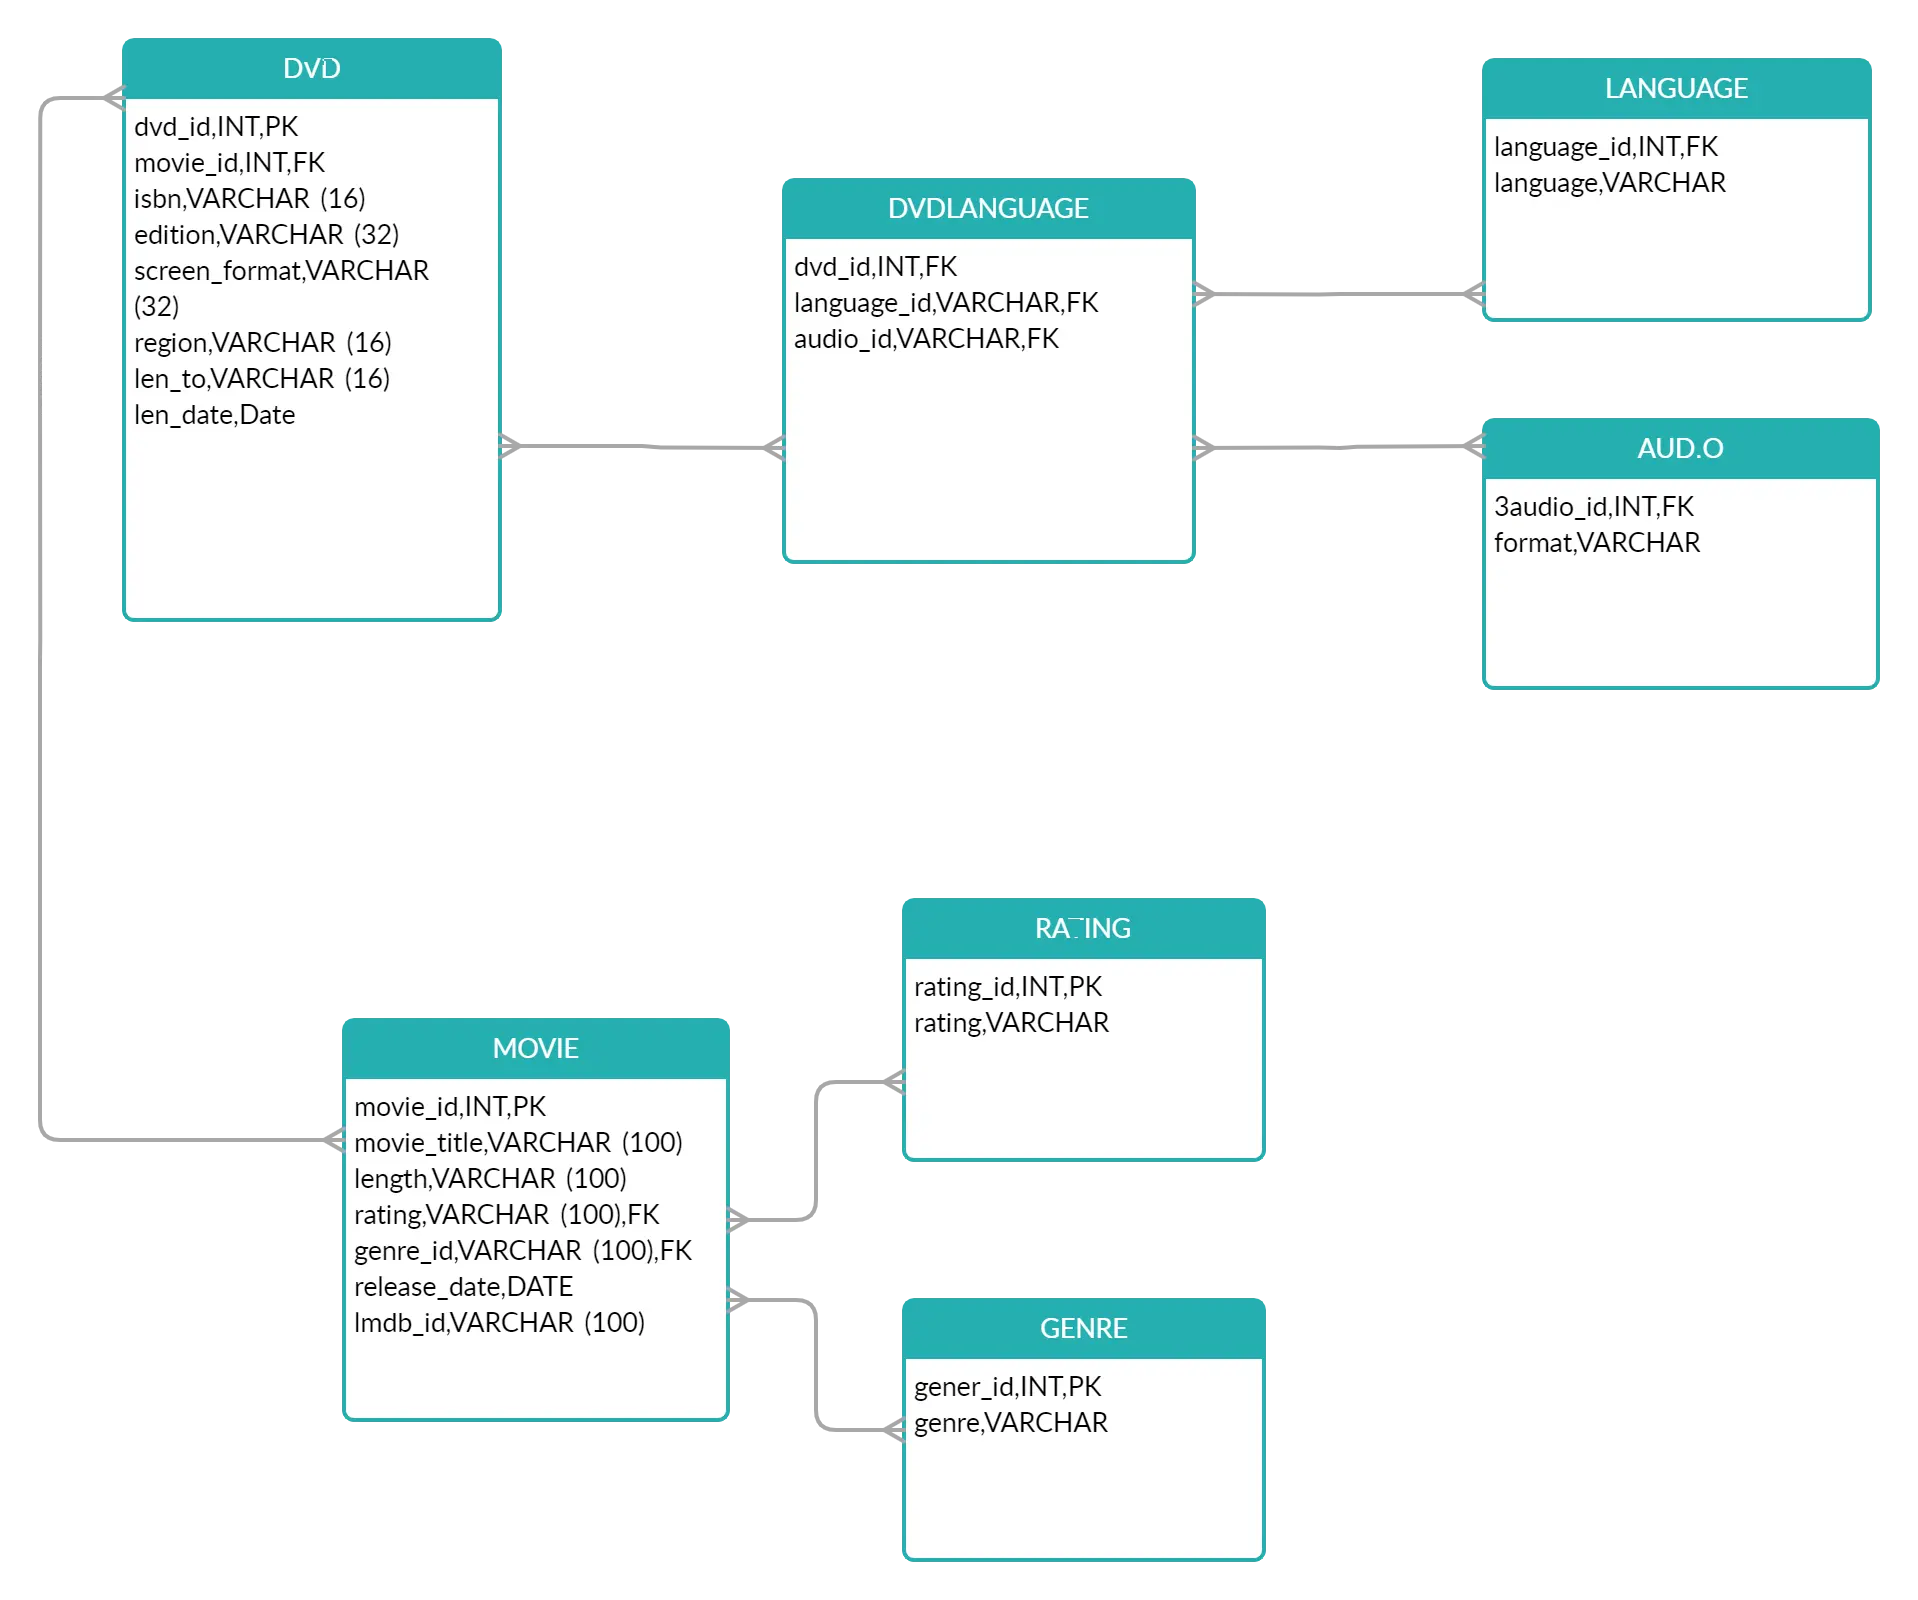
A Database Diagram Template of a DVD Library
This database diagram template is a physical database design of a DVD library. Here the data surrounding the DVDs are categorized with the use of different tables. The app provides database model notations that are easy to configure. Click the template to start modifying it online.
Book Store Database Diagram
This database model diagram example outlines a book store database. It is a relational model and therefore it shows the different relationships between the data. If you don’t like the background or the color theme of the tables, simply click the image to change the color theme with a color your prefer.
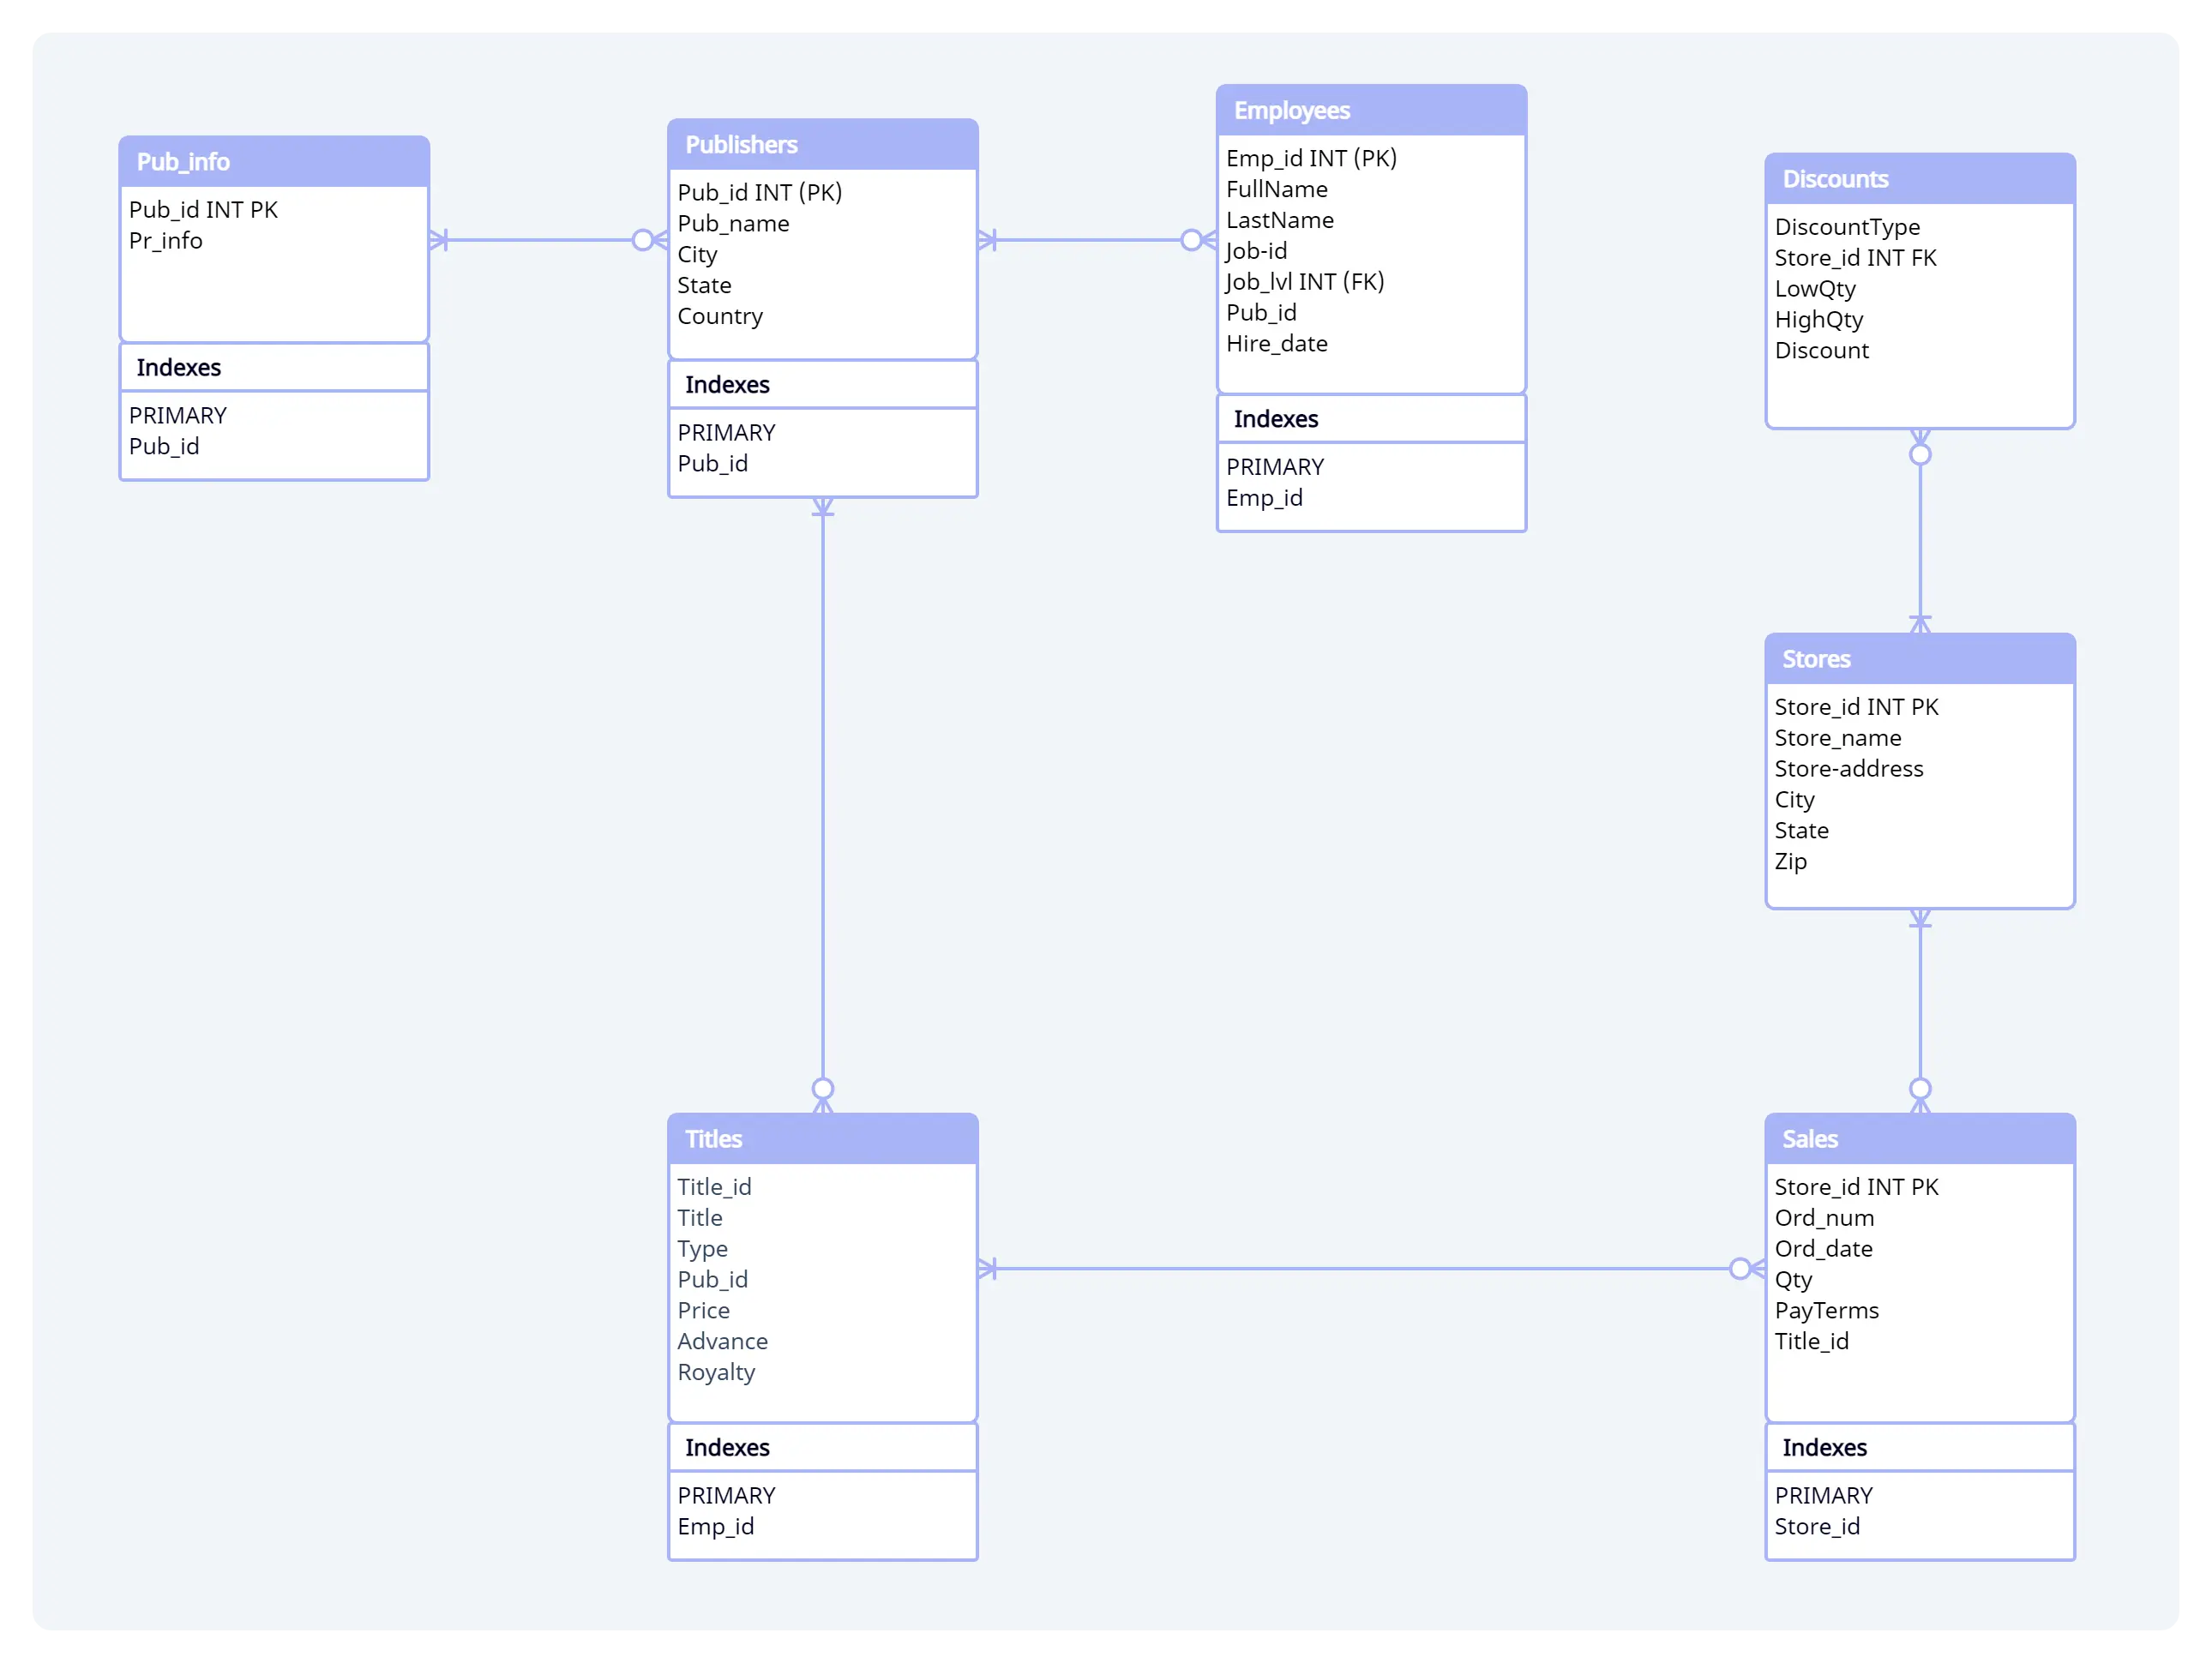
Sales Management Database Diagram Example
This is a database design example of a sales management database. It uses the Crow Foot notation symbols to represent the cardinality. Simply click the template to start modifying it online.
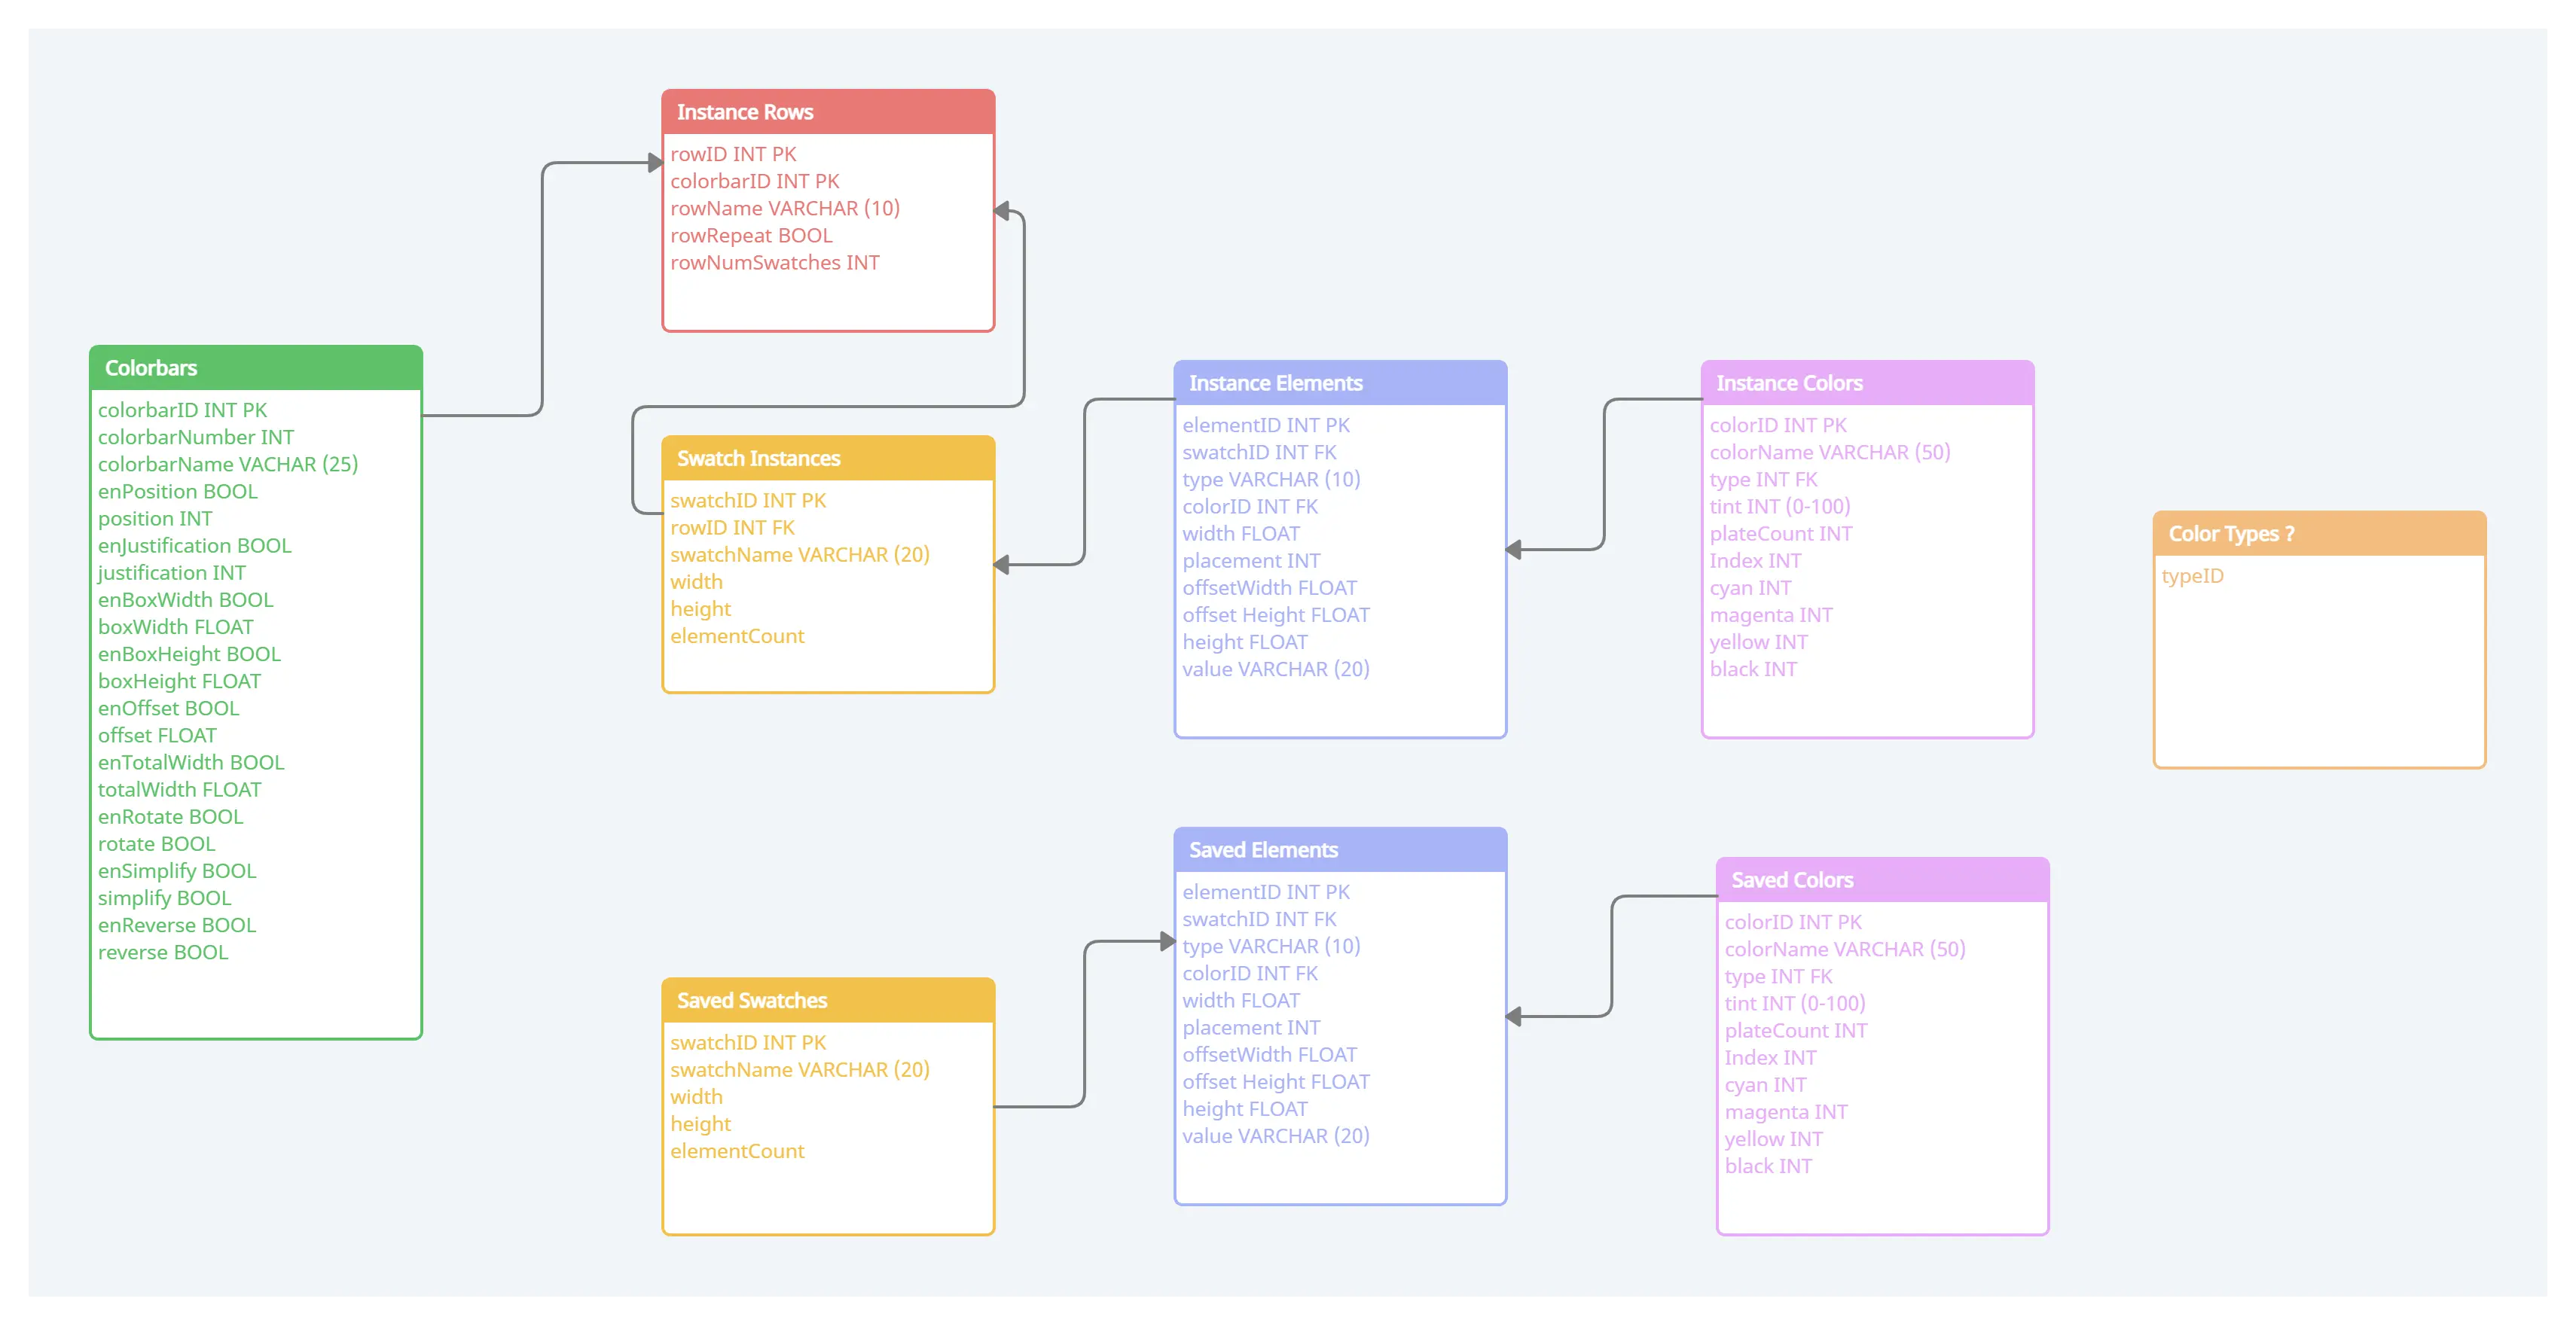
Color Bar Database Design Example
The following database example is of a color bar database. Here, we have used different colors for each table to make it look appealing and to make it easier to identify the entities. Simply click the image to make changes online.
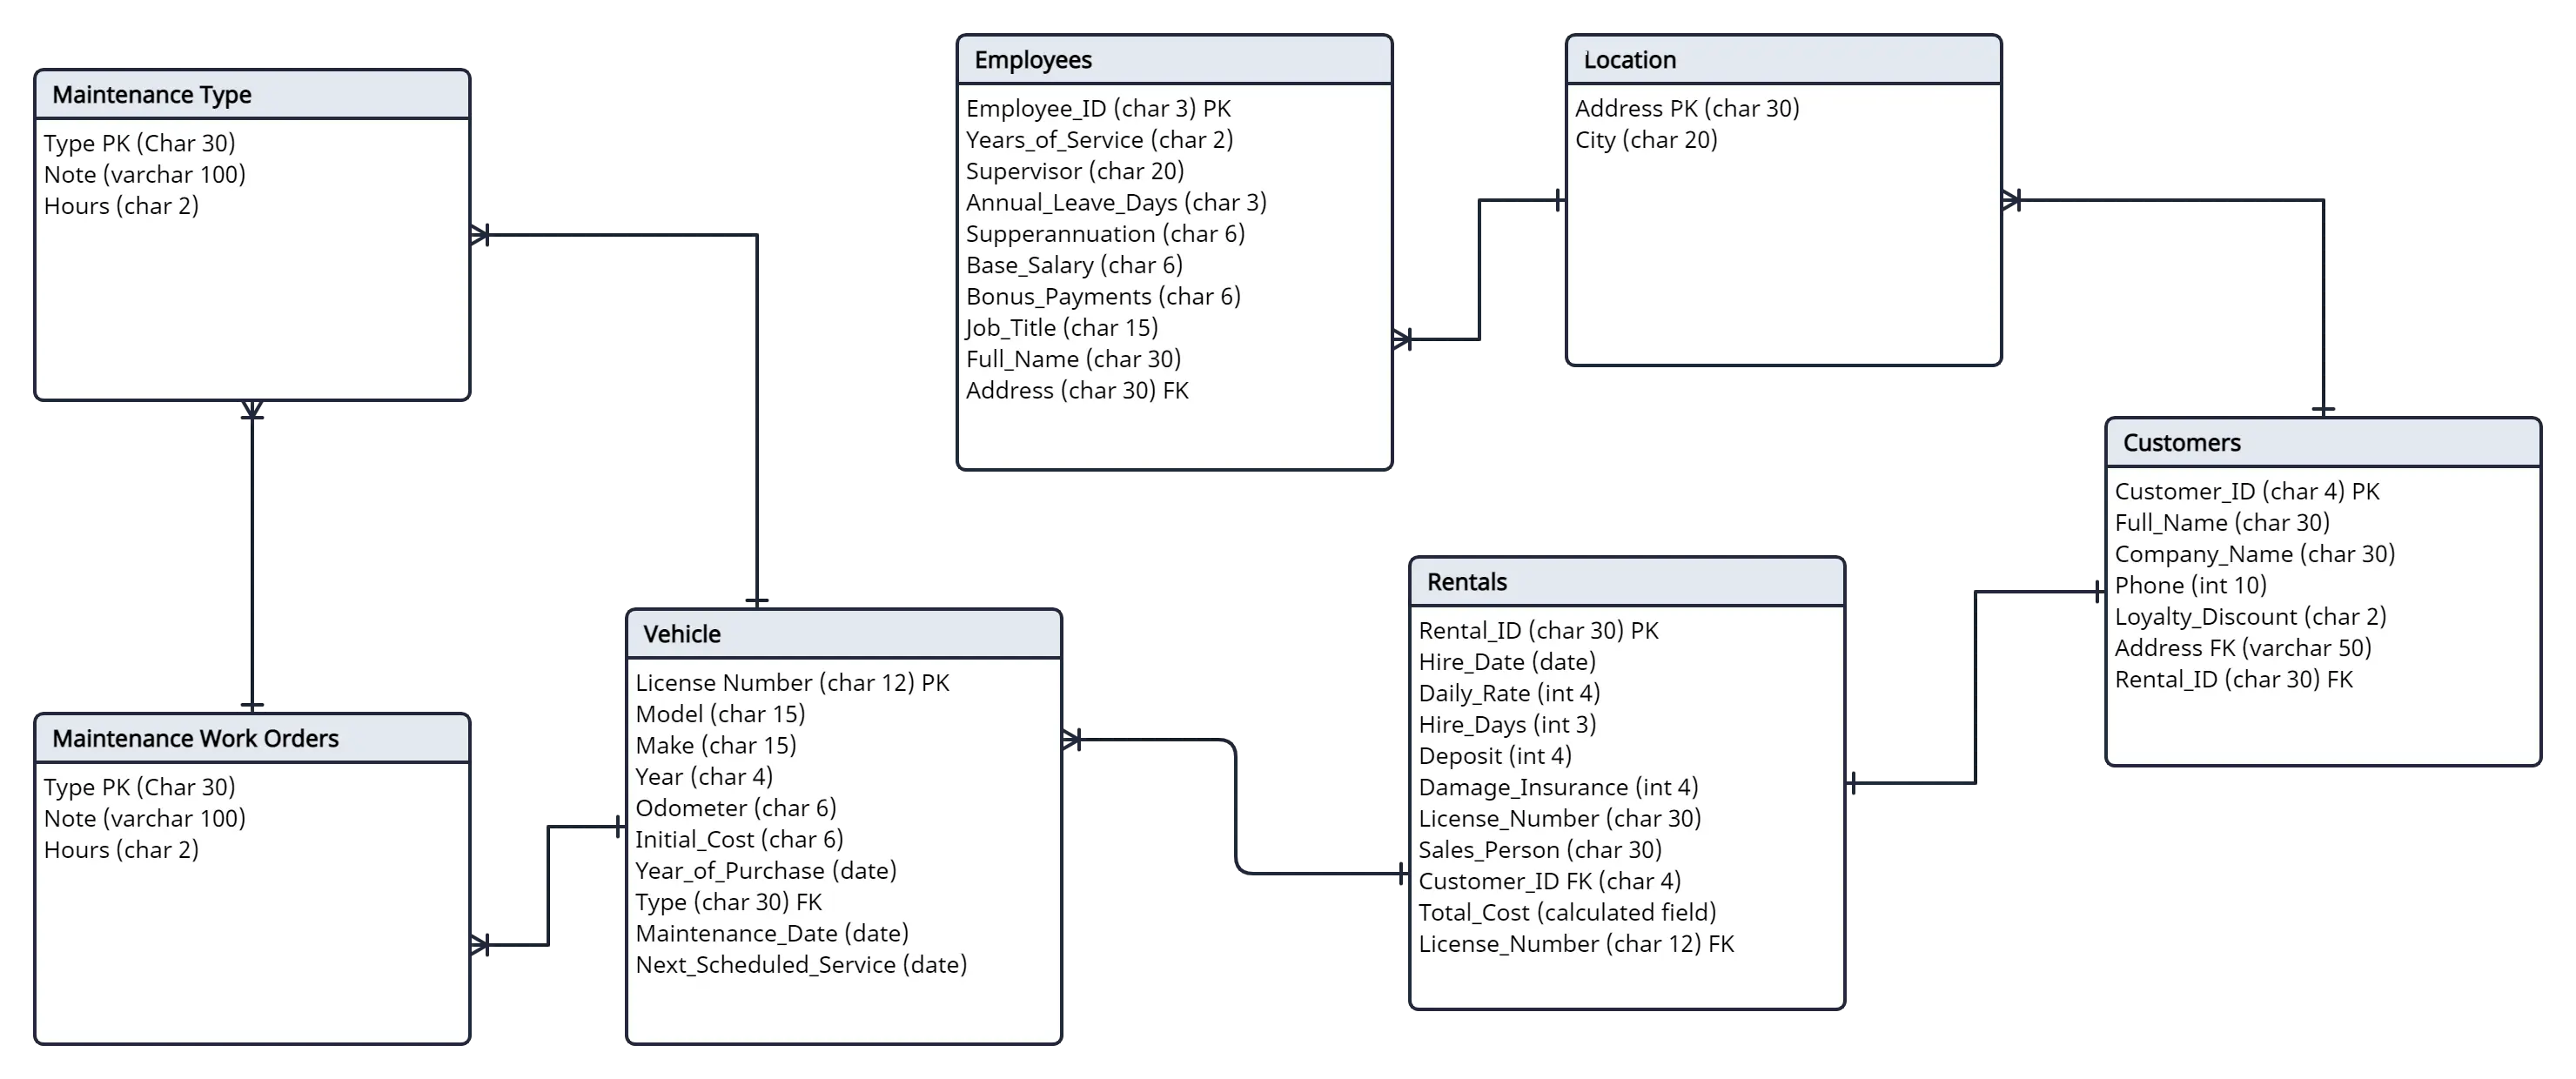
Car Rental Relational Database Diagram
The following database model diagram example is of a car rental database. You can directly export it as a template or you can edit it by adding the particular details of the database you are creating. Click the image to start modifying online.
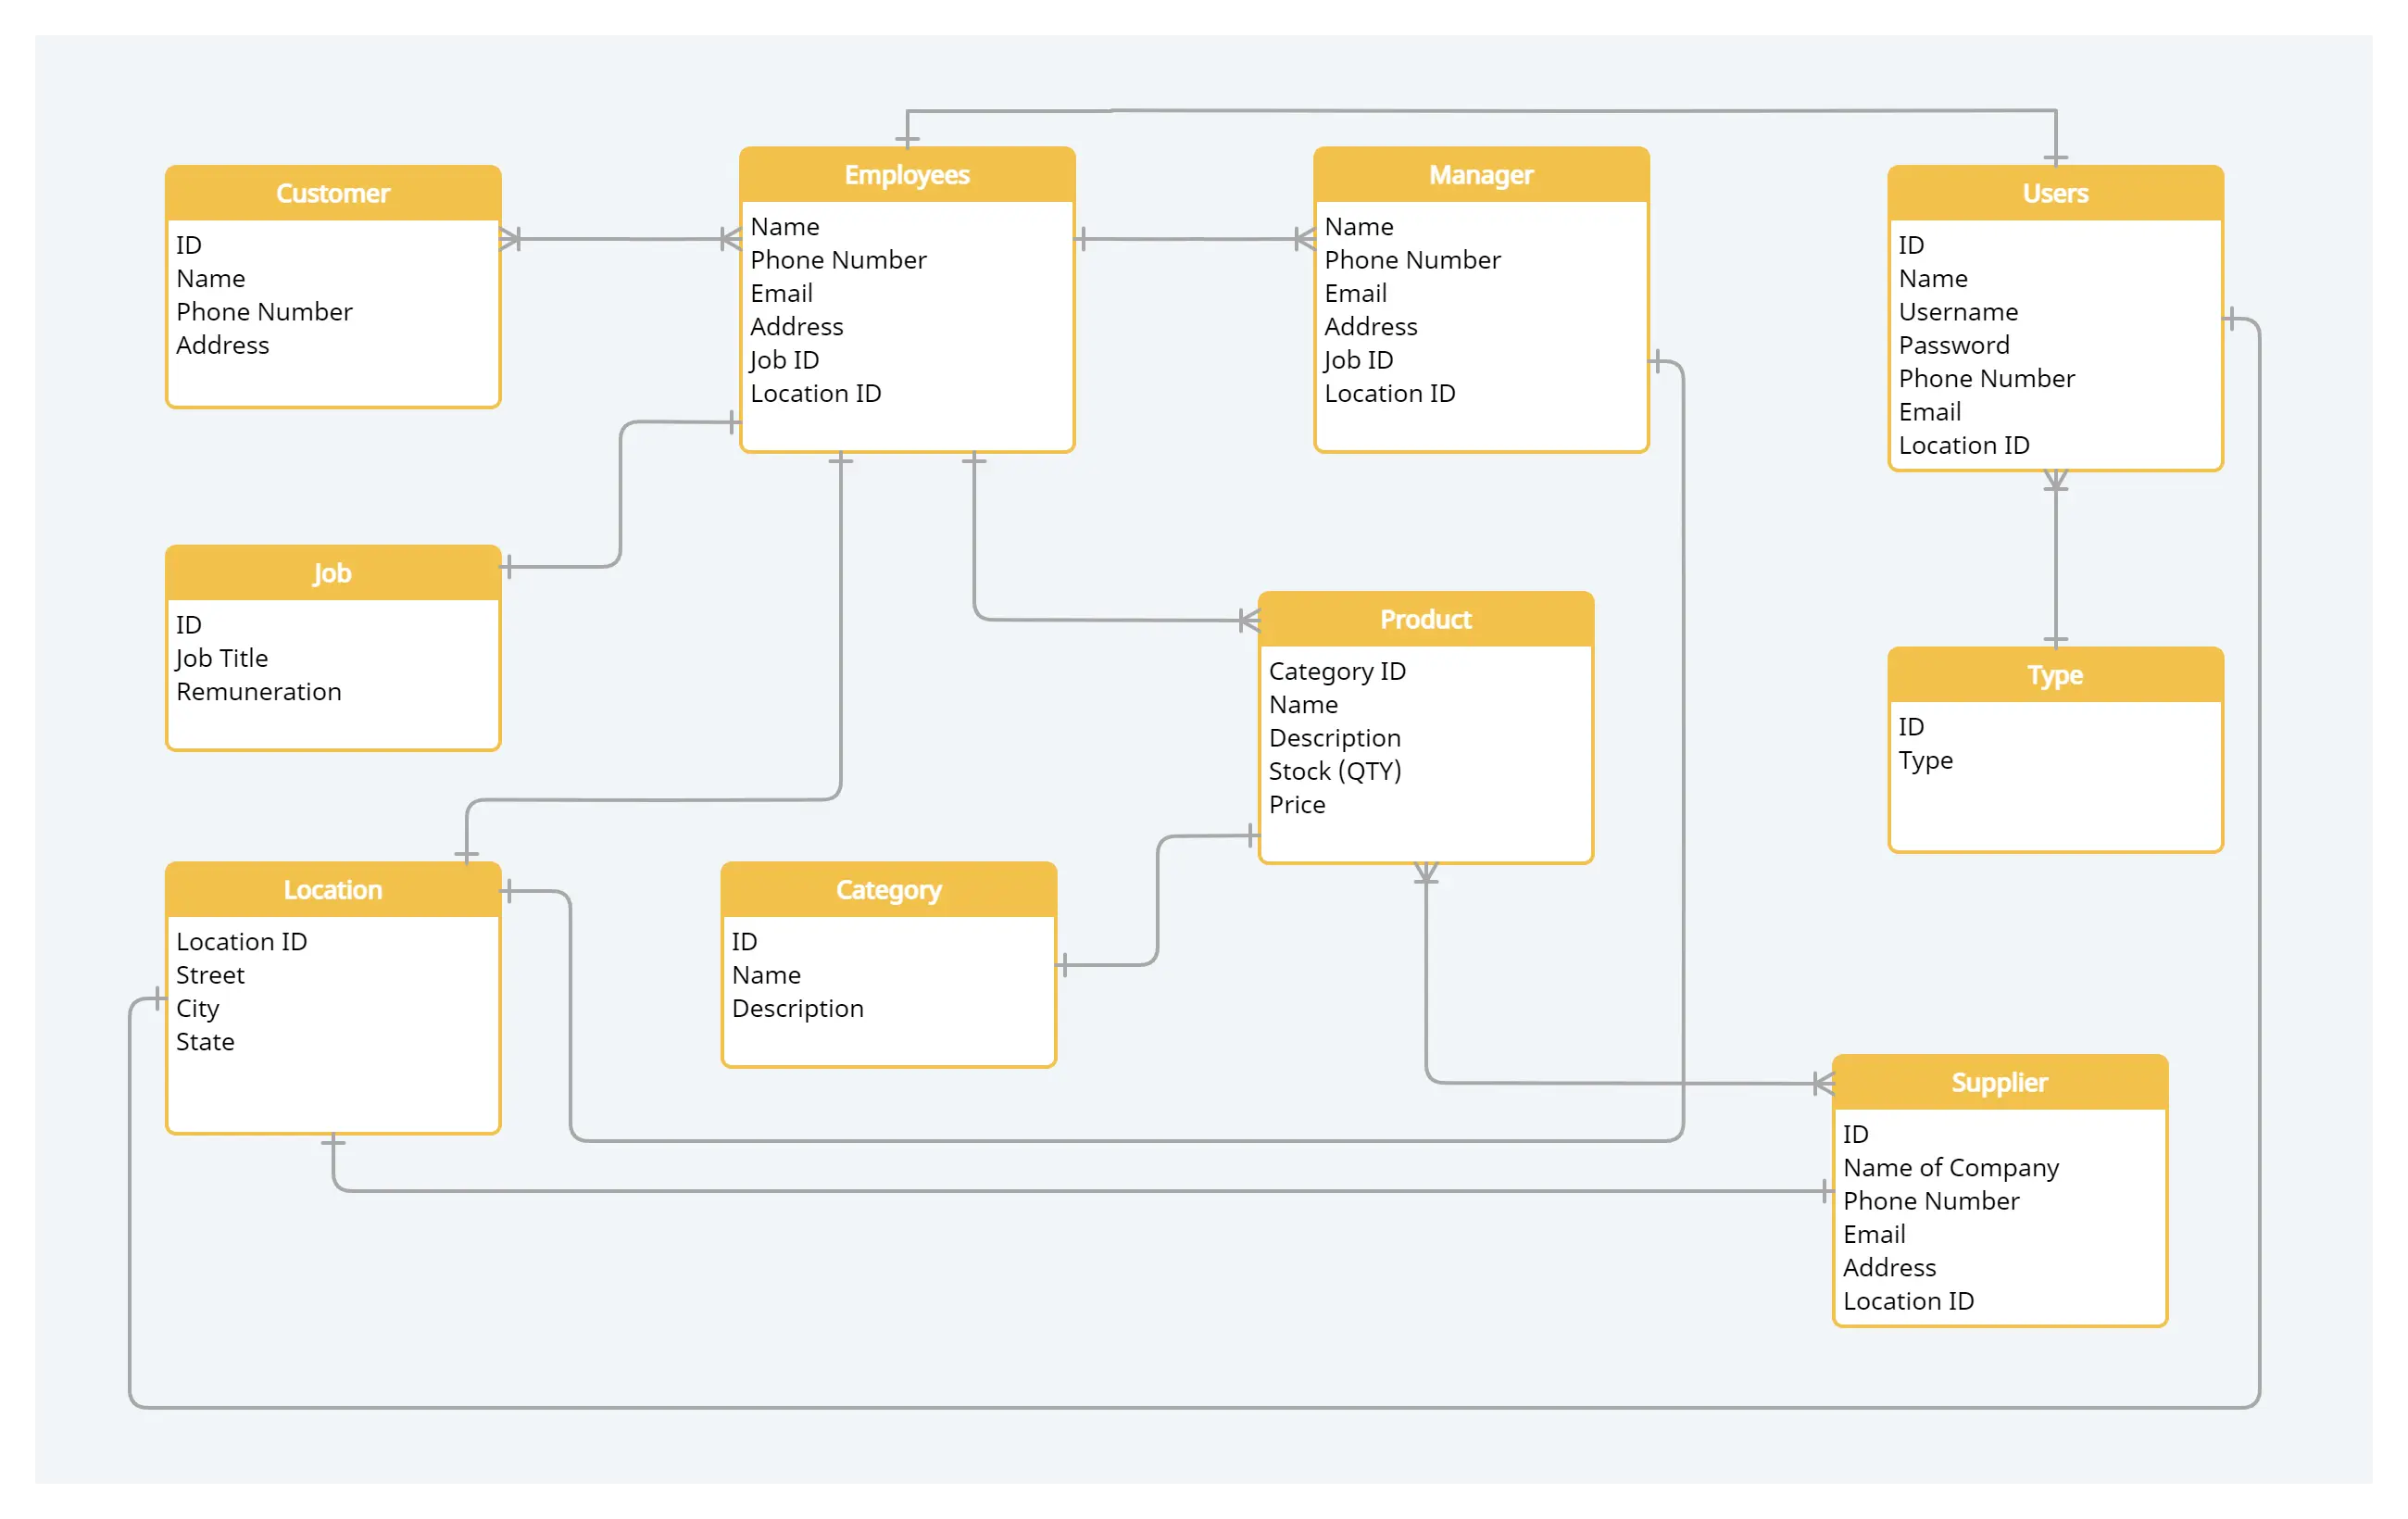
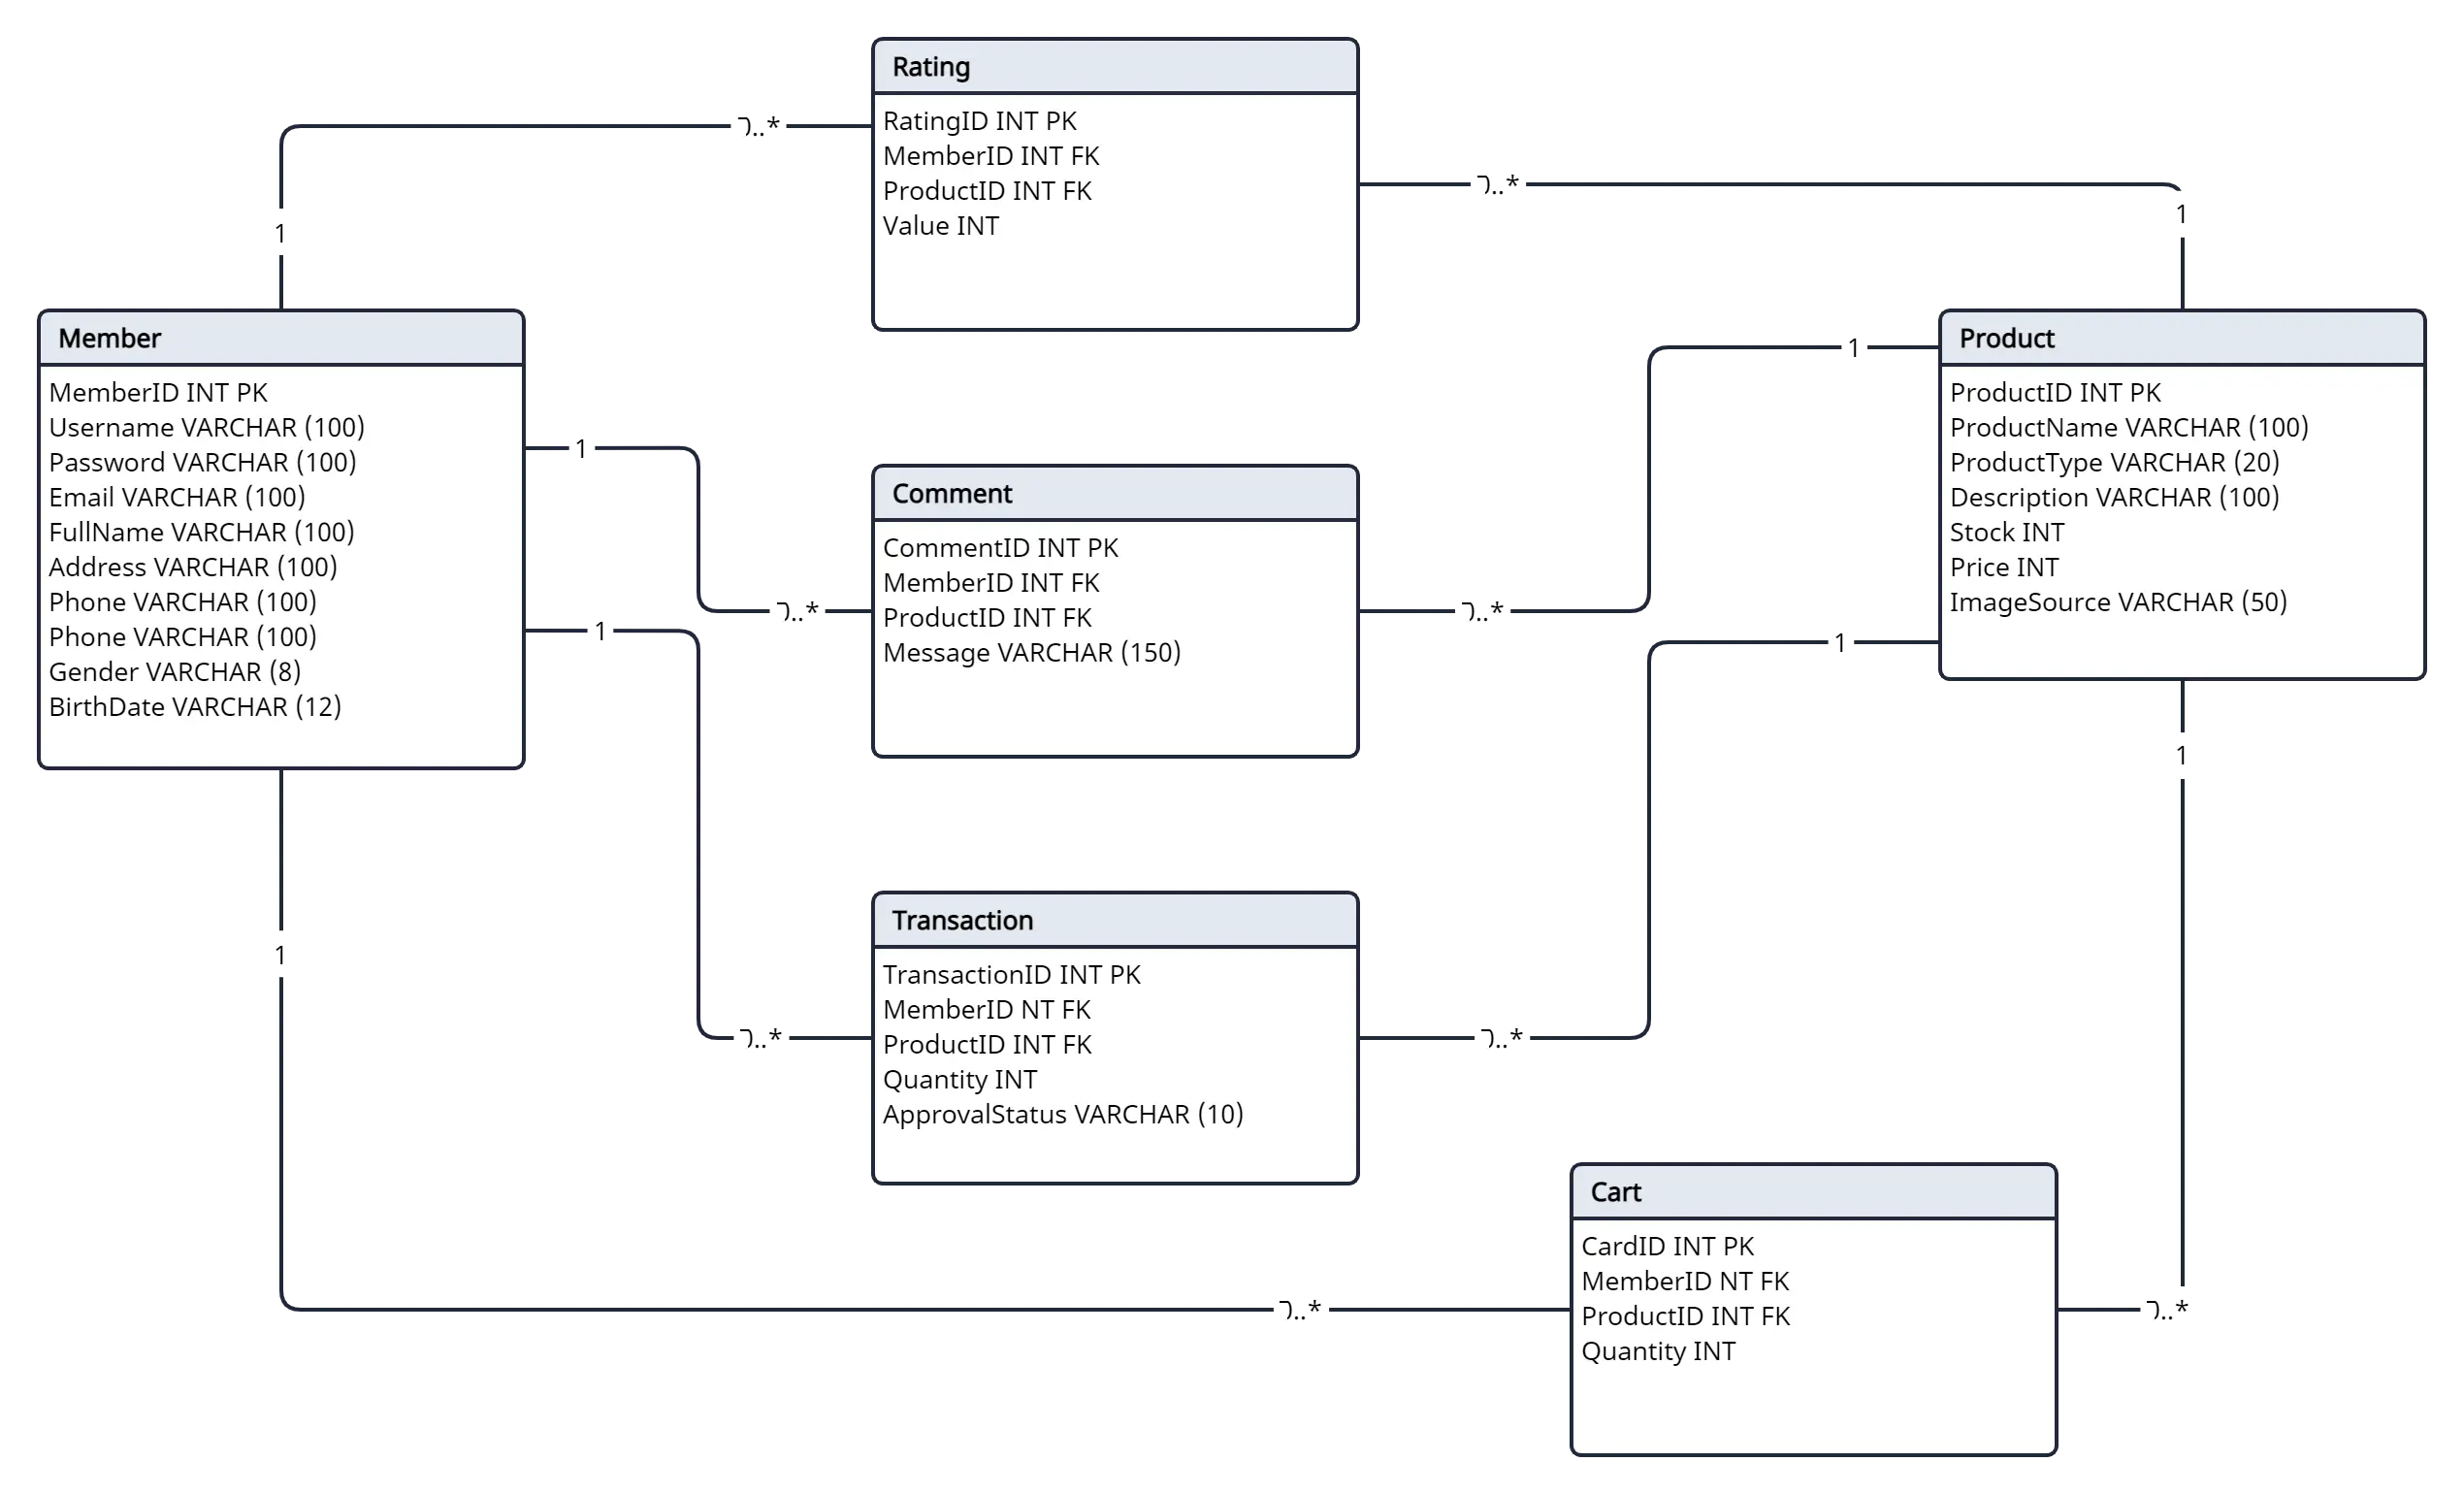
Online Store Database Diagram
Here is a database design diagram for an online store. Unlike in the above database examples, which use Crow Foot notation symbols, the notation symbols used to express cardinality in this diagram are Martin Style Notation Symbols. Click the image to open the template in the editor to make the changes you want.
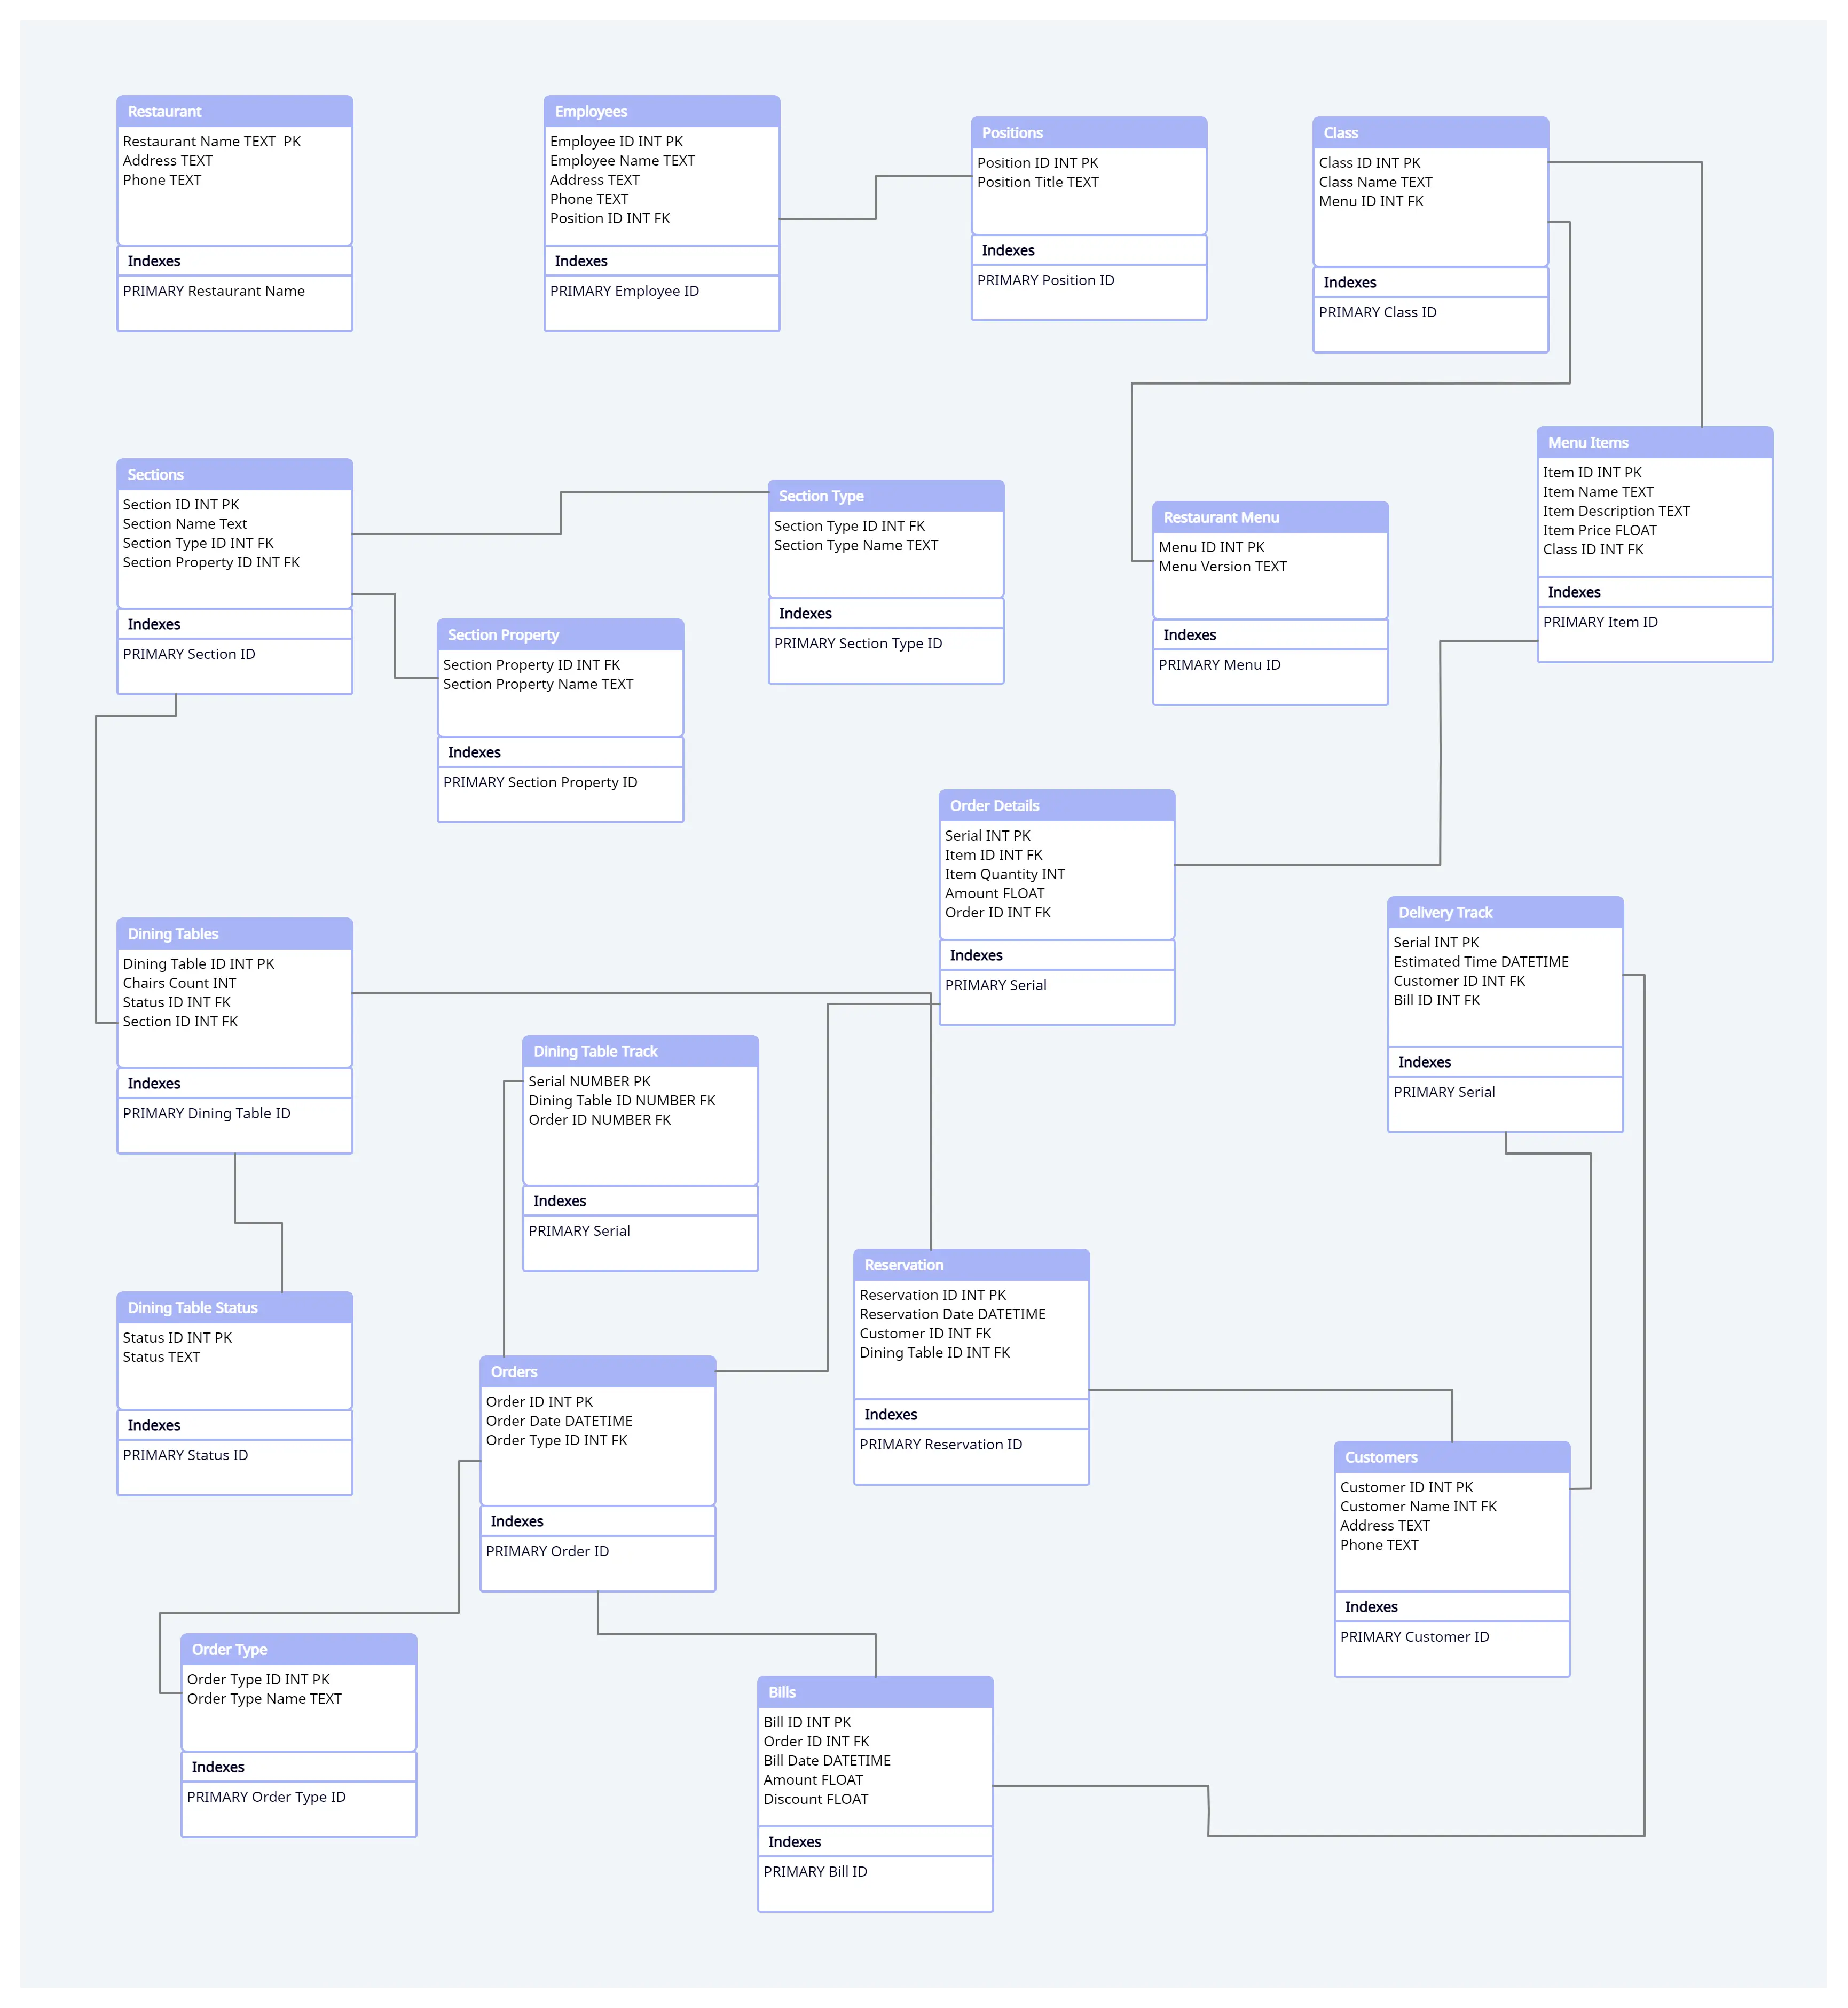
Relational Database Diagram Example for Restaurants
Compared to the database model examples we have looked at so far, the one below is somewhat a larger diagram. It shows a restaurant database diagram. Creating such a comprehensive database diagram like this is easier with Creately. Click the template to extend it further with the help of 1-click create.
More Database Model Examples
The database diagram templates listed above are expertly designed just for your benefit. You can use them when you are creating a database model. If you want more database model templates, go ahead and check out the examples provided by our users.
More Diagramming Templates
- Use Case Diagram Templates
- Fishbone Diagram Templates
- Mind Map Templates
- Business Process Model Templates
- Storyboard Templates
- Network Diagram Templates
- Venn Diagram Templates
- KWL Chart Templates
- Work Breakdown Structure Templates
- SWOT Analysis Templates
- Class Diagram Templates
- ER Diagram Templates
- Sequence Diagram Templates
- Organization Chart Templates
- Gantt Chart Templates
- Activity Diagram Templates
- Deployment Diagram Templates
- AWS Architecture Diagram Templates
- UI Mock-up Templates
- Cisco Templates
- Sitemap Template
- Data Flow Diagram Templates
- Android Mockup Templates