Using a concept map for research helps researchers organize and represent ideas, concepts, and their relationships within a research project. In this guide, we will explore how concept mapping in research can simplify the process of visualizing your ideas, enhance your critical thinking, and improve your research outcomes.
What Is a Concept Map for Research?
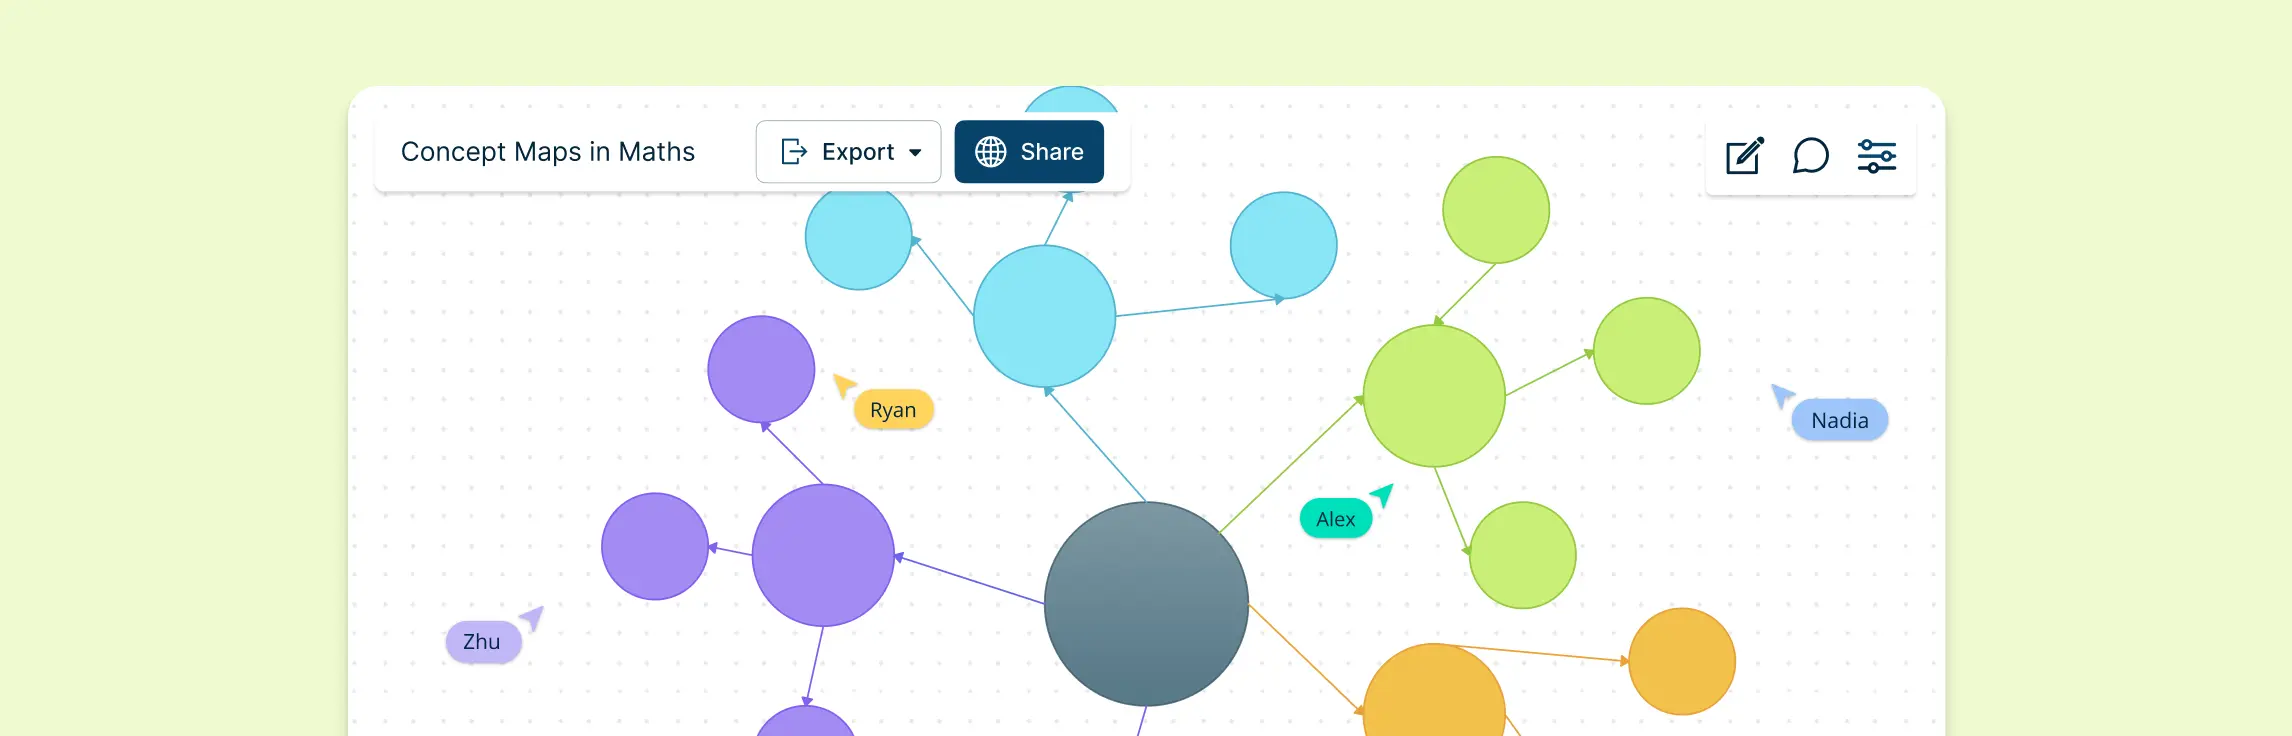
A concept map for research is a visual representation that organizes and structures information, helping researchers map out their ideas and the relationships between them. Essentially, it’s a diagram that shows how different concepts, theories, or findings in your research are interconnected. This tool is especially valuable when working on complex research topics, as it simplifies complex ideas by illustrating them in a clear and easy-to-understand format.
In research, concept mapping aids in organizing thoughts, identifying knowledge gaps, and streamlining the analysis process. Whether you’re reviewing literature or planning experiments, a concept map for research makes the project more manageable, helping you see the bigger picture and communicate ideas clearly.
Navigating Research Visuals: Which Map Do You Need?
While these terms are often used interchangeably, they serve distinct roles in the academic workflow. Choosing the right visual framework depends on whether you are brainstorming a new topic, analyzing existing literature, or defining the variables of your study.
| Map Type | Primary Purpose | Best For | Structural Key |
|---|---|---|---|
| Research Concept Map | Visualizing relationships between complex theories and ideas. | Developing theoretical frameworks and testing hypotheses. | Networked: Uses cross-links and “linking phrases” (e.g., “leads to”, “contradicts”). |
| Research Map | Outlining the entire scope and procedural steps of a project. | Project management, grant proposals, and methodology design. | Sequential: Usually follows a chronological or procedural flow. |
| Mind Map | Hierarchical brainstorming around a single central topic. | Early-stage topic selection and keyword branching for SEO or search queries. | Radial: Ideas radiate outward from a single central node. |
| Literature Map | Mapping the “citation web” and lineage of academic papers. | Systematic reviews and identifying specific research gaps. | Relational: Focuses on connections between authors, years, and findings. |
Why Use Concept Maps in Research?
Concept maps for research offer a variety of benefits that can significantly improve the way you approach and organize your research. From enhancing critical thinking to visualizing complex relationships, they serve as an invaluable tool throughout the research process.
1. Enhancing Critical Thinking and Clarity
Concept maps for research help researchers engage in deeper critical thinking by forcing them to break down complex ideas into simpler components. By visually mapping out relationships between concepts, it becomes easier to analyze connections, identify gaps in understanding, and clarify thought processes.
2. Visualizing Relationships Between Research Components
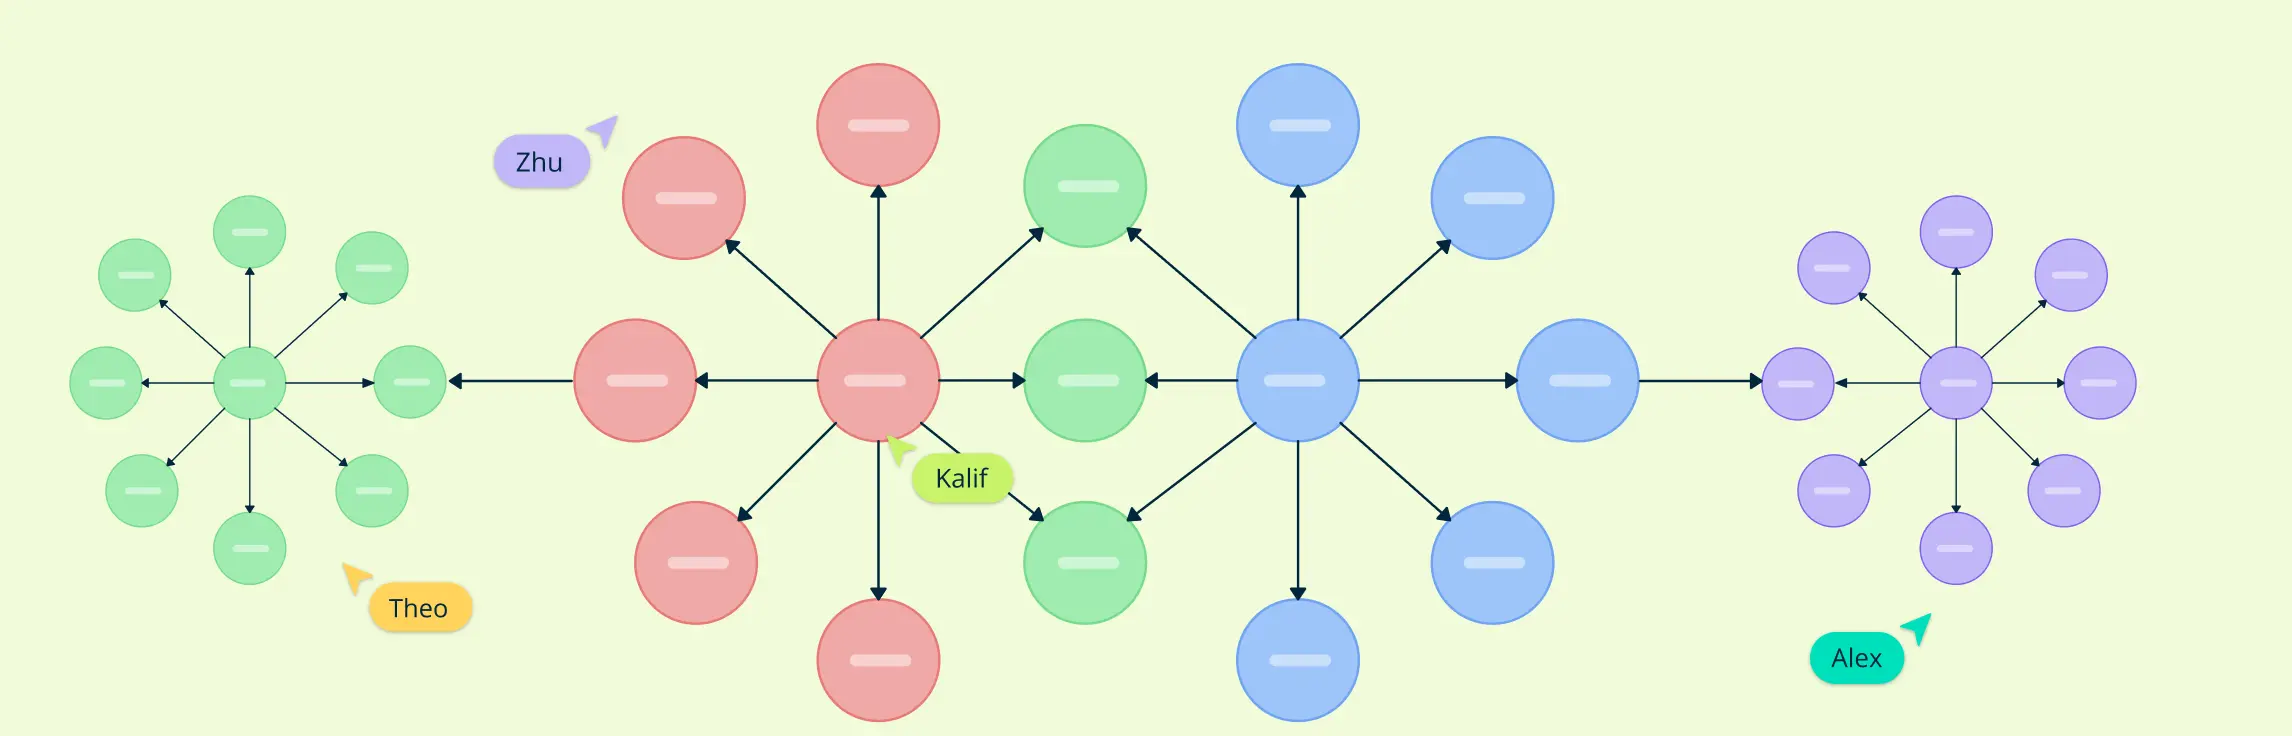
In any research project, there are often many interconnected ideas and concepts. Concept mapping in research makes these connections clear by showing how different elements relate to one another. By visualizing these relationships, you can better understand the structure of your research, whether it’s theories, variables, or data points, making it easier to see patterns or trends.
3. Streamlining Literature Reviews and Data Analysis
When conducting literature reviews or analyzing data, it’s easy to become overwhelmed by the sheer volume of information. A concept map for research simplifies this process by helping you organize findings in a way that highlights key themes and insights.
4. Natural Inclusion of Concept Mapping in Research
Integrating concept maps in research helps researchers maintain focus and structure throughout the project. Whether you are outlining your study, analyzing data, or summarizing findings, concept mapping provides a visual reference that can guide decision-making and enhance communication.
Types of Concept Maps in Research
Different types of concept maps can be applied to research. Depending on the structure of your ideas and the goals, the concept map for a research paper can vary. Each type serves a unique purpose and supports various research methodologies. Below are the most commonly used types of concept maps in research:
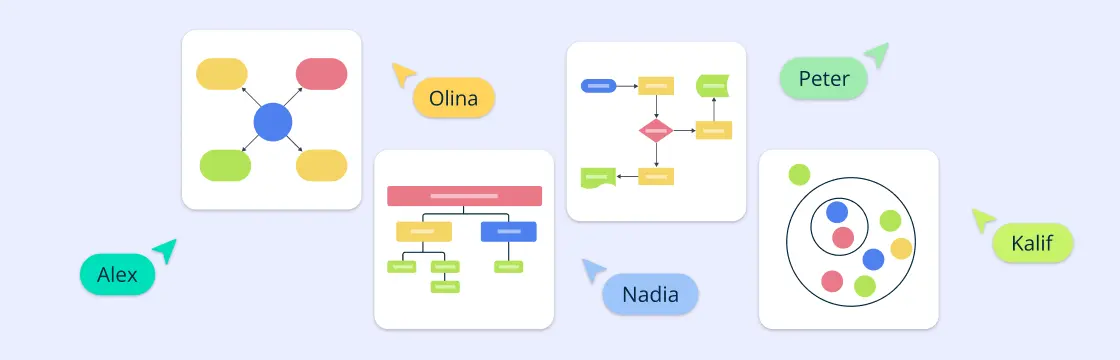
1. Hierarchical Concept Maps
These maps start with a central idea at the top, branching into detailed sub-concepts. Ideal for research with a clear, top-down structure like theories or frameworks, they help logically organize information.


2. Flowchart Concept Maps
Flowchart maps illustrate processes, steps, or sequences, making them perfect for research involving procedures, such as experimental methods or workflows. They effectively represent cause-and-effect relationships.

3. Spider Concept Maps
Spider maps place the central idea in the middle, with related sub-concepts radiating outward. Great for brainstorming or exploratory research, they show connections between multiple related ideas without a strict hierarchy.

4. System Concept Maps
System maps focus on interactions between components in complex systems, making them ideal for ecological studies, social systems, or research involving dynamic relationships.

Each type of research concept map serves a specific purpose and can be used to support different aspects of your research methodology. Whether you are outlining theories, mapping processes, or exploring interconnections, selecting the right type of concept map will help you visually organize your research in a way that makes the most sense for your study.
Approaches to Using Concept Maps in Research
Researchers adopt different approaches to concept mapping in research, depending on their study’s objectives. The three primary approaches—relational, clustering, and word frequency—offer unique ways to visualize and analyze data.
1. Relational Approach
The relational approach follows Novak and Gowin’s (1984) method of organizing concepts through graphical representations. Concepts are linked by connecting lines, with words describing the relationships between them. This approach is commonly used for:
Data collection: Researchers use it to structure and organize information.
Analysis: It helps in identifying relationships between concepts.
Presentation: Findings can be visually represented for better understanding.
2. Cluster Approach
In the cluster approach, participant-generated statements are sorted, rated, and then mapped using multidimensional scaling (MDS). The result is a point-cluster map, where groups of related concepts are visually represented.
This method introduces concept mapping at the data analysis stage, making it useful for categorizing and structuring findings.
It is primarily used for data presentation, allowing researchers to group concepts based on thematic similarities.
3. Word Frequency Approach
The word frequency approach analyzes qualitative data by examining the occurrence and co-occurrence of words. Researchers create concept maps where:
- Each concept is represented as a dot.
- The size of the dot reflects the frequency of the concept.
- Concepts that frequently appear together are placed closer, with the distance indicating their level of association.
Choosing the Right Concept Map for Different Research Approaches
1. Qualitative Research Concept Map
For qualitative research, where the focus is on exploring concepts, experiences, and relationships, the best concept maps are those that capture complexity and interconnectedness.
Spider Concept Map: Ideal for exploring central themes with multiple related ideas. For example, in studying user experiences with a product, the central node can be User Experience, branching out to usability, aesthetics, emotions, and functionality.
System Concept Map: Useful for showing dynamic relationships between variables. In qualitative research like social behavior studies, it helps illustrate feedback loops and causal relationships.
Flowchart-Based Concept Map: Suitable for outlining processes, such as decision-making patterns or behavioral sequences, allowing researchers to track how one factor leads to another.


These maps help researchers visualize themes, relationships, and patterns, providing a structured overview while maintaining flexibility for evolving insights.
2. Quantitative Research Concept Map
Quantitative research relies on numerical data, variables, and measurable outcomes. The best concept maps here highlight structured relationships and data flow.
- Hierarchical Concept Map: Perfect for representing structured research, such as hypothesis testing or experimental design. It organizes variables from general (independent variables) to specific (dependent variables) with clear cause-and-effect relationships.
- Flowchart Concept Map: Useful for mapping out statistical procedures or research methodologies like survey processes or data analysis workflows, showing step-by-step progression.
- Matrix Concept Map: Best for comparing variables and datasets, often used in correlational studies to display relationships between different quantitative factors.


These concept maps support clarity and precision, allowing researchers to present data-driven relationships and streamline complex research structures.
3. Concept Map for Research Topic
When selecting a concept map for a research topic, the goal is to outline key areas of focus and potential research paths.
Spider Concept Map: Best for brainstorming and exploring multiple angles of a topic. For example, a central theme like Climate Change could branch into policy, economics, environmental impact, and technology.
Hierarchical Concept Map: Useful for narrowing down broad topics into more focused research questions or objectives.

- Flowchart-Based Map: Ideal for mapping out the research process, from identifying the problem to concluding findings.

Choosing the right concept map for a research topic ensures a clear structure, helping researchers define scope, identify relevant subtopics, and plan methodologies effectively.
Examples of Research Concept Maps
To better understand how a concept map for research can be applied across different fields, let’s explore examples tailored to various disciplines.
| Research Context | Type of Concept Map | Mapping Techniques Applied | How It Works |
|---|---|---|---|
| Social Sciences: Exploring the Impact of Social Media on Mental Health | Spider Concept Map | Central theme with multiple related subtopics; no strict hierarchy | Central idea (Impact of Social Media on Mental Health) at the center, with branches to subtopics like self-esteem, anxiety, cyberbullying, and social connectivity. Each subtopic further breaks into factors like screen time, peer validation, or harassment. |
| STEM: Renewable Energy Adoption in Urban Areas | Hierarchical Concept Map | Top-down structure from general to specific concepts | Primary concept (Renewable Energy Adoption) at the top, branching into energy types (solar, wind, hydro), then into adoption factors (policies, infrastructure, awareness), and further into outcomes like reduced carbon emissions. |
| Business: Analyzing Market Entry Strategies for Startups | Flowchart-Based Concept Map | Sequential flow representing decision-making paths and outcomes | Begins with a central question (e.g., How Should Startups Enter New Markets?) and flows through strategic steps: research, entry mode (e.g., partnerships), resource allocation. Each decision node links to risks and success metrics. |
| Healthcare: Understanding the Spread of Infectious Diseases | System Concept Map | Interconnected nodes showing dynamic relationships and feedback loops | Central topic (Spread of Infectious Diseases) connects to elements like transmission methods, population density, healthcare capacity, and vaccination rates. Arrows show bidirectional effects, e.g., density increases spread, which impacts healthcare load. |
How to Make a Concept Map for Research
Creating a concept map for research is a structured process that helps you visualize ideas, organize information, and clarify relationships between key concepts. Follow these step-by-step instructions to develop an effective concept map that supports your research goals.
Step 1: Identify the Main Research Topic
The first step in making a concept map for research is selecting your primary research question or topic. This central idea will be the focal point of your map.
Step 2: Determine Key Concepts and Subtopics
Next, brainstorm the key concepts, subtopics, and themes related to your main topic. These supporting ideas will form the second layer of your map.
Review literature, research papers, and notes to extract relevant themes, variables, or processes connected to your main topic. Use digital tools like Creately to jot down these concepts before organizing them.
Step 3: Establish Relationships Between Ideas
Now, connect the key concepts by identifying how they relate to each other and the main topic. Draw lines or arrows between ideas and label these connections to clarify the nature of each relationship.
Use descriptive linking words like “causes,” “leads to,” “impacts,” or “requires” to specify relationships.
Step 4: Organize and Refine the Map
After establishing the connections, refine your concept map by arranging ideas in a logical structure that supports your research methodology.
Group related subtopics together and consider using color coding to distinguish different themes or categories. Ensure that the map flows logically from general to specific concepts, making it easy to follow and understand.
Step 5: Use Visual Diagramming Tools
While you can create a concept map by hand, using Creately offers advanced features that make the process faster and more efficient.
Step 6: Review and Revise Your Concept Map
Finally, review your concept map for research to ensure it accurately represents your research topic and relationships between concepts.
How Concept Maps Enhance Every Stage of the Research Process
1. Literature Review: Synthesizing the “Scholarly Conversation”
Instead of summarizing papers one by one, use a concept map to identify “schools of thought.”
- Goal: Move from a summary to a synthesis.
Place your core research topic in the center. As you read, add nodes for major findings. Connect different authors to the same finding node to see where consensus exists, or use “conflict” lines to show where scholars disagree.
2. Research Questions: Narrowing the Scope
A concept map helps you deconstruct a vague interest into a researchable problem by identifying the “unexplored branches.”
- Goal: Ensure the research question is neither too broad nor too narrow.
Start with your broad topic (e.g., “Artificial Intelligence”). Branch out into sub-themes (Ethics, Efficiency, Bias). Continue branching until you reach a specific intersection that lacks a connection—this “missing link” is your potential research question.
3. Variables: Establishing Causal Logic
This is the stage where you define the “mechanics” of your study. It prevents the common error of “confounding variables” by forcing you to visualize every influence.
- Goal: To create a clear conceptual framework for quantitative testing.
Use standard shapes for different variable types—rectangles for Independent Variables (the cause) and ovals for Dependent Variables (the effect). Add Mediating Variables in between to explain how the cause leads to the effect.
4. Methodology: The Operational Roadmap
A methodological map ensures that your data collection methods actually align with your research questions.
- Goal: To verify the “Internal Validity” of your research design.
Link each specific Research Question (RQ) to a Data Collection Method (e.g., Survey, Interview) and then to a Data Analysis Technique (e.g., Regression, Thematic Analysis). If an RQ doesn’t have a path to an analysis technique, your methodology is incomplete.
5. Data Analysis: From Raw Data to Themes
In qualitative research, a concept map acts as a “thematic workspace” where you can move codes around to see how they form larger categories.
- Goal: To move from raw data to high-level abstract themes.
Create nodes for your “initial codes” (small snippets of meaning). Drag and drop related codes into groups. Once a group feels solid, draw a boundary around it and name it as a “Theme.”
6. Thesis Structure: Mapping the Narrative Flow
Before you write, use a map to ensure your chapters don’t just exist in isolation but build toward a single conclusion.
- Goal: To maintain “The Golden Thread” (the central argument) throughout the document.
Map the “Claim” of each chapter. Draw arrows between chapters to show how the conclusion of Chapter 2 provides the necessary foundation for the investigation in Chapter 3.
well-structured concept map for research is a powerful tool for organizing ideas, visualizing complex relationships, and streamlining the research process. By applying effective concept mapping in research, you can enhance critical thinking, simplify data analysis, and improve the clarity of your research outcomes. Start building your concept map for research today with Creately and transform the way you plan, structure, and present your research projects.
Helpful Resources
Explore how concept mapping is a dynamic and visual note-taking method that facilitates a deeper learning experience and enhances the retention of information.
Learn how to use concept maps in science education to organize and structure knowledge effectively to enhance scientific understanding and make complex information more accessible.
Discover what a career concept map is and its benefits, and explore ten templates to help you progress in your career
Discover how to effectively use concept maps in education to improve student understanding, organize ideas, and enhance learning.
FAQs on Concept Map for Research
How does a concept map improve the research process?
Can concept maps be used for collaborative research projects?
When should I create a concept map during my research?
How can concept maps be integrated into academic papers and presentations for research?
What are the best practices for using concept maps in research?
What are the common mistakes to avoid when creating concept maps for research?
- Avoid overloading your map with excessive details, which obscures core relationships.
- Ensure all connections use clear linking phrases to prevent ambiguity.
- Maintain a strict hierarchy to distinguish primary theories from secondary data.
- Don’t ignore feedback; share your map with peers to identify logical gaps before finalizing your study’s design or methodology.
Resources:
Conceição, S.C.O., Samuel, A. and Yelich Biniecki, S.M. (2017). Using concept mapping as a tool for conducting research: An analysis of three approaches. Cogent Social Sciences, 3(1). doi:https://doi.org/10.1080/23311886.2017.1404753.
Markham, K.M., Mintzes, J.J. and Jones, M.G. (1994). The concept map as a research and evaluation tool: Further evidence of validity. Journal of Research in Science Teaching, 31(1), pp.91–101. doi:https://doi.org/10.1002/tea.3660310109.
Wallace, J.D. and Mintzes, J.J. (1990). The concept map as a research tool: Exploring conceptual change in biology. Journal of Research in Science Teaching, 27(10), pp.1033–1052. doi:https://doi.org/10.1002/tea.3660271010.