Modern networks can quickly become complex, devices multiply, connections overlap, and one small change can impact the entire system. Whether you’re setting up a network, managing infrastructure, or trying to explain how everything fits together, having a clear visual makes all the difference. This guide walks you through what network diagrams are, how they’re used, the different types you’ll encounter, and common network topologies.
Network Diagram Definition
A network diagram is a clear visual representation that shows how devices, components, or systems are connected and how they interact with each other. It helps you quickly understand what makes up a network, how information moves through it, and where everything fits. By turning complex connections into an easy-to-read visual, network diagramming makes it easier to plan new setups, troubleshoot issues, and explain network structures to others without getting lost in technical details. In collaboration-heavy environments, better communication and collaboration has been associated with 20-25% productivity gains, making clear network visuals especially valuable (Keller and Meaney, 2013).
What are the Uses of Network Diagrams?
When systems grow, things get complicated fast. Cables overlap. Dependencies get missed. One small change can break something else. Network diagrams help you stay in control before that happens. Here’s why network diagramming is commonly used.
1. Planning and Designing Networks
Before setting anything up, you need a clear plan. At this stage, teams often rely on a network architecture diagram to define how the network should be structured. This lets you map out devices, connections, and topologies in advance, so you can spot gaps, avoid bottlenecks, and build smarter from the start.
2. Troubleshooting and Problem Solving
When something goes wrong, guessing wastes time. A network diagram shows you exactly how everything is connected, making it easier to trace issues, isolate failures, and fix problems faster. In complex organizations, 43% of people in highly matrixed environments say complexity hurts decision quality and speed, so visual clarity directly supports faster response (Marmolejo et al., 2021).
3. Understanding Complex Systems
Large networks can be hard to explain, especially to non-technical stakeholders. Network diagrams turn complex setups into visuals that anyone can understand, helping teams stay aligned and make better decisions. A high-level network architecture diagram is especially useful for explaining system design and dependencies clearly.
4. Improving Communication and Collaboration
Instead of long explanations or scattered notes, a single diagram tells the whole story. Teams use network diagrams to collaborate, review changes, and communicate ideas clearly across departments.
5. Project and Workflow Management
Network diagrams aren’t just for IT. They’re widely used in project management to visualize task dependencies, timelines, and workflows, so everyone knows what comes next and what depends on what.
6. Documentation and Future Reference
Networks change over time. Maintaining an up-to-date network layout gives teams a reliable reference for onboarding, audits, upgrades, or future expansions without starting from scratch.
Types of Network Diagrams
Network diagrams in IT generally fall into two main types. Each one answers a different question, and together, they give you a complete view of your network.
Physical Network Diagram
A physical network diagram shows what your network looks like in the real world. It maps out physical devices such as routers, switches, servers, firewalls, and endpoints, along with the actual cables and ports that connect them. This type of network layout is especially useful when you’re installing new hardware, expanding an existing network, or troubleshooting on-site issues. If a cable fails, a device needs replacing, or equipment must be relocated, a physical diagram helps you see exactly where everything is and how it’s wired, without guesswork.
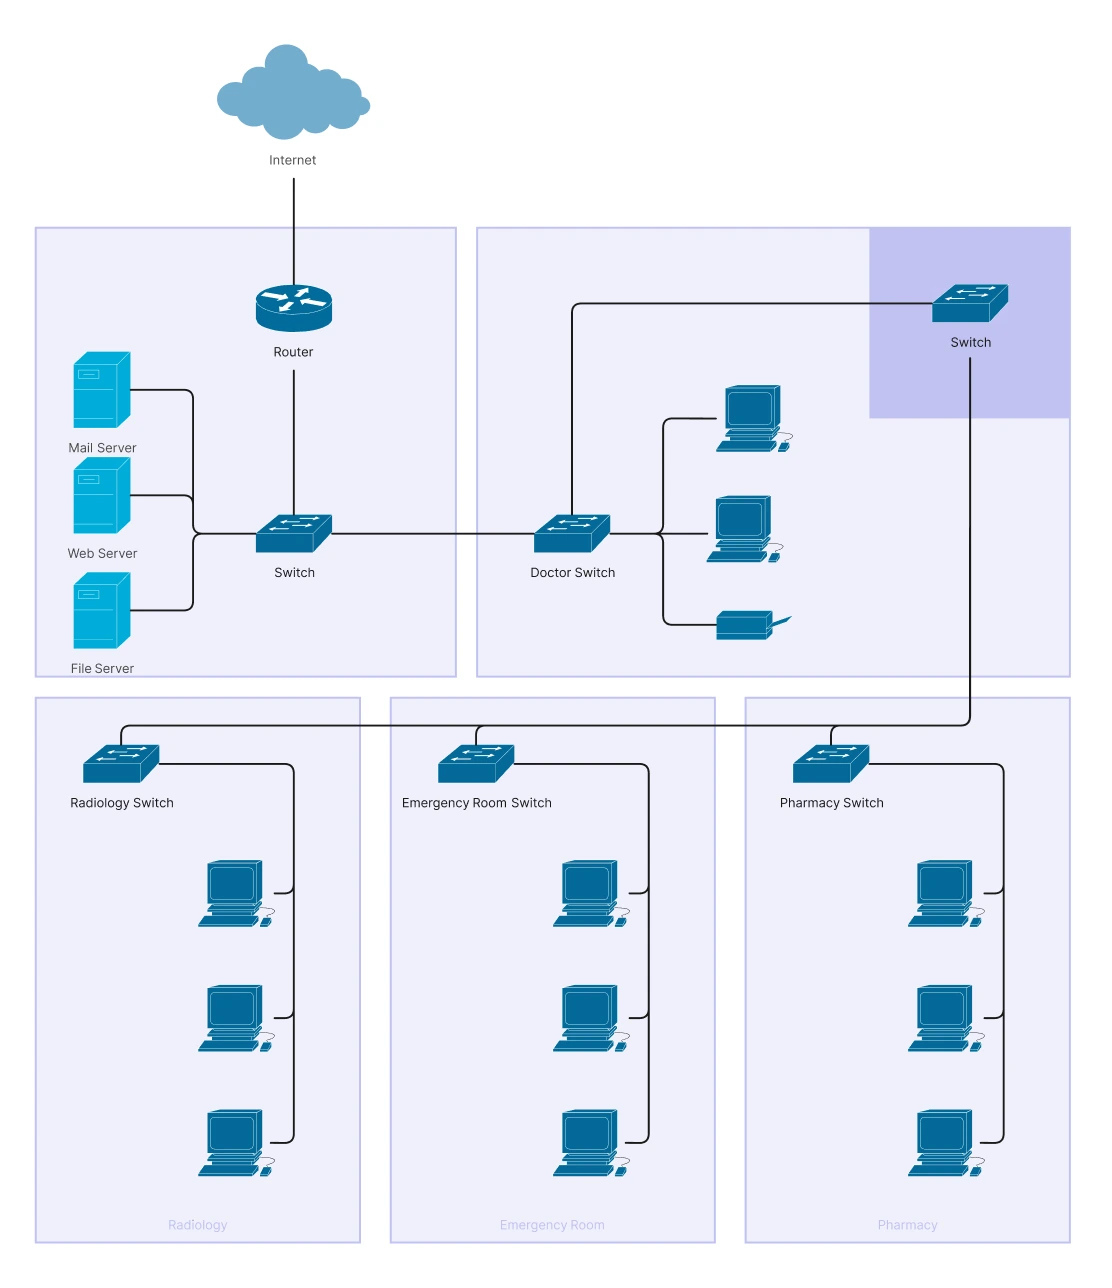
This example shows the real-world layout of a network, including the location of user computers, servers, routers, and switches. It focuses on where each device is placed and how they are physically connected, helping administrators plan installations, manage equipment placement, and troubleshoot hardware-related issues efficiently.
Logical Network Diagram
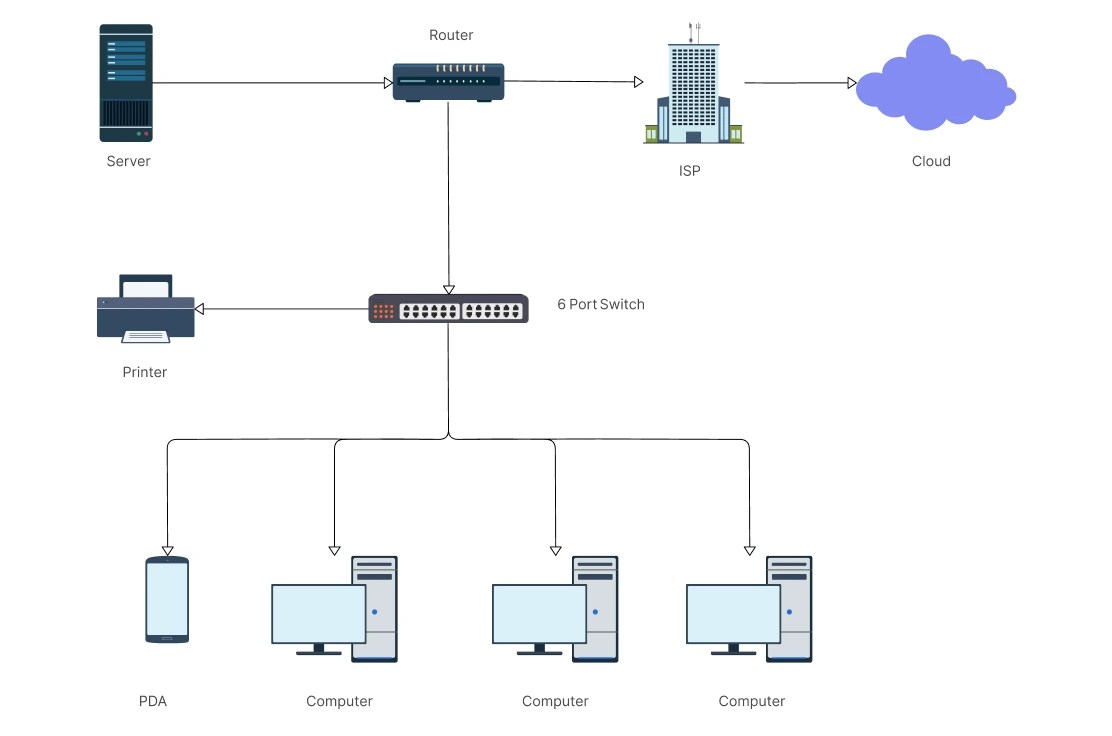
A logical network diagram focuses on how the network works rather than where things are located. It illustrates how devices communicate, how data flows through the network, and how logical elements such as IP addresses, subnets, VLANs, and routing protocols interact. This type of network architecture diagram is essential for understanding high-level network behavior, planning traffic flow, and maintaining security. It helps teams analyze performance, configure routing rules, and explain complex communication paths in a way that’s easy to follow, even for non-technical stakeholders.
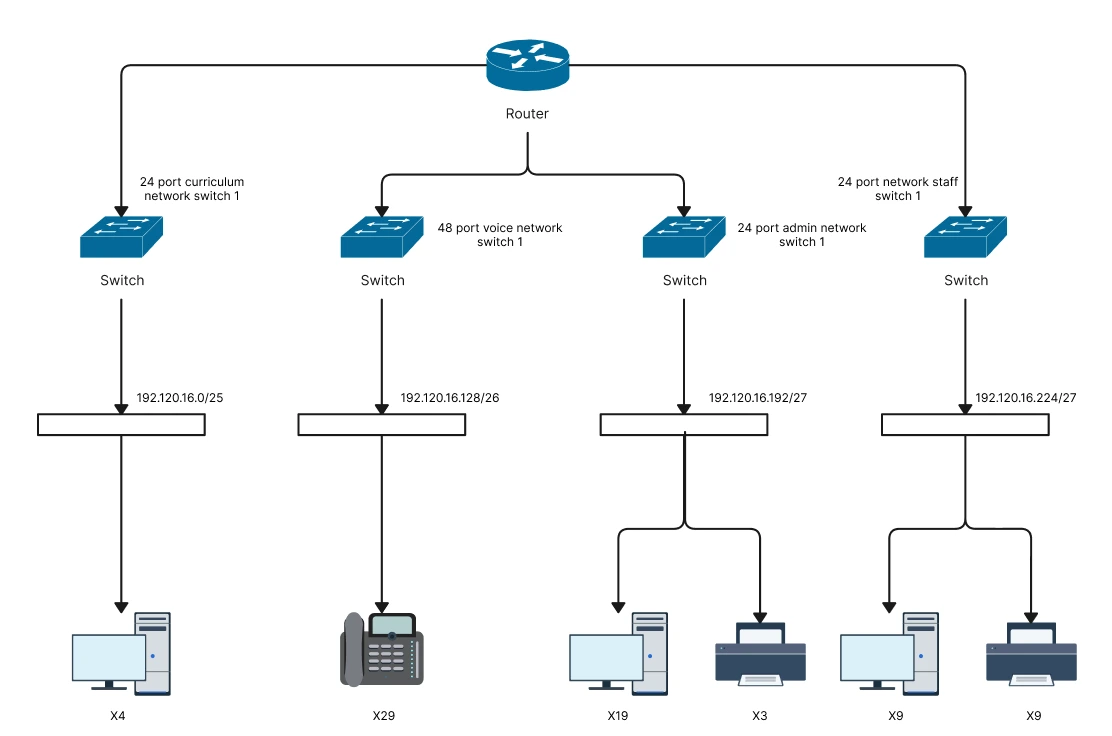
This example shows a router at the center managing information flow through multiple ports. These ports connect to devices such as personal computers, IP phones, printers, and other endpoints, illustrating how data moves between them. Instead of physical placement, the diagram highlights communication paths, helping administrators visualize relationships and monitor how traffic flows across the network.
Types of Network Topologies
Network topologies describe how devices in a network are arranged and connected. Each topology affects how data flows, how reliable the network is, and how easy it is to manage or expand.
Point-to-Point Topology – A direct connection between two devices. It’s simple, fast, and secure, making it ideal for dedicated links such as WAN connections or device-to-device communication.
Bus Topology – All devices share a single central cable. It’s simple and cost-effective but can slow down as more devices are added, and a failure in the main cable affects the entire network.
Star Topology – Each device connects to a central hub or switch. It’s easy to manage and troubleshoot, but the network depends heavily on the central device.
Ring Topology – Devices form a closed loop, with data traveling in one direction around the ring. This ensures orderly data flow, though a break in the loop can disrupt the network.
Mesh Topology – Devices are interconnected with multiple paths between them. It offers high reliability and redundancy but requires more cabling and setup effort.
Tree Topology – A hierarchical structure that combines star and bus topologies. It works well for large networks but can be affected if higher-level nodes fail.
Hybrid Topology – A mix of two or more topologies. It provides flexibility and scalability, making it suitable for complex or growing networks.
Read our guide on 7 Types of Network Topology to learn more about their different use cases, advantages and disadvantages.
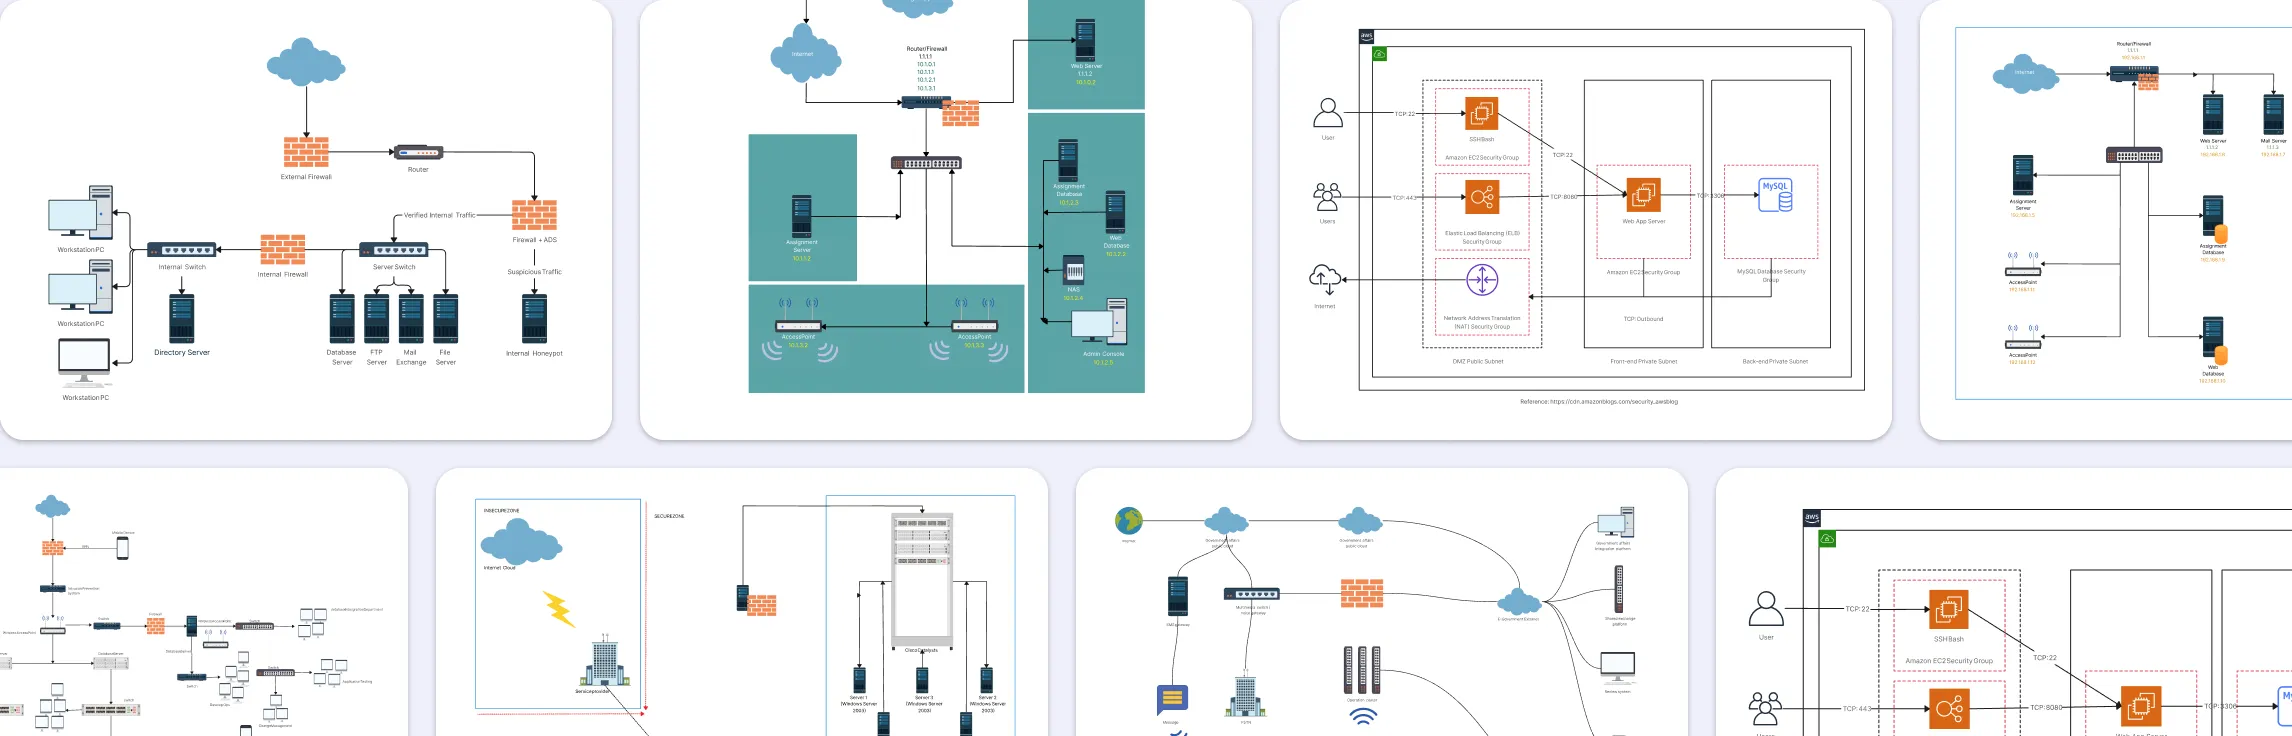
Free Network Diagram Templates for IT & System Design


Helpful Resources for Building Network Diagrams
Learn about the different types of network diagrams with examples.
Learn about the Home Network Diagram and its applications.
Learn about the Wide Area Network Diagram and its applications.
FAQs About Network Diagrams
What information should a network diagram include?
How much detail should a network diagram have?
Can network diagrams help with troubleshooting?
Is there a difference between a network layout and a network architecture diagram?
Resources
Marriott, Kim, et al. “Memorability of Visual Features in Network Diagrams.” IEEE Transactions on Visualization and Computer Graphics, vol. 18, no. 12, Dec. 2012, pp. 2477–2485, https://doi.org/10.1109/tvcg.2012.245.
Thelwall, Mike. “Exploring the Link Structure of the Web with Network Diagrams.” Journal of Information Science, vol. 27, no. 6, Dec. 2001, pp. 393–401, https://doi.org/10.1177/016555150102700605.