Six Sigma Templates
Streamline Business Operations
Collaborate around developing effective strategies to identify and eliminate defects to optimize current processes and improve the output quality.
- Pre-built six sigma templates for process improvement
- Real-time collaboration to align cross-functional workflows
- Built-in brainstorming tools for process mapping & analysis
- Pre-built six sigma templates for process improvement
- Real-time collaboration to align cross-functional workflows
- Built-in brainstorming tools for process mapping & analysis

Easily Identify Errors in Processes
Multiple pre-built six sigma templates to get a headstart; value stream maps, cause & effect diagrams, process maps, pareto charts, and more.
Easy drag and drop tools to streamline mapping out complex business processes and analyzing them.
Professional diagramming tools to plan around process control, problem-solving, and improvement.
Brainstorming tools like mind maps and post-it note walls for conducting root cause analysis, process comparisons, what-if analysis, & more.
Create a Single Source of Truth

Bring six sigma project data from external sources onto the canvas to visualize them as meaningful data shapes for easier analysis and management.
Import images, vectors, screenshots, and more to centralize all process-related assets for easier access.
Embed documents and reference links to specific processes and use in-app previews for easy access.
Add detailed docs, attachments, links and more with notes on process maps to capture further process data and the big picture in a single space.
Built-in tools to create interactive and dynamic presentations, reports, and dashboards on six sigma project plans to inform stakeholders.

Connect All Teams Across the Board
Real-time cursors for any number of participants to collaborate with team members on a shared canvas.
Video conferencing baked into the platform to feel like you are in the same room even when you are working remotely.
Comment with context, have discussions and follow ups on the same canvas. Async!
Full version history to keep track of key points during each iteration of your analysis. Branch out from an earlier version if needed at any time.
Multiple access levels and roles to streamline managing, sharing, editing, and reviewing your documents.
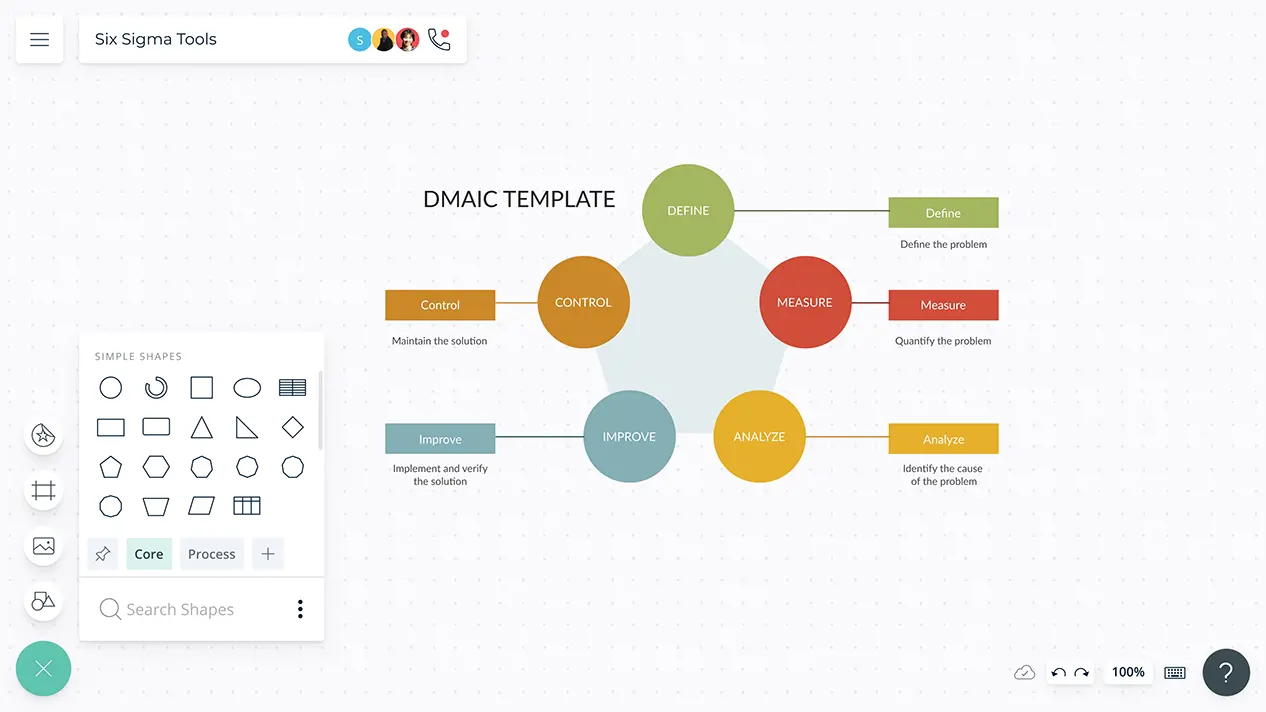
What Is Six Sigma?
Six Sigma is a system - a quality management methodology - businesses use to improve processes, products, or services by identifying and eliminating defects and inefficiencies.
How to Use Six Sigma Templates
- Identify the problem that negatively impacts your business performance or customer satisfaction.
- Create a process map/ value stream map of the current process to closely examine it and understand the status of its current performance.
- Invite process owners to share their knowledge when drawing the process map and examining it for inefficiencies with Creately’s real-time collaboration capabilities.
- Gather enough data to understand the root cause of the problem. Use the 5 Whys analysis or a fishbone diagram to carry out the root cause analysis.
- Brainstorm solutions to eliminate the identified defects. Select the best solutions and create future-state process maps based on them.
- Once the best solutions are implemented, review them regularly to measure the improvements and make adjustments.
- Share the diagrams you have created by embedding them in your organization’s intranet, website or by adding them to presentations and documents so everyone can easily access them.