SIPOC Template
Optimize Business Processes
Understand your business processes at a glance and develop innovative strategies to position yourself ahead of the competition.
- Intuitive visual canvas to quickly map business processes
- Extensive shape libraries for BPMN, flowcharts, process maps and more
- Real-time collaboration to align cross-functional team workflows
- Intuitive visual canvas to quickly map business processes
- Extensive shape libraries for BPMN, flowcharts, process maps and more
- Real-time collaboration to align cross-functional team workflows

Easy Tools for Process Visualization
Multiple pre-made templates to visualize organizational processes, team workflows, swimlanes and more.
Extensive shape libraries and professional diagramming tools to create flowcharts, value stream maps, BPMN, process maps, activity maps and more.
Simple to use drag drop tools with Plus Create to effortlessly visualize complex processes in minutes.
Powerful table and swimlane shapes with advanced customizability to instantly create SIPOC diagrams.
Dynamic connectors that arrange themselves automatically to rotate, expand, or resize your SIPOC diagram tangle-free.
Context-aware shape switching to effortlessly update process maps as decisions and processes evolve over time.
Create A Single Source of Truth

Import images, multimedia content, and links to external sources of information to provide more context to your SIPOC diagrams for easier decision-making.
Built-in tools to create dynamic and interactive presentations, reports, and dashboards to easily present to the relevant stakeholders.
Add documents and assets with in-app previews to create a central access point for all process-related information.
Embed your process maps securely in any site or intranet, or export them as PDFs, PNGs, JPEGs, or SVGs to share or publish them.

Bring Everyone on the Same Page
Online whiteboard with brainstorming tools like mind maps and post-it note walls to easily conduct collaborative process analysis sessions.
Real-time cursors for any number of participants to collaborate with team members on a shared canvas.
Video conferencing baked into the platform to feel like you are in the same room even when you are working remotely.
Comment with context, have discussions and follow ups on the same canvas. Async!
Full version history to keep track of key points during each iteration of your process mapping. Branch out from an earlier version if needed at any time.
Multiple access levels and roles to streamline managing, sharing, editing, and reviewing your process documents.
Develop Comprehensive SIPOC Diagrams

Add detailed docs, attachments, links and more with notes on the SIPOC to capture further process data and the big picture in a single space.
Extend your SIPOC diagram to include additional information on suppliers, customers, inputs, outputs and processes with data fields and custom properties.
Link shapes to build navigational structures in and across workspaces. Connect current-state and future state process maps to keep track of inconsistencies.
Connect to your favorite tools with Creately plugins for Slack, Google Workspace, Confluence and more.
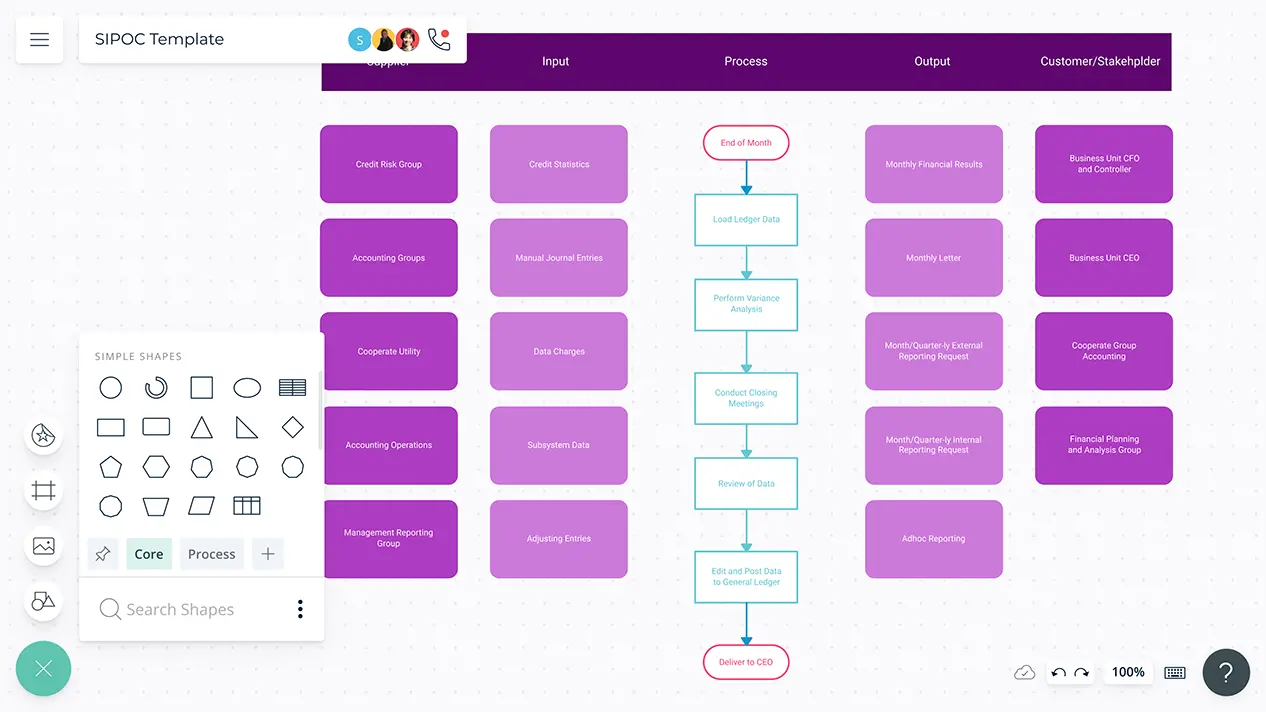
What Is a SIPOC Diagram?
A SIPOC diagram is a process map that provides a high-level overview of a project. It stands for Suppliers, Inputs, Process, Outputs and Customers.
How to Create a SIPOC Diagram?
- Create a team of employees involved in or affected by the process. You can use Creately SIPOC diagram templates to record information as you analyze the process.
- Once you have identified the process you want to analyze, list down the key steps in it. You can write down these steps in the middle column of the SIPOC diagram.
- Or you can map out the steps using a simple flowchart. Make sure not to go into too much detail as your process map should only give a bird’s eye overview of the process.
- List down the key outputs of the process in the respective column. Use nouns and avoid grouping them as good or bad.
- List down the people who will benefit from the process. This could be your customers and if it’s an internal process, it could be your employees.
- What are the inputs necessary to carry out the process you are analyzing? List these down in the inputs column.
- Identify who the suppliers are based on the inputs you listed down before; and mark the suppliers who also have a direct impact on the process outputs.
- Export your diagram in PNG, SVG or PDF image formats to publish, print or share it. You can directly share your SIPOC diagram with the project team or stakeholders through Slack; or install the Creately Confluence plugin to create and add diagrams to your Confluence pages and posts.