Flowcharts are an essential tool for breaking down complex processes into clear, visual steps. Whether you’re mapping out a business workflow, designing a system, or troubleshooting an issue, a well-structured flowchart helps bring clarity and efficiency.
In this flowchart guide, we’ll cover what is a flowchart, and the fundamentals of flowcharts, explore different types and their applications, and walk you through the steps to create one effectively. By the end, you’ll have a solid understanding of how to use flowcharts to streamline processes and improve decision-making.
What Is a Flowchart
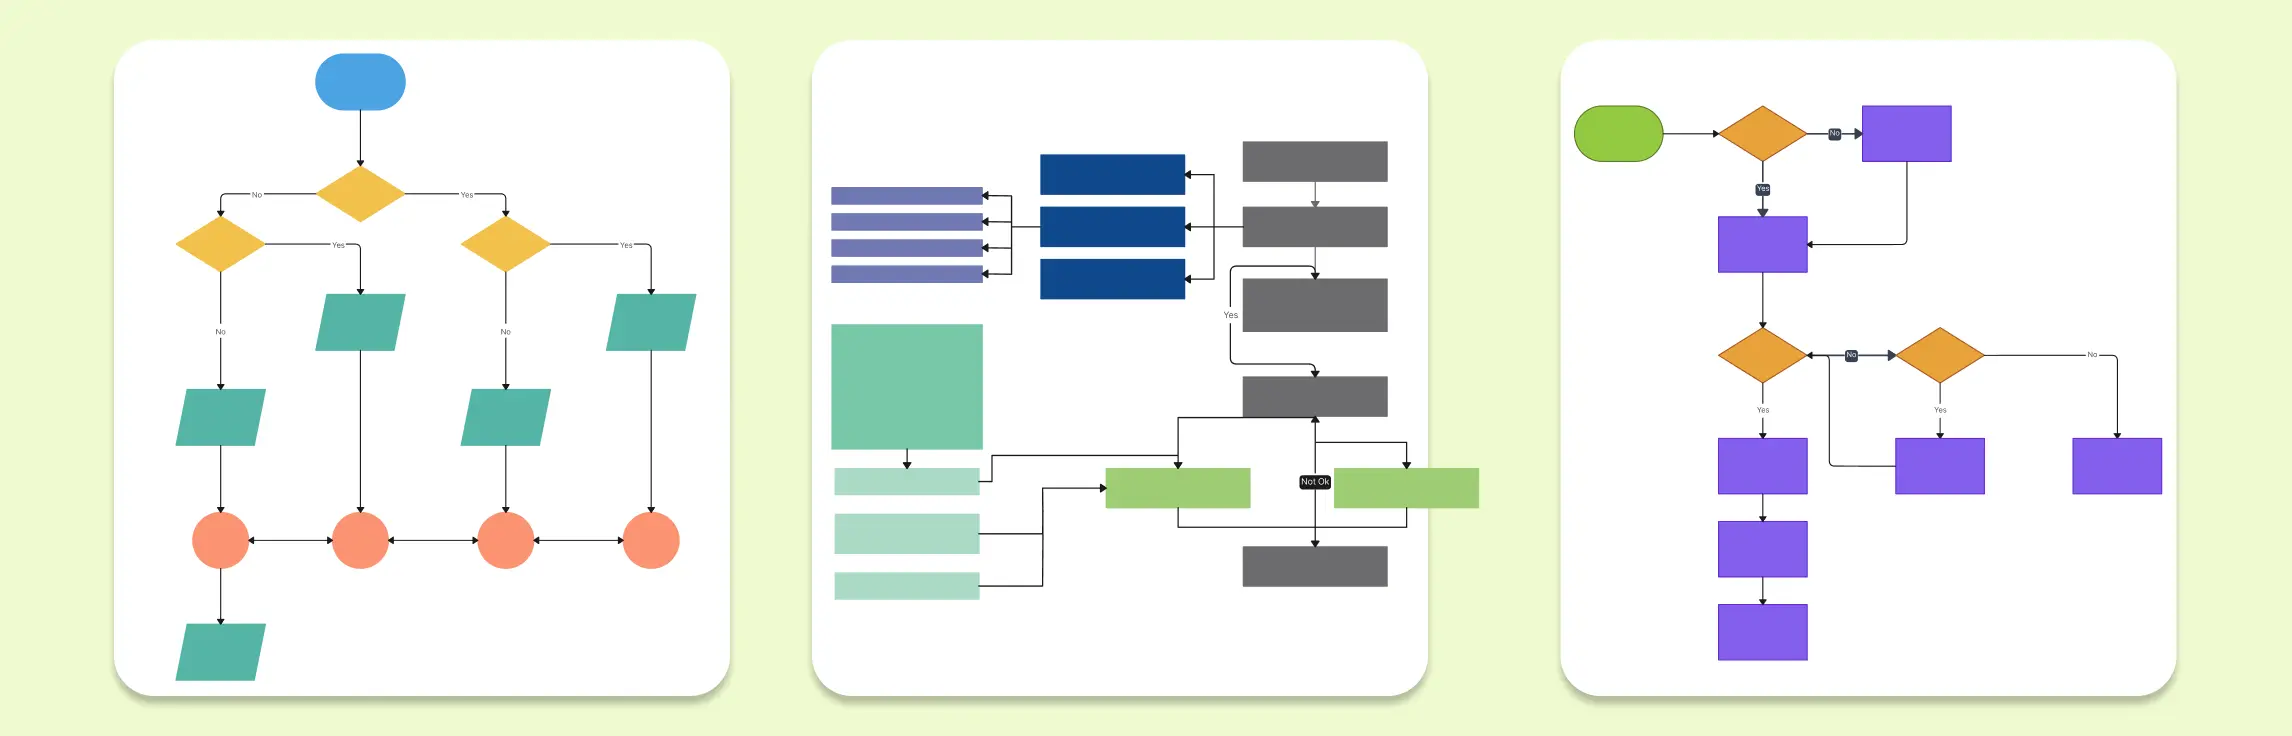
A flowchart is a structured visual representation of a process, system, or algorithm. It illustrates a sequence of steps using standardized flowchart symbols, such as rectangles for actions, diamonds for decision points, and arrows to indicate the process flow. By breaking down complex workflows into clear, logical steps, a flowchart diagram helps users quickly understand and analyze a process.
Flowcharts serve as essential tools for simplifying communication, improving efficiency, and identifying inefficiencies in workflows. Whether used for software development, business processes, engineering systems, or education, a well-structured flowchart design provides clarity and ensures a structured approach to problem-solving.


Common Applications of Flowcharts
Flowcharts are widely used across industries to visualize processes, streamline operations, and enhance decision-making. Here’s how they apply in different fields:
- Software Development: In programming, flowcharts help developers plan, debug, and document algorithms, system logic, and decision-making processes. They provide a clear roadmap for coding and troubleshooting.
- Business & Process Optimization: Businesses use flowchart templates to document standard operating procedures (SOPs), optimize workflows, and improve efficiency in project management and decision-making.
- Engineering & System Design: Engineers rely on flowchart diagrams to design complex systems, map out troubleshooting steps, and ensure seamless integration of various components.
- Education & Learning: In classrooms, flowcharts simplify complex topics, helping students visualize problem-solving approaches in subjects like mathematics, science, and logic-based reasoning.
Key Features of an Effective Flowchart
A well-designed flowchart follows a logical sequence of steps, making it intuitive and easy to follow. Key characteristics include:
- Clear Start and End Points: A flowchart diagram should begin with a defined starting point and lead to a clear outcome.
- Logical Progression: Each step should flow seamlessly into the next, following a structured path without unnecessary complexity.
- Standardized Symbols: Using the correct flowchart symbols ensures consistency and universal understanding.
- Readability and Simplicity: Overly complex flowchart designs can become confusing. Keeping the layout clean and structured improves usability.
By understanding what a flowchart is and how it functions, you can effectively use flowchart templates or create custom flowchart designs to streamline workflows, enhance communication, and optimize processes in various fields.
Types of Flowcharts
Flowcharts come in various types, each serving a specific purpose in visualizing processes. Below are some of the basic types of flowcharts that are commonly used across industries. For a more detailed breakdown, check out our guide on 21 Types of Flowcharts for Visualizing Processes and Systems.
1. Process Flowchart
A process flowchart represents a step-by-step sequence of actions involved in completing a task or workflow. It is widely used in business operations, manufacturing, and quality control to analyze and optimize processes. Process flowcharts help identify inefficiencies, redundancies, and areas for improvement.
2. Workflow Diagram
A workflow diagram illustrates how tasks, information, and documents move through a system or between individuals. It is often used in business process management (BPM) and project management to improve collaboration, streamline tasks, and ensure the smooth execution of processes.
3. Decision Flowchart
A decision flowchart is used to map out decision-making processes. It includes multiple decision points, each leading to different outcomes based on predefined conditions. These flowcharts are helpful in troubleshooting, problem-solving, and designing business rules or policies.
4. Data Flow Diagram (DFD)
A data flow diagram (DFD) focuses on how data moves within a system, showing data inputs, outputs, storage, and processing. It is widely used in software development, system design, and database modeling to visualize the flow of information between different components.
5. Swimlane Flowchart
A swimlane flowchart organizes a process into lanes or sections, each representing a person, team, or department responsible for specific tasks. This type of flowchart is useful in cross-functional workflows, as it helps clarify roles, responsibilities, and dependencies between different stakeholders.
6. Algorithm Flowchart
Algorithm flowcharts are commonly used in computer programming, mathematics, and engineering. They visually represent the logical sequence of steps needed to solve a problem or perform a computation. These flowcharts help in structuring code and debugging errors before implementation.


History of Flowcharts
The history of flowcharts dates back over a century, with their origins deeply rooted in the pursuit of efficiency and process optimization. The concept was first introduced in 1921 by Frank and Lillian Gilbreth, American engineers and early advocates of scientific management techniques. Initially, flowcharts were referred to as “Process Flow Charts”, and they were primarily used to analyze workflows in manufacturing and industrial settings.
Frank Gilbreth’s work focused on motion study and the elimination of unnecessary steps in a process. His introduction of flowcharts provided businesses with a powerful visual tool to document processes, improving productivity and reducing wasted time and effort.
In the 1930s and 1940s, Allan H. Mogensen, a pioneer in industrial engineering and efficiency, began training business professionals on the practical use of flowcharts. He recognized their potential to simplify complex systems, helping managers and workers alike understand and improve their workflows. Mogensen’s teachings played a significant role in popularizing flowcharts within the business world.
As flowcharts gained traction, they became a staple in fields such as engineering, business management, and software development. In the mid-20th century, flowcharts were adopted by computer scientists as a way to represent algorithms and programming logic. With the rapid growth of computer science, flowcharts became an indispensable tool for documenting processes and understanding the flow of data within systems.
Today, flowcharts are widely used across industries to map out everything from business processes and engineering designs to software architecture and educational content. The evolution of flowcharts has been significant, transitioning from hand-drawn diagrams to sophisticated digital tools that allow for dynamic, collaborative flowchart creation.
For a more detailed look at the historical development of flowcharts, you can explore the comprehensive entry on Wikipedia, which provides an in-depth summary of how flowcharts have evolved over the years.
Flowchart Symbols
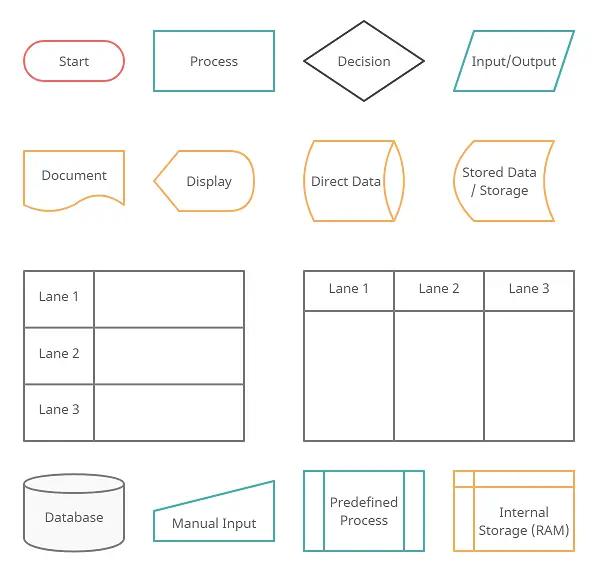
Flowcharts use a variety of symbols to represent different elements of a process. Each symbol has a specific meaning, helping to clearly communicate actions, decisions, or data flows within the chart. Here’s a quick overview of the most commonly used symbols:
| Symbol | Description |
|---|---|
| Terminal/Terminator | Marks the start or end of a process. |
| Process (Rectangle) | Represents a task, action, or operation in the flow. |
| Data (I/O) | Indicates inputs to and outputs from a process, shaped like a parallelogram. |
| Decision (Diamond) | Represents a decision point, with arrows branching based on the answer (e.g., yes/no). |
| Document | Symbolizes a report or document, shown as a rectangle with a wavy bottom. |
| Stored Data | Represents general data storage. |
| Direct Data | Symbolizes data stored on devices like a hard drive. |
| Internal Storage | Common in programming, represents data stored in memory (RAM). |
These common symbols are used to building an accurate and understandable flowchart. There are more key flowchart symbols used for more complex processes and industries. Read the flowchart symbol guide to learn about comprehensive list flowchart symbols.
Although these are the standard symbols available in most flowchart software, some people do use different shapes for different meanings.
How to Draw a Flowchart with Creately
Creating a flowchart is a straightforward process when you have the right tools. Whether you’re starting from scratch or using a ready-made flowchart template, following a structured approach ensures clarity and accuracy. Here’s a step-by-step guide to drawing a flowchart diagram efficiently:
Step 1: Define the Purpose of Your Flowchart
Before you begin, determine the goal of your flowchart design. Are you mapping out a business workflow, a software process, or a troubleshooting flowchart guide? Understanding the objective will help you choose the right flowchart type and symbols.
Step 2: Identify the Key Steps
List the main steps involved in the process. Break down complex workflows into smaller, manageable tasks. Ensure each step logically connects to the next to maintain clarity in your flowchart diagram.
Step 3: Choose a Flowcharting Tool
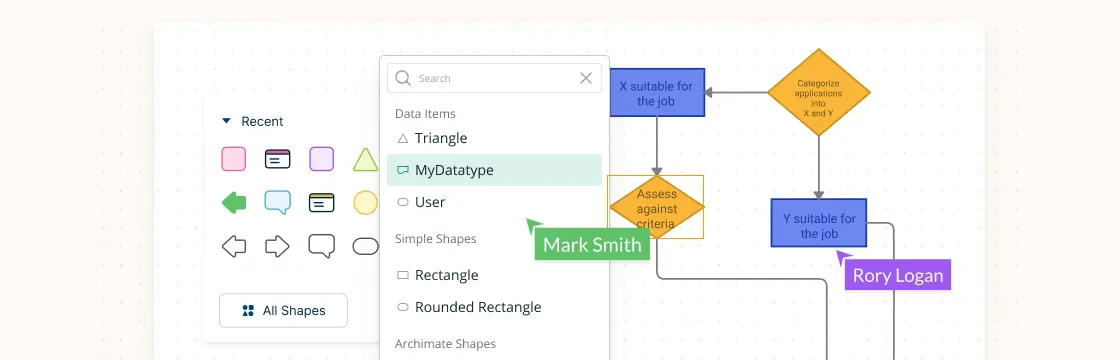
To create a professional flowchart, use an intuitive diagramming tool like Creately. You can:
- Start from scratch: Sign in to Creately and open a blank canvas to manually design your flowchart using drag-and-drop elements.
- Use templates: Select from a range of flowchart templates to save time and maintain consistency in your design.
Step 4: Add Flowchart Symbols
Use standard flowchart symbols to represent different steps in your process. Arrange the symbols logically and ensure the sequence accurately represents the workflow.
Step 5: Connect the Elements
Use arrows to establish the flow between steps. Ensure connections are clear and do not overlap excessively to maintain readability. If there are multiple pathways, label them appropriately for easy understanding.
Step 6: Review and Refine
Before finalizing your flowchart, check for errors or missing steps. Ask a colleague to review it to ensure it accurately represents the process. Adjust the layout for better readability if needed.
Step 7: Save, Share, and Export
Once complete, save your flowchart on Creately for future editing. You can also export it in various formats (PDF, PNG, or SVG) or share it with your team for collaboration.
By following these steps, you can create a clear and functional flowchart that enhances process understanding and efficiency. Whether you start from scratch or use flowchart templates, Creately makes the process quick and seamless.
Flowchart Templates and Examples
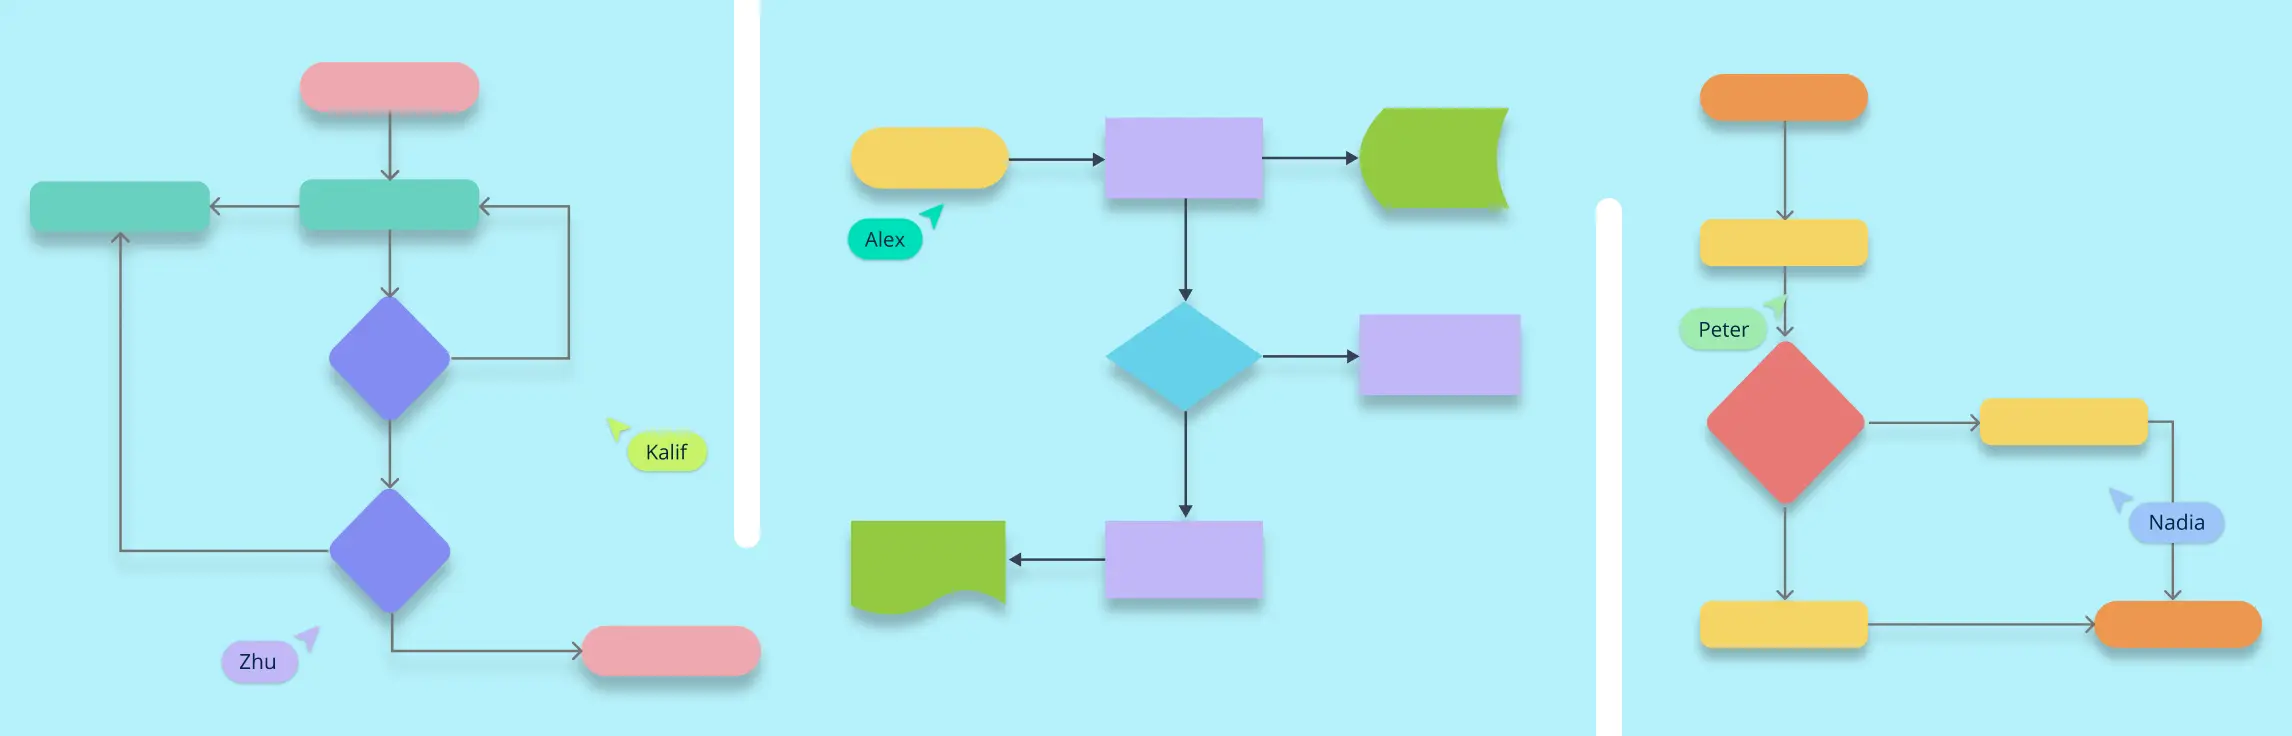
Creating a flowchart from scratch can be time-consuming, but using flowchart templates streamlines the process. Below, you’ll find a collection of ready-to-use flowchart examples designed for various use cases, including business workflows, software development, decision-making, and process optimization. These flowchart templates provide a structured framework, allowing you to customize and adapt them to fit your specific needs. Whether you’re mapping a simple process or a complex system, these templates will help you get started quickly and efficiently.


Advantages of Flowcharts
Understanding what a flowchart is goes beyond recognizing its symbols and structure—it’s about leveraging it as a powerful tool to improve workflows, enhance collaboration, and drive efficiency. Flowcharts are widely used across industries, from business and engineering to education and software development. Here’s how they add value:
1. Simplifies Complex Processes
Complex workflows can be overwhelming, but a well-structured flowchart diagram transforms them into clear, step-by-step visuals. By mapping out each stage, flowcharts make intricate processes easier to understand and execute, reducing confusion and errors.
2. Enhances Communication and Collaboration
A flowchart acts as a universal language that bridges communication gaps between teams. Whether explaining technical workflows to non-experts or aligning departments on a shared process, flowchart examples ensure clarity and consistency in understanding.
3. Improves Decision-Making
Making informed decisions requires visibility into each step of a process. A flowchart design helps identify redundancies, bottlenecks, and inefficiencies, enabling teams to streamline workflows. Businesses use flowchart templates to map out various scenarios and develop strategic solutions.
4. Encourages Process Optimization
By visually outlining workflows, flowchart diagrams help teams pinpoint inefficiencies and areas for improvement. Whether refining a business process or troubleshooting an issue, a flowchart makes it easier to implement data-driven optimizations and maintain operational efficiency.
Flowcharts aren’t just about illustrating processes—they are essential tools for simplifying complexity, improving communication, and driving better decisions across industries.
Flowchart Best Practices
There are a few things you can do to make your flowchart universally accepted. And there are some things that you can do to make it visually pleasing to others as well.
If you’re planning to share your flowchart or hoping to use it on a presentation etc. then it’s wise to use standard symbols. However, it is important to remember that the idea is to give out information in an easy-to-understand manner. It is perfectly acceptable to use an alternative image instead of the document symbol as long as the audience understands it.
Keeping the arrow flow to one side, using the same size symbols, naming the decision blocks, processes, arrows, etc. are a few things you can do to make it better. The common mistakes section covers most of these practices in detail.
AI Flowcharts: Smarter Way to Visualize Processes
AI-powered flowcharts are transforming the way businesses and professionals create, analyze, and optimize workflows. With intelligent automation, AI flowchart tools can generate flowcharts instantly, suggest improvements, and even detect inefficiencies in processes.
Benefits of AI Flowcharts
- Automated Generation – AI can quickly convert text-based inputs, data, or prompts into structured flowcharts, saving time and effort.
- Smart Recommendations – AI-powered tools analyze processes and suggest optimizations to improve efficiency.
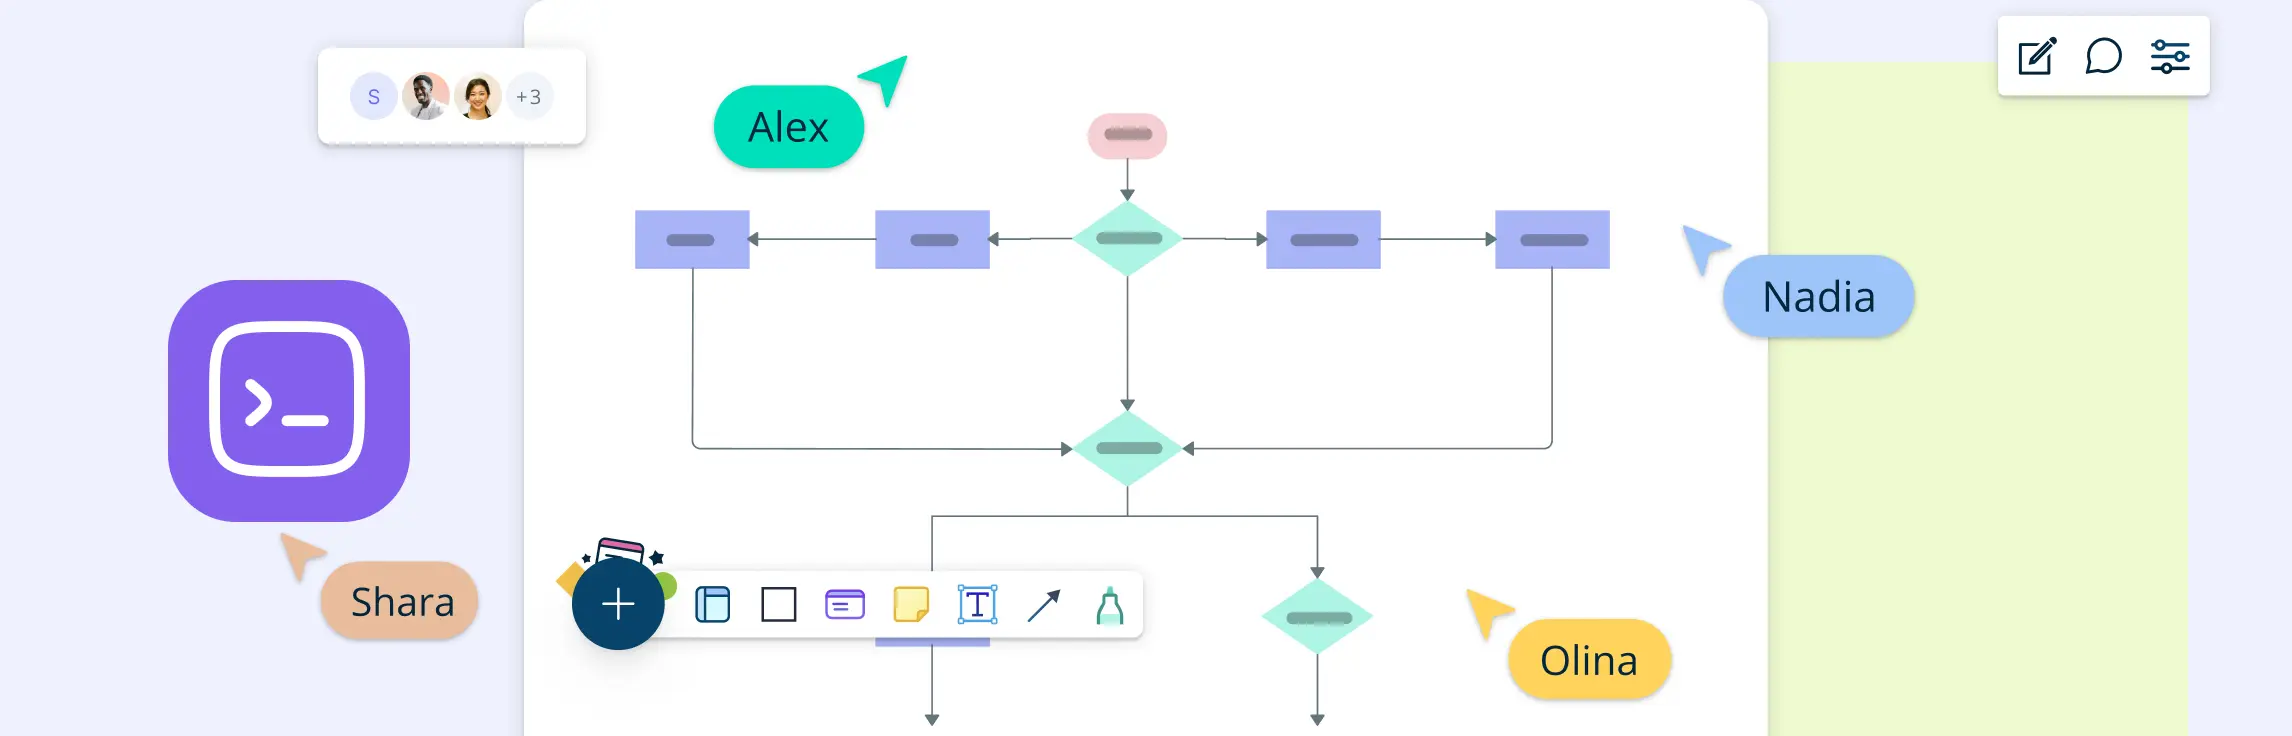
- Real-Time Collaboration – AI-enhanced flowcharting platforms allow teams to work together seamlessly, ensuring up-to-date and synchronized process maps.
- Error Detection & Optimization – AI helps identify process bottlenecks and recommends improvements, ensuring streamlined workflows.
Creating AI-Powered Flowcharts with Creately
With Creately’s AI-powered flowchart maker, you can generate dynamic flowcharts effortlessly. Its AI-powered flowchart tool enables teams to visualize workflows faster and make data-driven decisions.
For even more advanced capabilities, Creately VIZ leverages AI to provide real-time process mapping, smart automation, and deep integrations with various business tools, making it an all-in-one solution for visualizing and optimizing workflows.
Helpful Resources
Effortlessly create and share flowcharts, enhancing team communication and streamlining workflows with free flowchart software.
Learn the basics of how to create a simple flowchart and continue to expand your skills.
Learn the various symbols used in flowcharting, their meanings, and how to use them effectively.
Discover 10 practical flowchart ideas and try out the editable templates.
Effective Use of Flowcharts – Case Studies
A flowchart tutorial isn’t complete without some case studies. Below are three case studies and real-life examples of how flowcharts can help you make decisions.
- 10+ Flowchart Ideas for Your Business – How flowcharts can be used in making business decisions and optimizing the current business processes
- Analyzing Sales Funnel with Flowcharts – How to analyze the Google analytic sales funnel using a flowchart.
- Flutterscape Case Study – How one of our customers used flowcharts to enhance their processes.
Conclusion
Flowcharts are powerful tools for visually representing processes, making complex workflows easier to understand, analyze, and improve. Whether you’re mapping out a business process, designing a system, or solving problems, the right type of flowchart can help you organize information effectively.
With advancements in AI-powered flowcharting, tools like Creately’s AI Flowchart Maker and Creately VIZ make it even easier to create, optimize, and collaborate on flowcharts in real time. By leveraging automation and smart recommendations, you can streamline workflows and enhance decision-making.
Start using flowcharts to simplify your processes today and experience the benefits of clear, structured visual communication!
FAQs on What Is a Flowchart
What is a flowchart?
Why are flowcharts important?
How do you create a flowchart?
What is a subprocess in a flowchart?
How are flowcharts used in computer programming?
Resources:
Ensmenger, N. (2016). The Multiple Meanings of a Flowchart. Information & Culture, [online] 51(3), pp.321–351. doi:https://doi.org/10.2307/44667617.
Weng, W. (2024). Flowchart. A Beginner’s Guide to Informatics and Artificial Intelligence, pp.13–20. doi:https://doi.org/10.1007/978-981-97-1477-3_2.