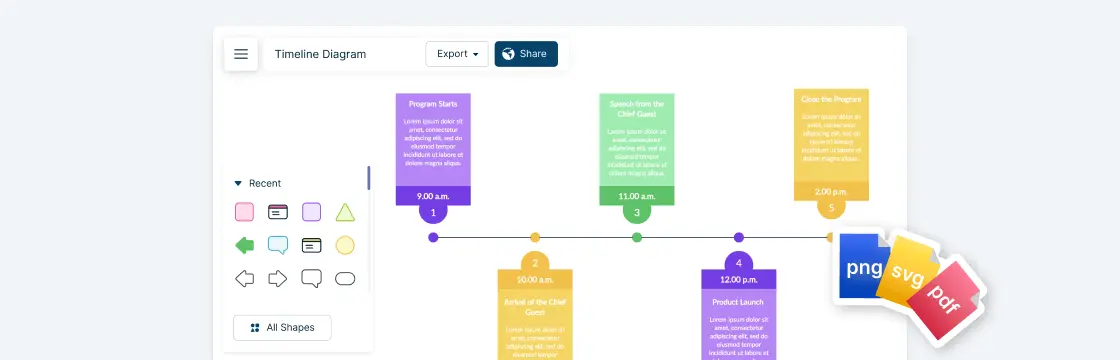
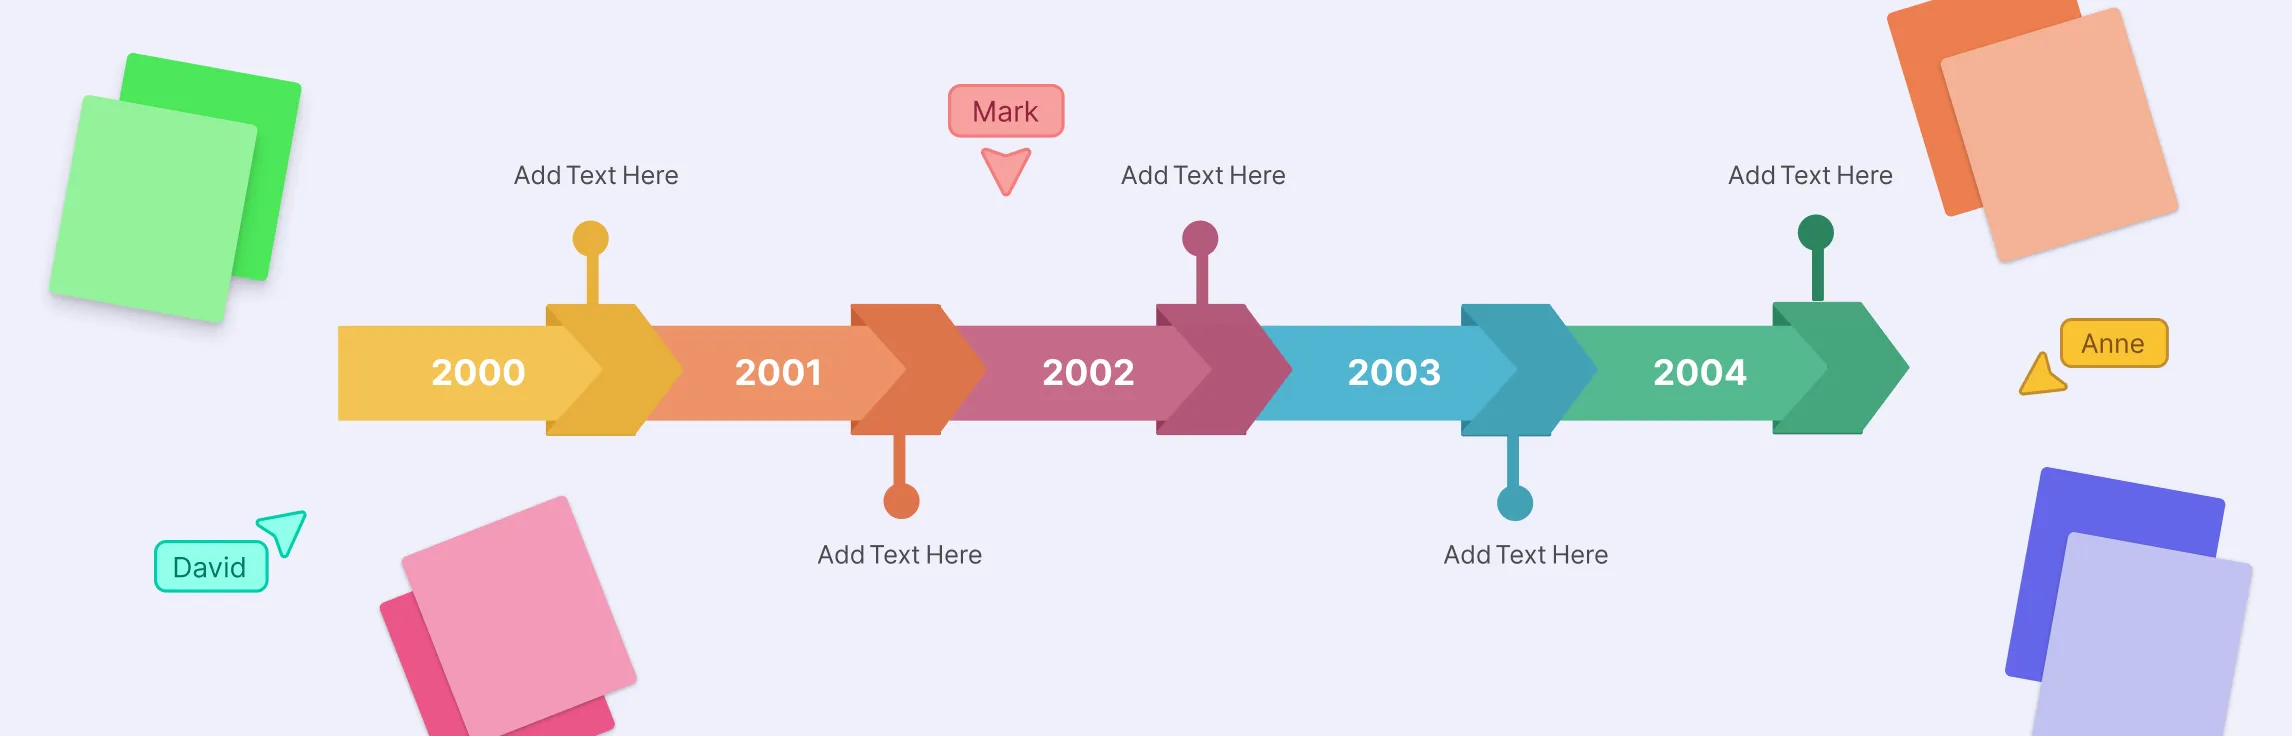
A timeline is a simple but powerful way to show how events unfold over time, whether you’re mapping a project plan, telling a historical story, or tracking milestones for a presentation. By laying information out in chronological order, timelines make complex sequences easier to follow at a glance. In this guide, we’ll walk you through everything you need to know on how to make a timeline. From gathering your information to choosing the right layout and styling your timeline for impact, you’ll learn step by step how to make your timelines both informative and easy to understand.
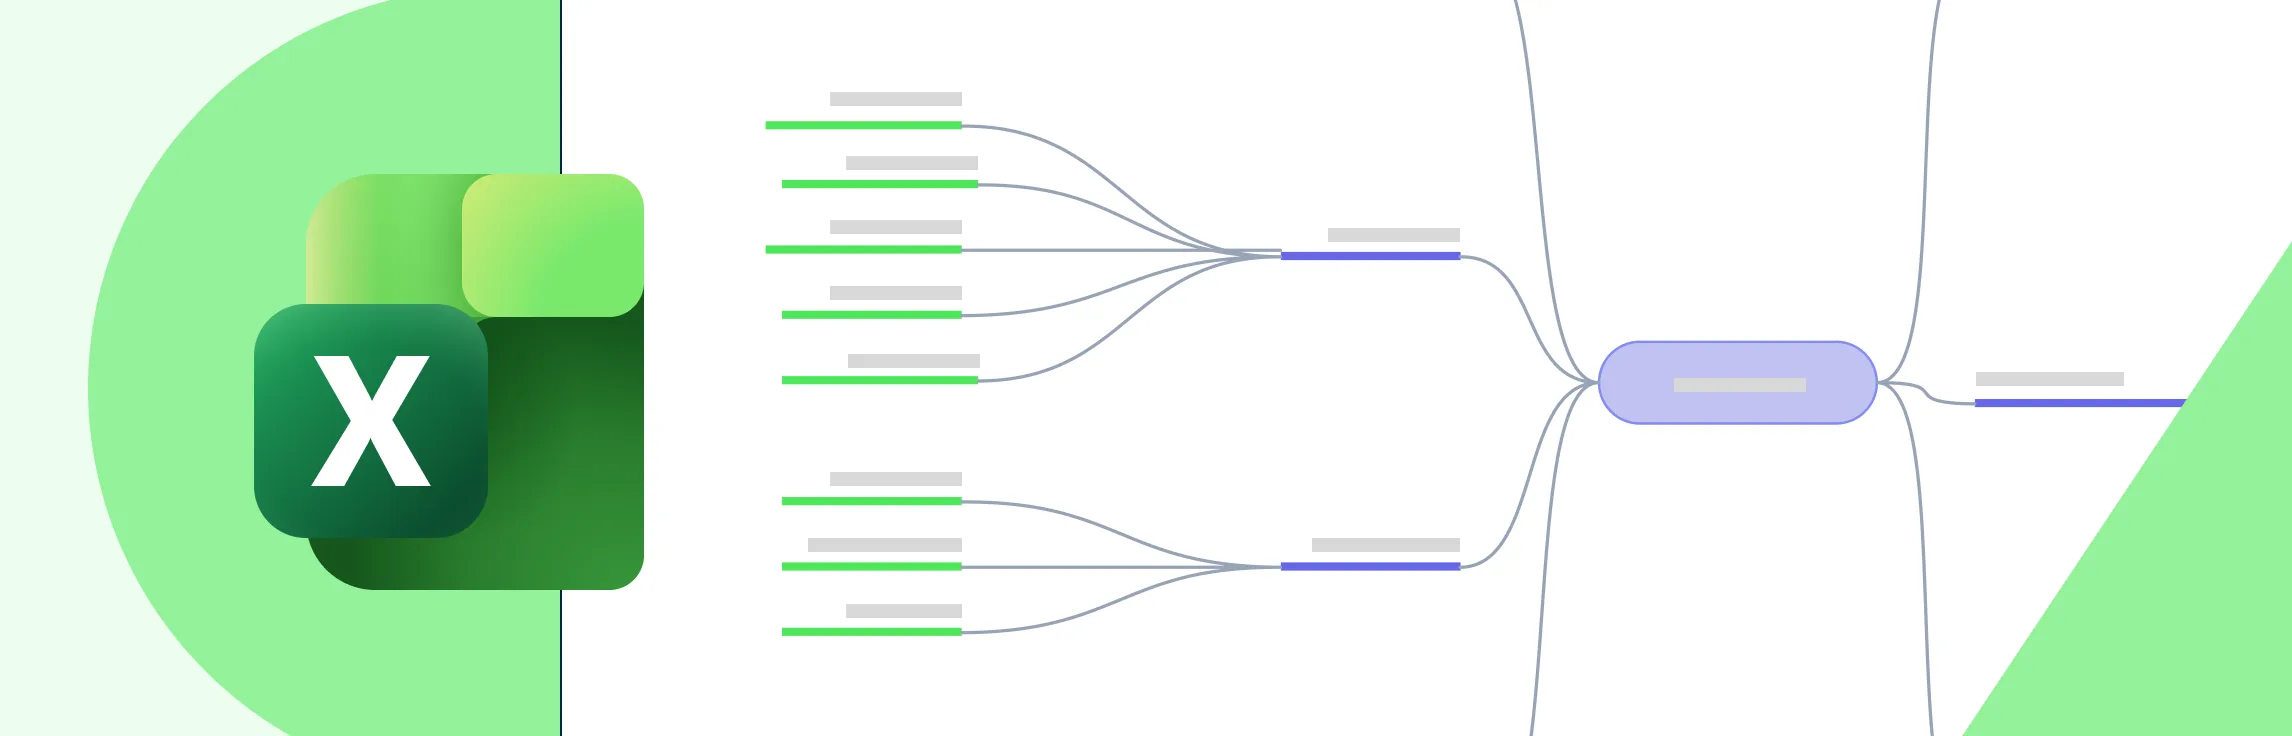
This guide walks you through how to create a mind map in Excel in a simple, friendly way so you can turn scattered thoughts into a clear visual plan. You’ll learn what a mind map is, the exact steps to build one using Excel’s tools, where the method starts to feel limiting, and the smarter alternatives available. By the end, you’ll know exactly how to structure your ideas quickly and confidently.
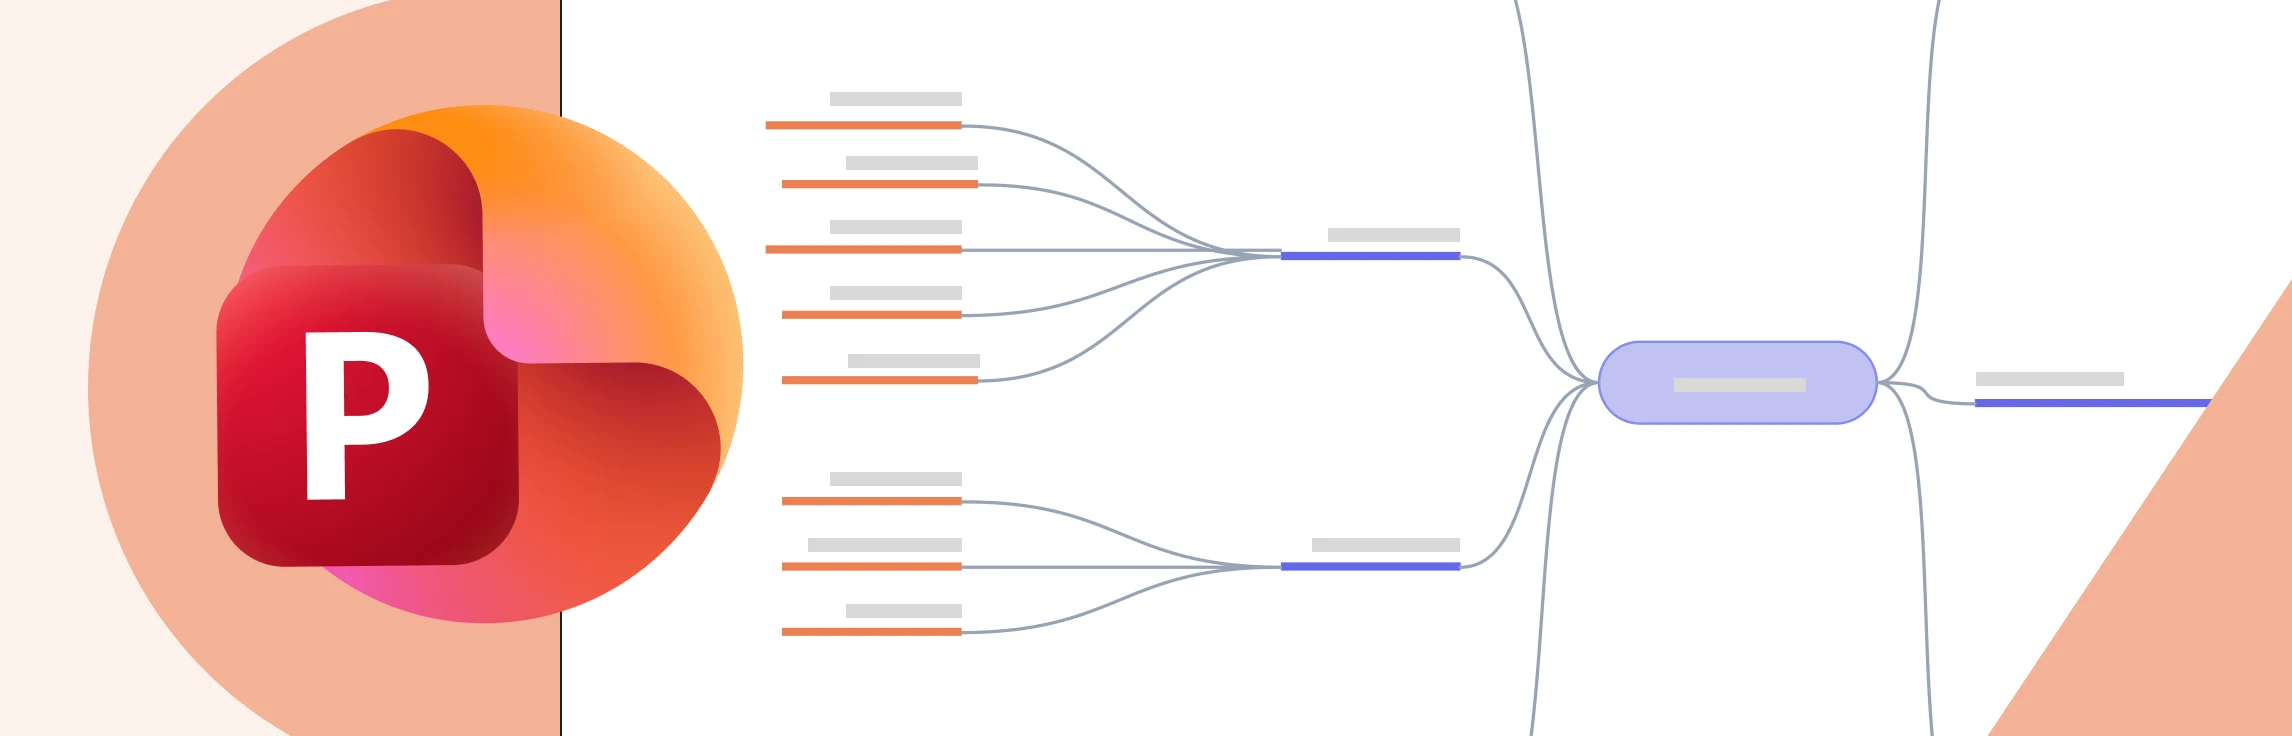
This guide shows you how to draw a mind map in PowerPoint in a clear, approachable way, helping you turn scattered ideas into a structured visual. You’ll get a quick overview of what a mind map is, learn the step-by-step process to build one using PowerPoint, understand where the tool starts to feel challenging, and explore an easier alternative. By the end, you’ll feel confident organizing your ideas into a mind map that’s clean, clear, and presentation-ready.
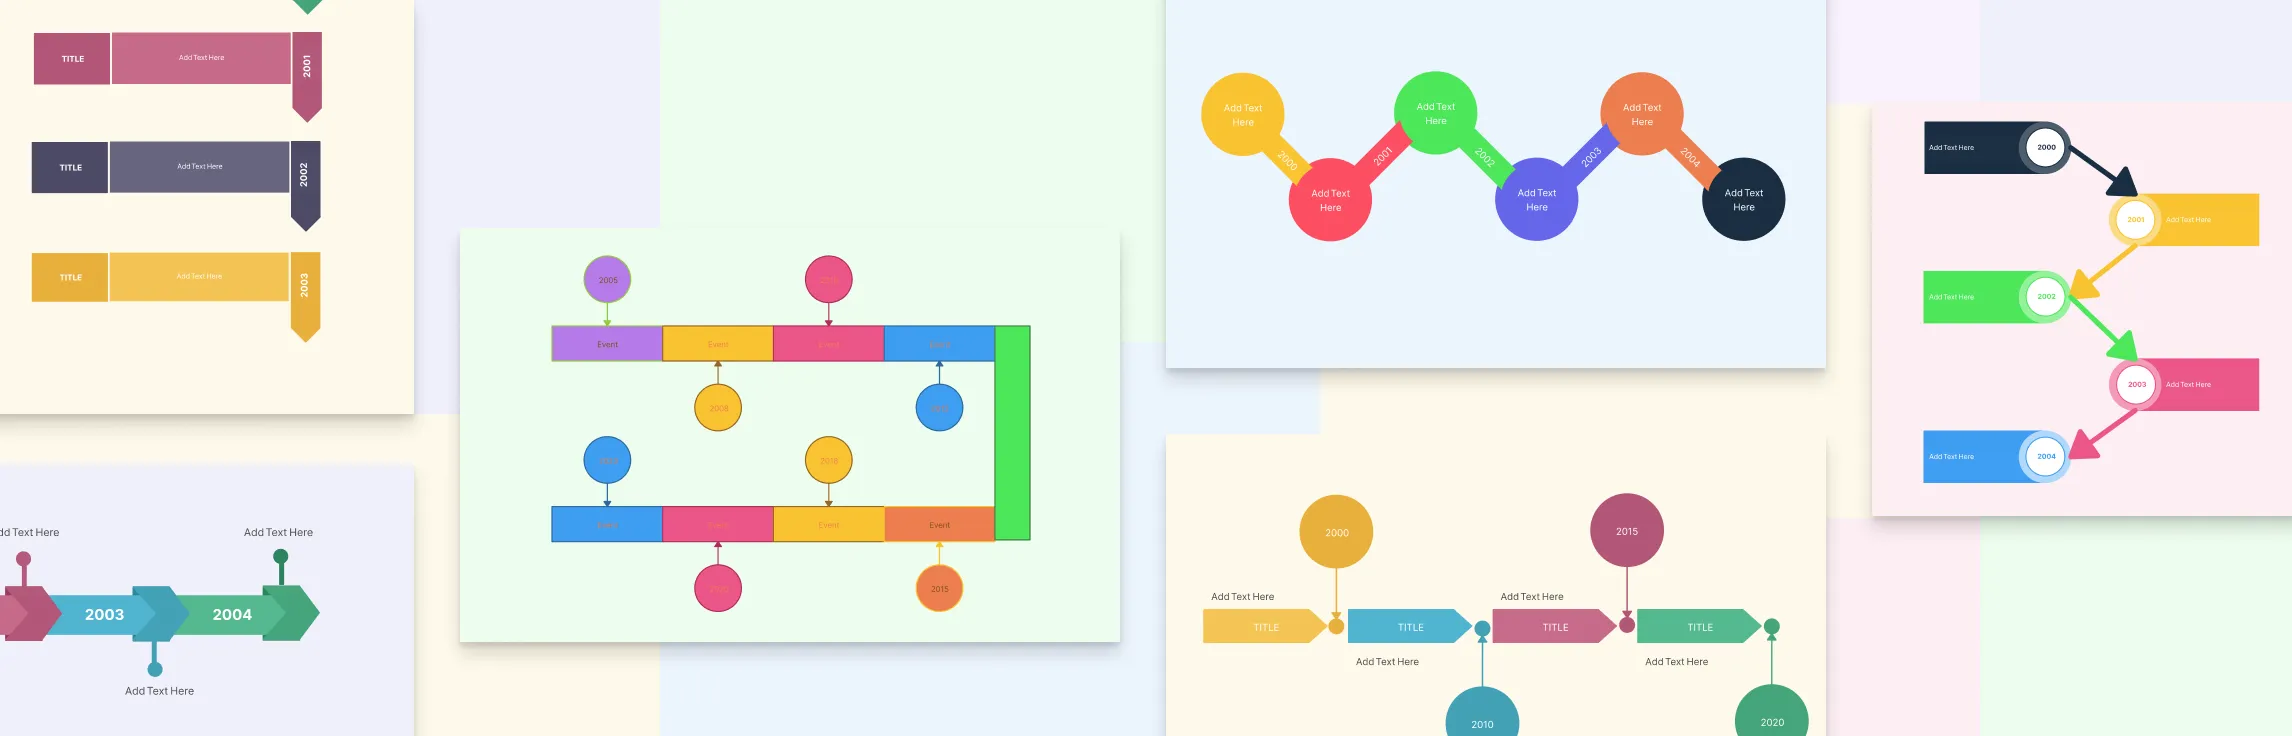
A timeline is a visual way to display events or tasks in the order they occur, helping you quickly understand how things progress over time. Whether you’re mapping historical events, planning a project, or organizing ideas, knowing the different types of timelines can make your work clearer and more effective. In this guide, we’ll explore the main types of timelines, their uses, and how you can easily create them using a visual tool like Creately.
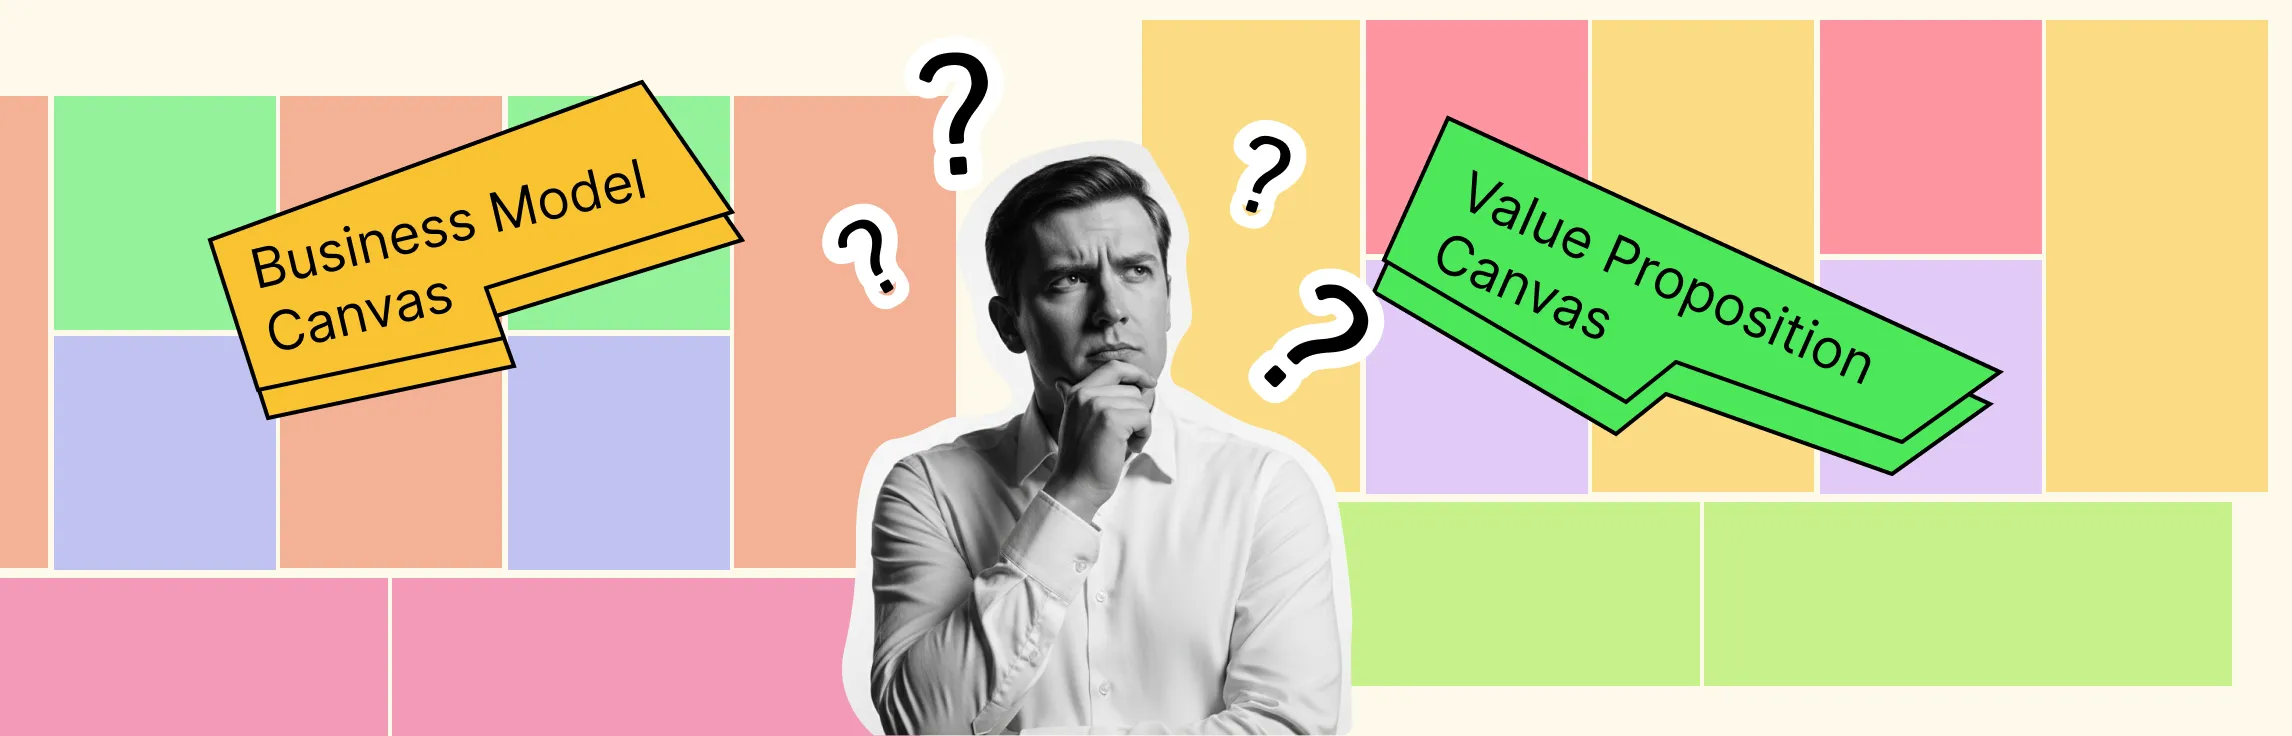
Every great business starts with a clear plan—and a clear plan starts with the right tools. The business model canvas and value proposition canvas are two of the most powerful frameworks to help you map your business, uncover opportunities, and understand what truly matters to your customers. In this guide, we’ll show you how to use both canvases to align your team, test ideas, and turn your vision into a practical plan—all in a simple, visual way.
A timeline diagram is a simple but powerful way to show how events unfold over time. Whether it’s used to track project milestones, visualize historical events, or map a product’s journey, timelines make it easy to see progress and relationships at a glance. In this guide, we’ll explain the timeline meaning, its key elements, and why it’s such a useful tool for organizing information clearly.
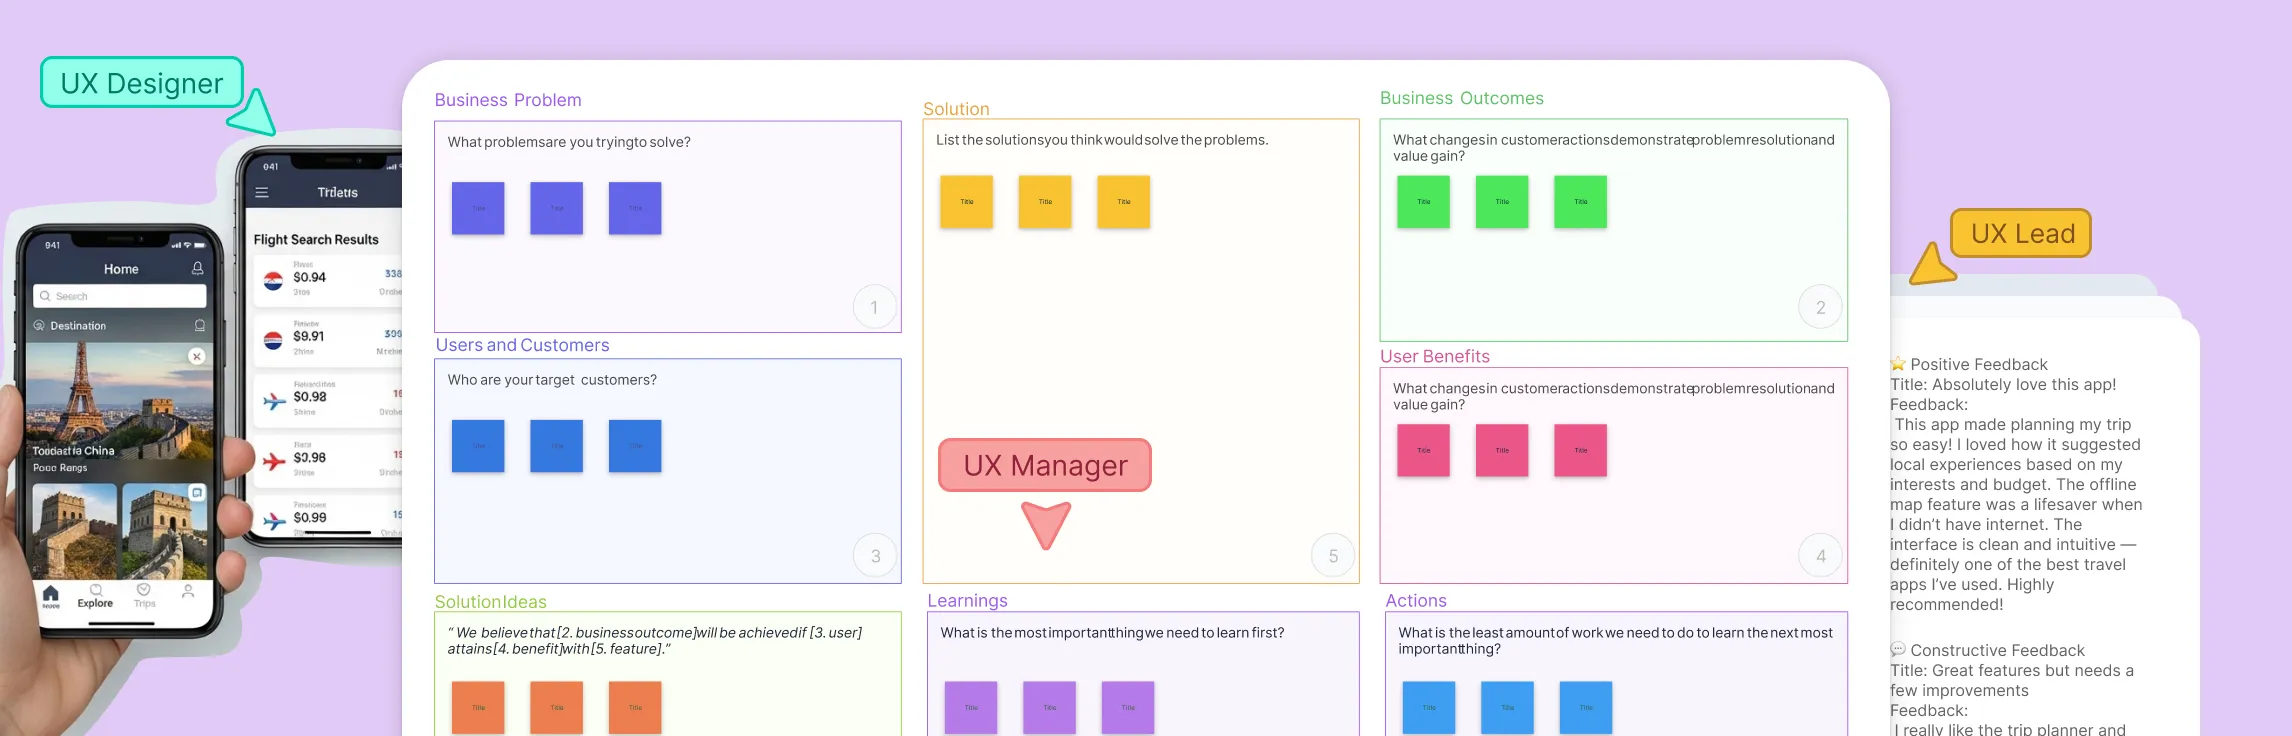
The Lean UX Canvas is a practical tool that guides teams through the Lean UX process — from framing problems and identifying assumptions to designing experiments that lead to real insights. It helps teams stay focused on outcomes, align around user needs, and make evidence-based decisions. In this guide, you’ll learn how to use the Lean UX Canvas step by step to validate ideas faster and build products that truly solve user problems.
Lean UX is a practical way to design and improve products faster. Instead of spending weeks creating detailed designs or long reports, it focuses on learning quickly through collaboration and small experiments. This guide will help you understand what Lean UX is, how it works, and how you can use it to build better experiences with your team. Whether you’re new to UX or just looking for a faster, more flexible approach, this is the perfect place to start.
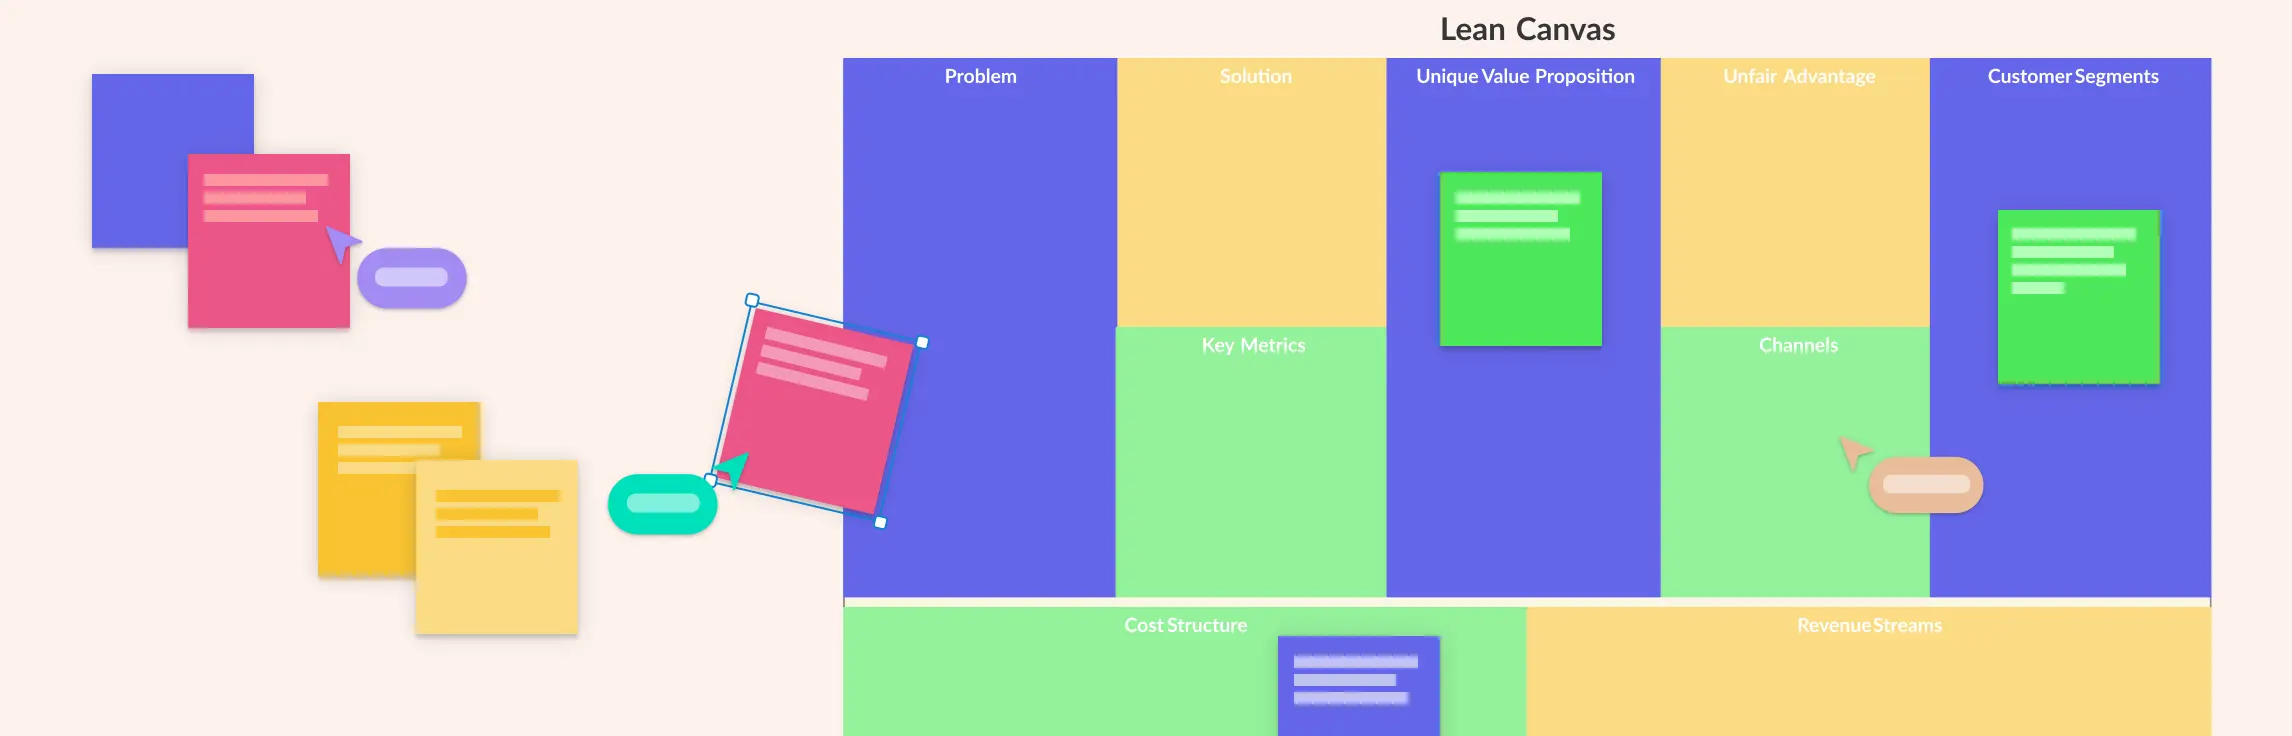
Starting a business is exciting, but turning an idea into a working business model can feel overwhelming. That’s where the Lean Canvas comes in—a simple, one-page tool that helps you map out your idea, identify key problems, and plan how to deliver value to your customers. In this guide, we’ll walk you through real-world Lean Canvas examples from successful startups, showing you exactly how to structure your own canvas.
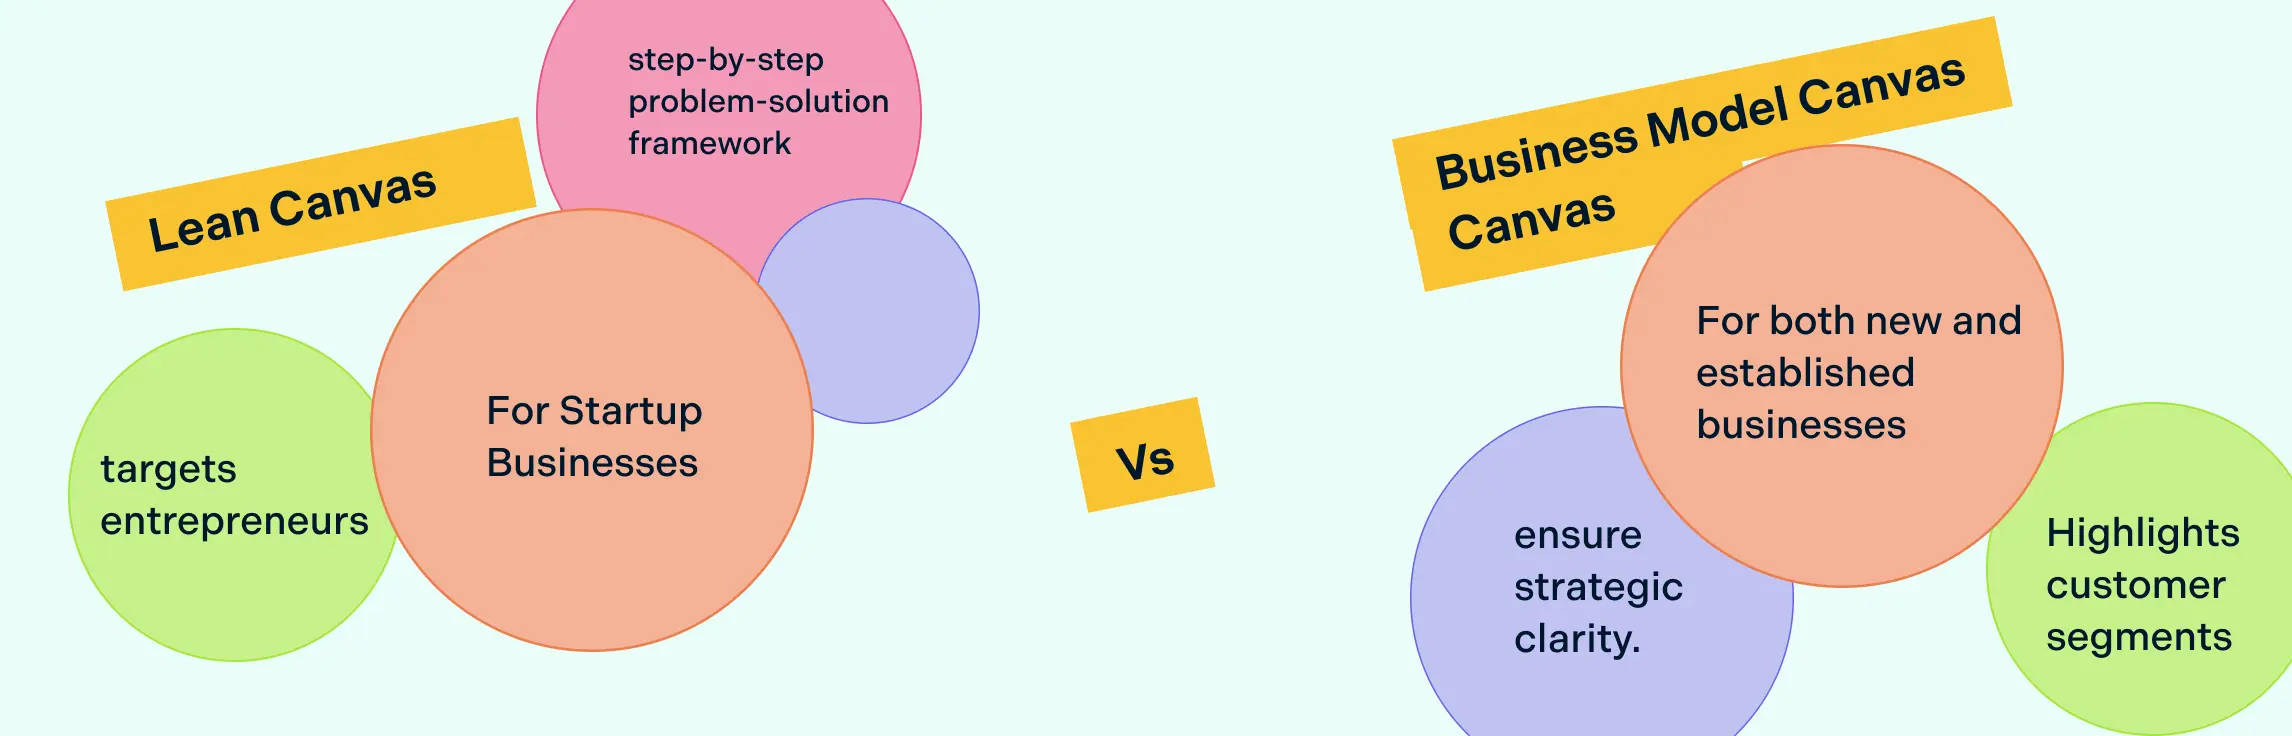
Building a business idea doesn’t have to start with a long, complicated plan. Single-page canvases like the Lean Canvas and the Business Model Canvas help you quickly map out how your idea creates value and works as a business. In this guide, you’ll learn what makes each canvas unique, when to use them, and how to choose the right one for your stage. We’ll also look at lean canvas vs. business model canvas examples and ready-to-use templates to help you put your ideas into action fast.
Starting a business can feel overwhelming, with countless decisions to make and uncertainties to navigate. The Lean Business Model Canvas helps entrepreneurs focus on what truly matters—understanding customers, testing ideas quickly, and iterating on solutions without wasting time or resources. In this guide, we’ll walk you through a practical approach to using the canvas effectively, offering tips, examples, and strategies to turn your ideas into actionable plans.
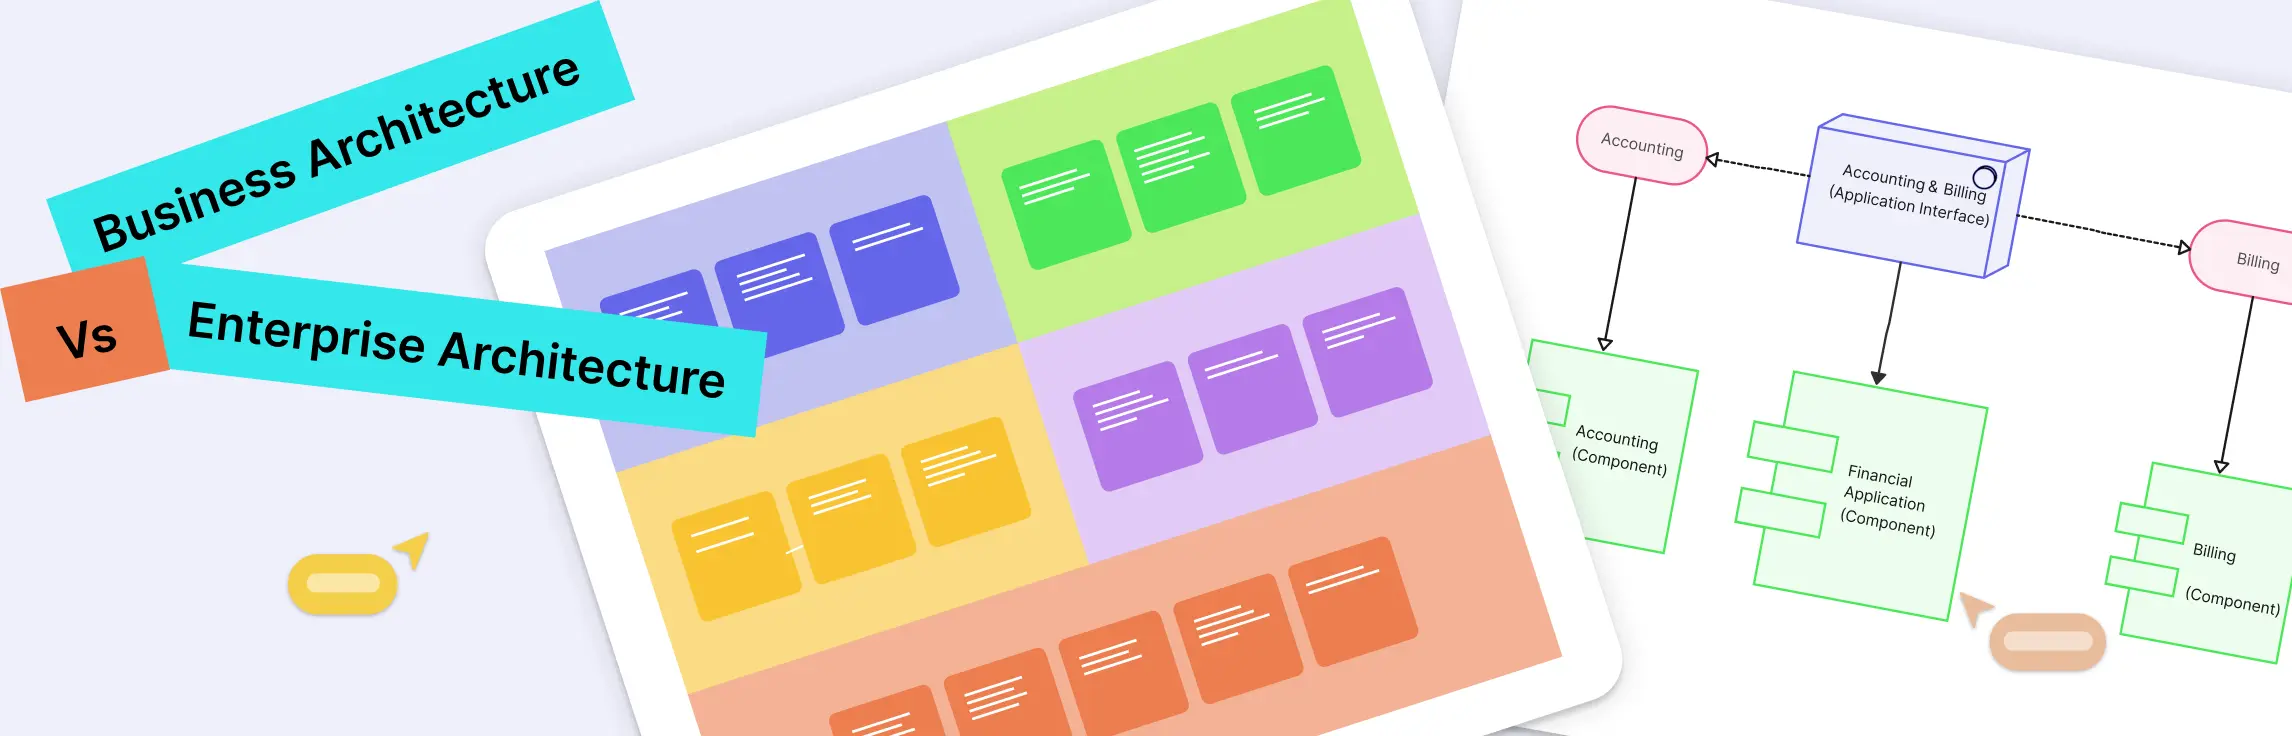
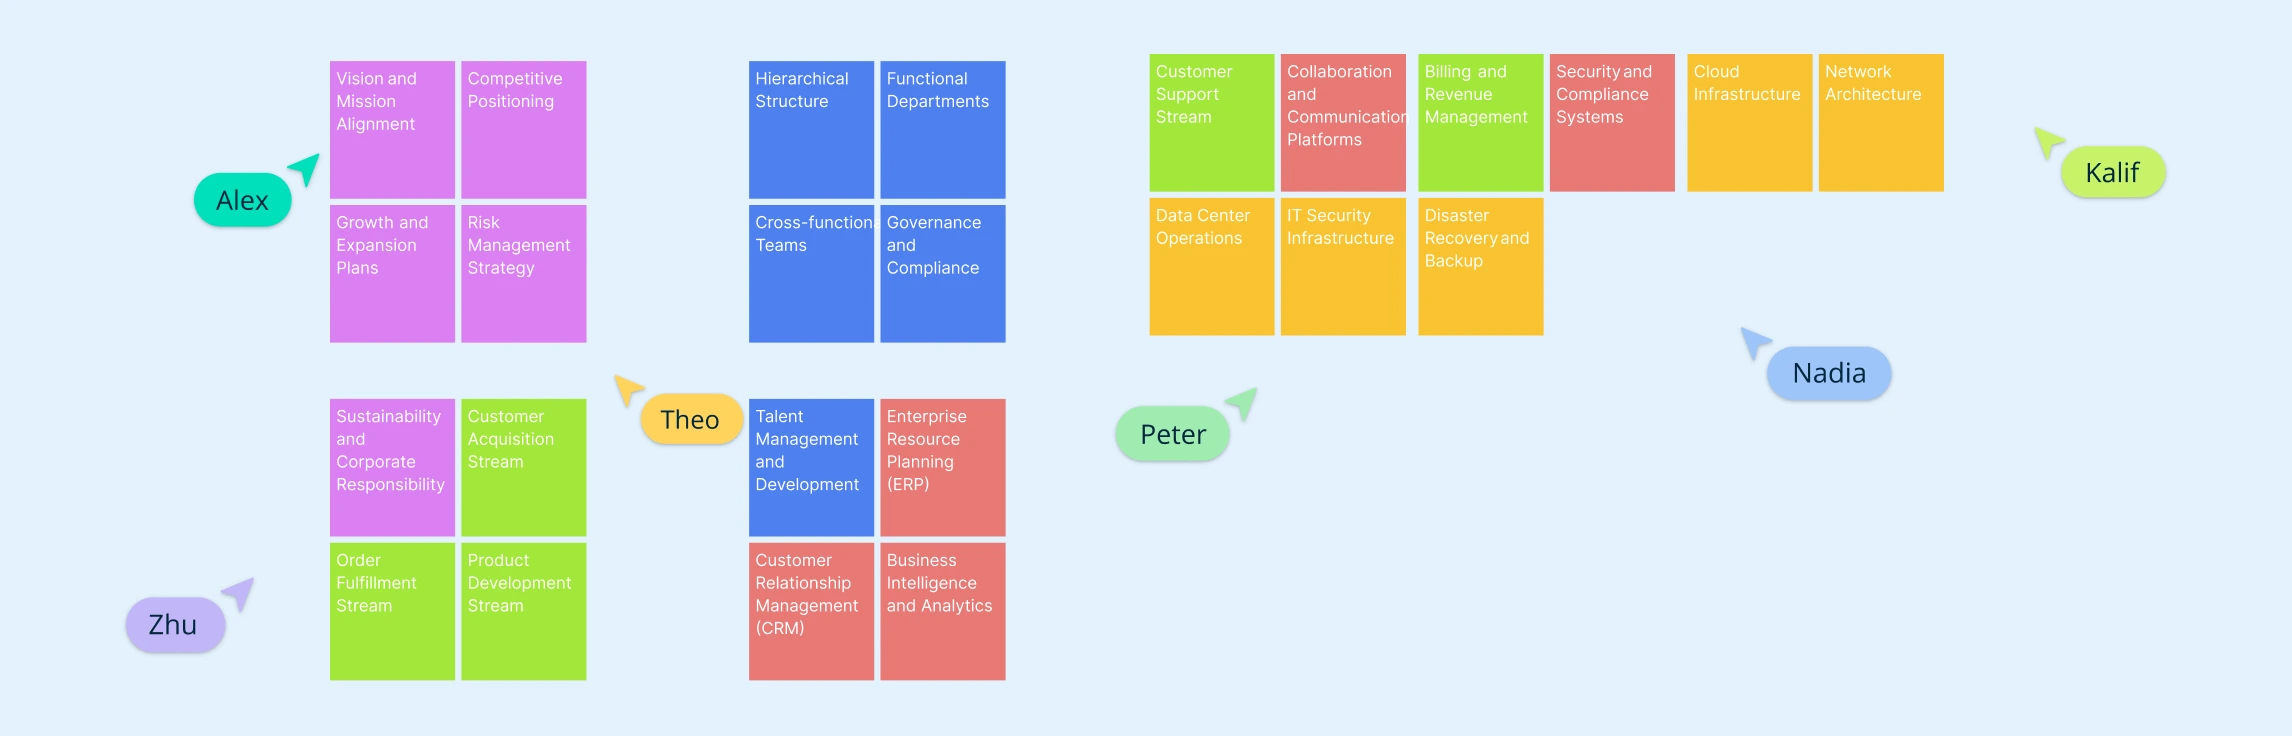
In today’s fast-paced business environment, aligning strategy with execution is more critical than ever. Business architecture modelling provides a clear, structured view of an organization’s capabilities, processes, information flows, and stakeholders, helping leaders make informed decisions and drive operational excellence. Whether you’re a startup, an enterprise, or a growing e-commerce business, understanding and visualizing your business architecture can unlock clarity, efficiency, and strategic alignment, turning complex operations into actionable insights.
In today’s fast-changing business landscape, success depends on how well strategy aligns with technology. Yet many organizations struggle to connect big-picture goals with the systems that power them. This is where understanding business vs enterprise architecture becomes critical. By distinguishing how business architecture defines organizational capabilities and how enterprise architecture enables them through technology, teams can bridge the gap between vision and execution. In this guide, we’ll break down the differences, explore examples, and share practical templates to help you build a strong business enterprise architecture foundation for long-term success.
Ever feel like your organization’s strategy lives in one place, but execution happens somewhere completely different? Misaligned goals, unclear responsibilities, and disconnected processes can turn even the best strategies into missed opportunities.
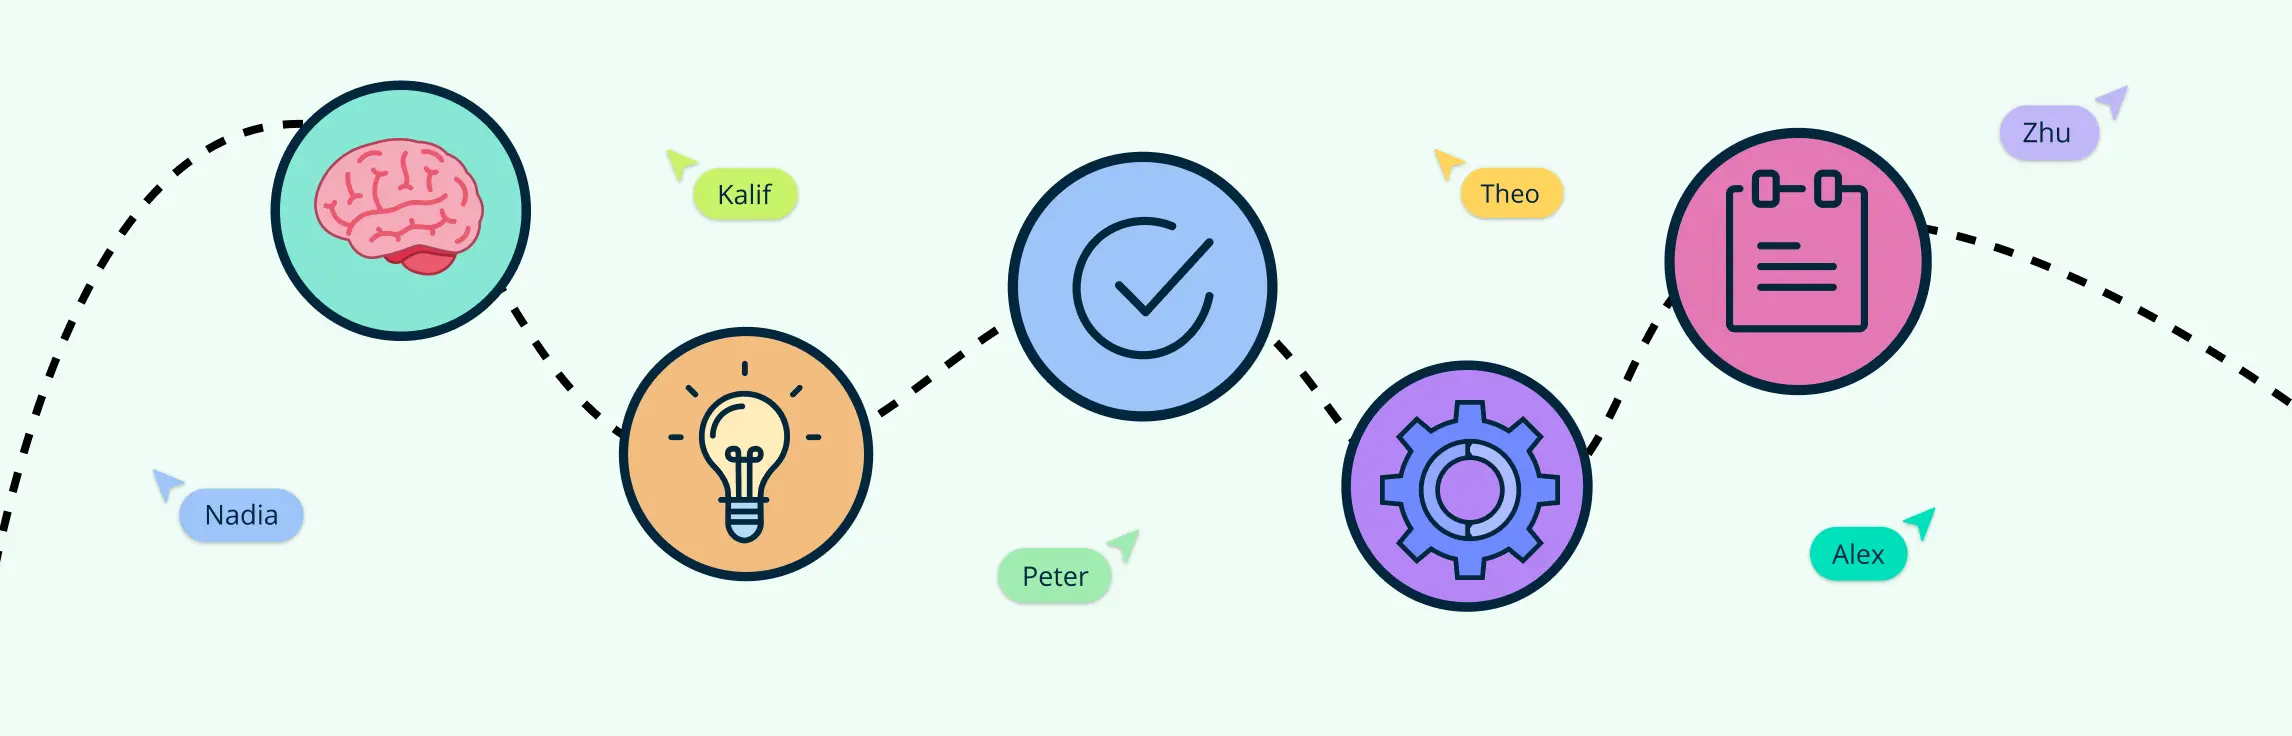
A design sprint is a fast, structured way to solve problems and test ideas in just a few days. Instead of spending months on guesswork, the design sprint process helps teams quickly prototype and learn from real users. It matters because it speeds up decisions, reduces risk, and aligns everyone around clear next steps.
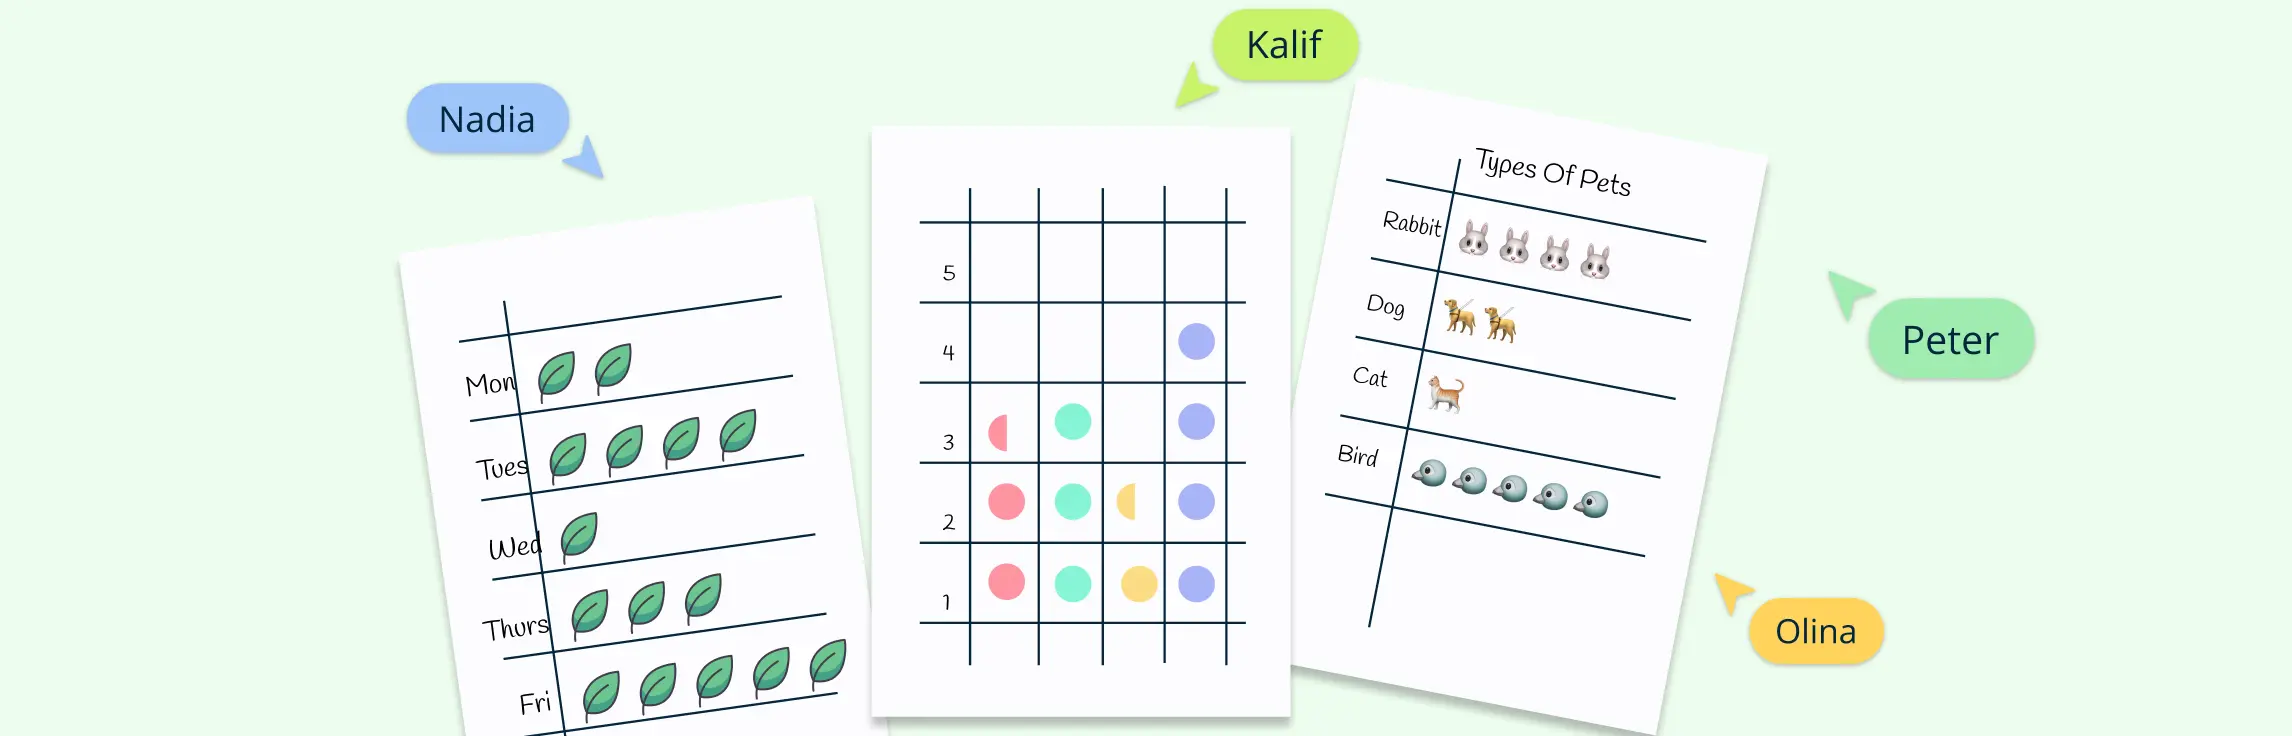
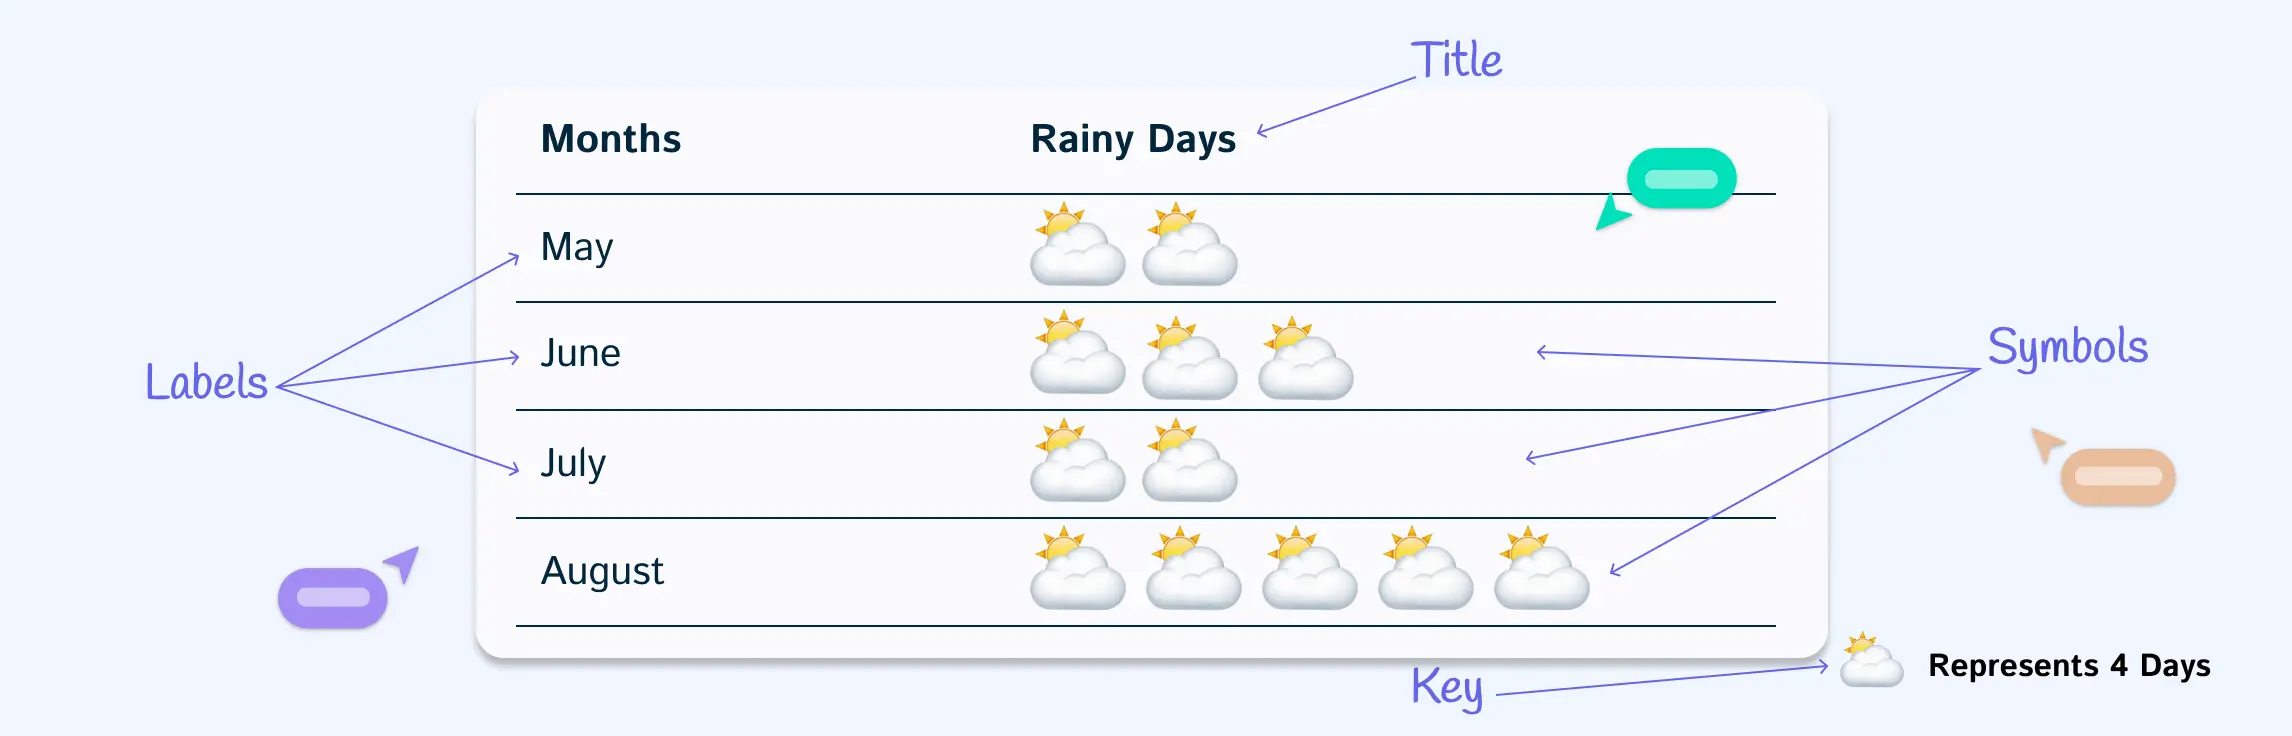
Pictographs turn numbers into pictures, making data easier to read and more fun to explore. Instead of plain figures, you can use icons—like apples for fruit, trees for planting projects, or people for population.
This guide will explain what a pictograph is and break down its key parts. You’ll also learn how to read pictograms, when to use them, and the advantages and disadvantages of using pictograms for visualizing data.
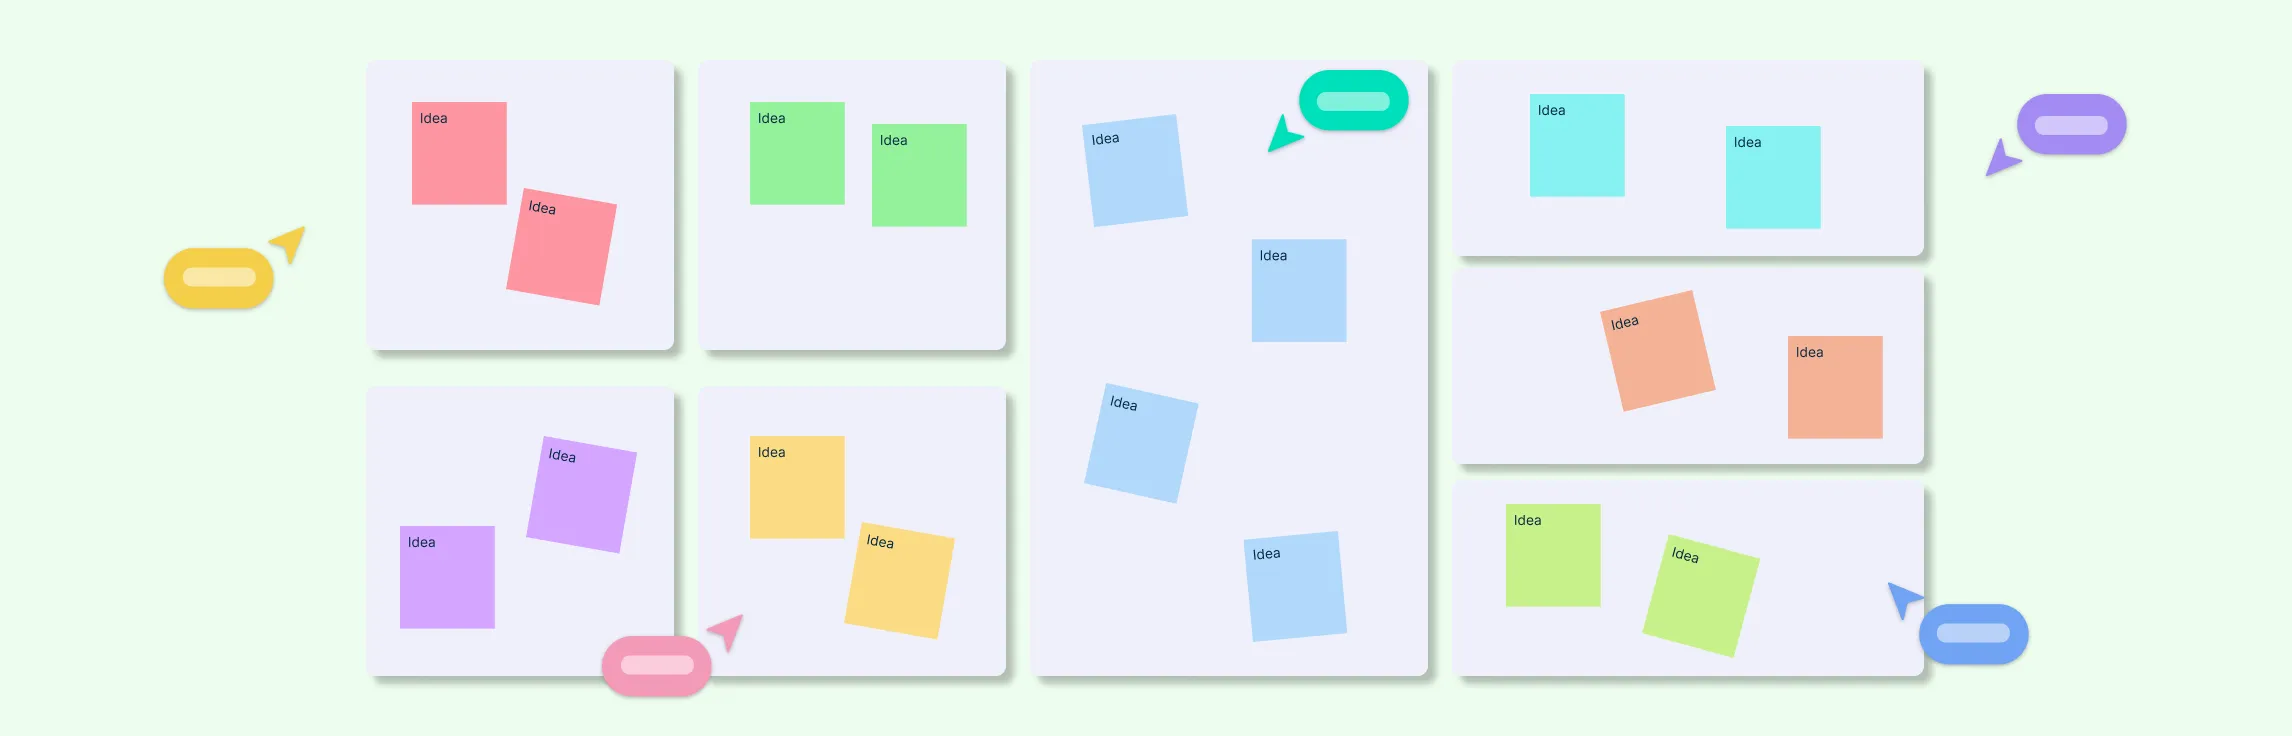
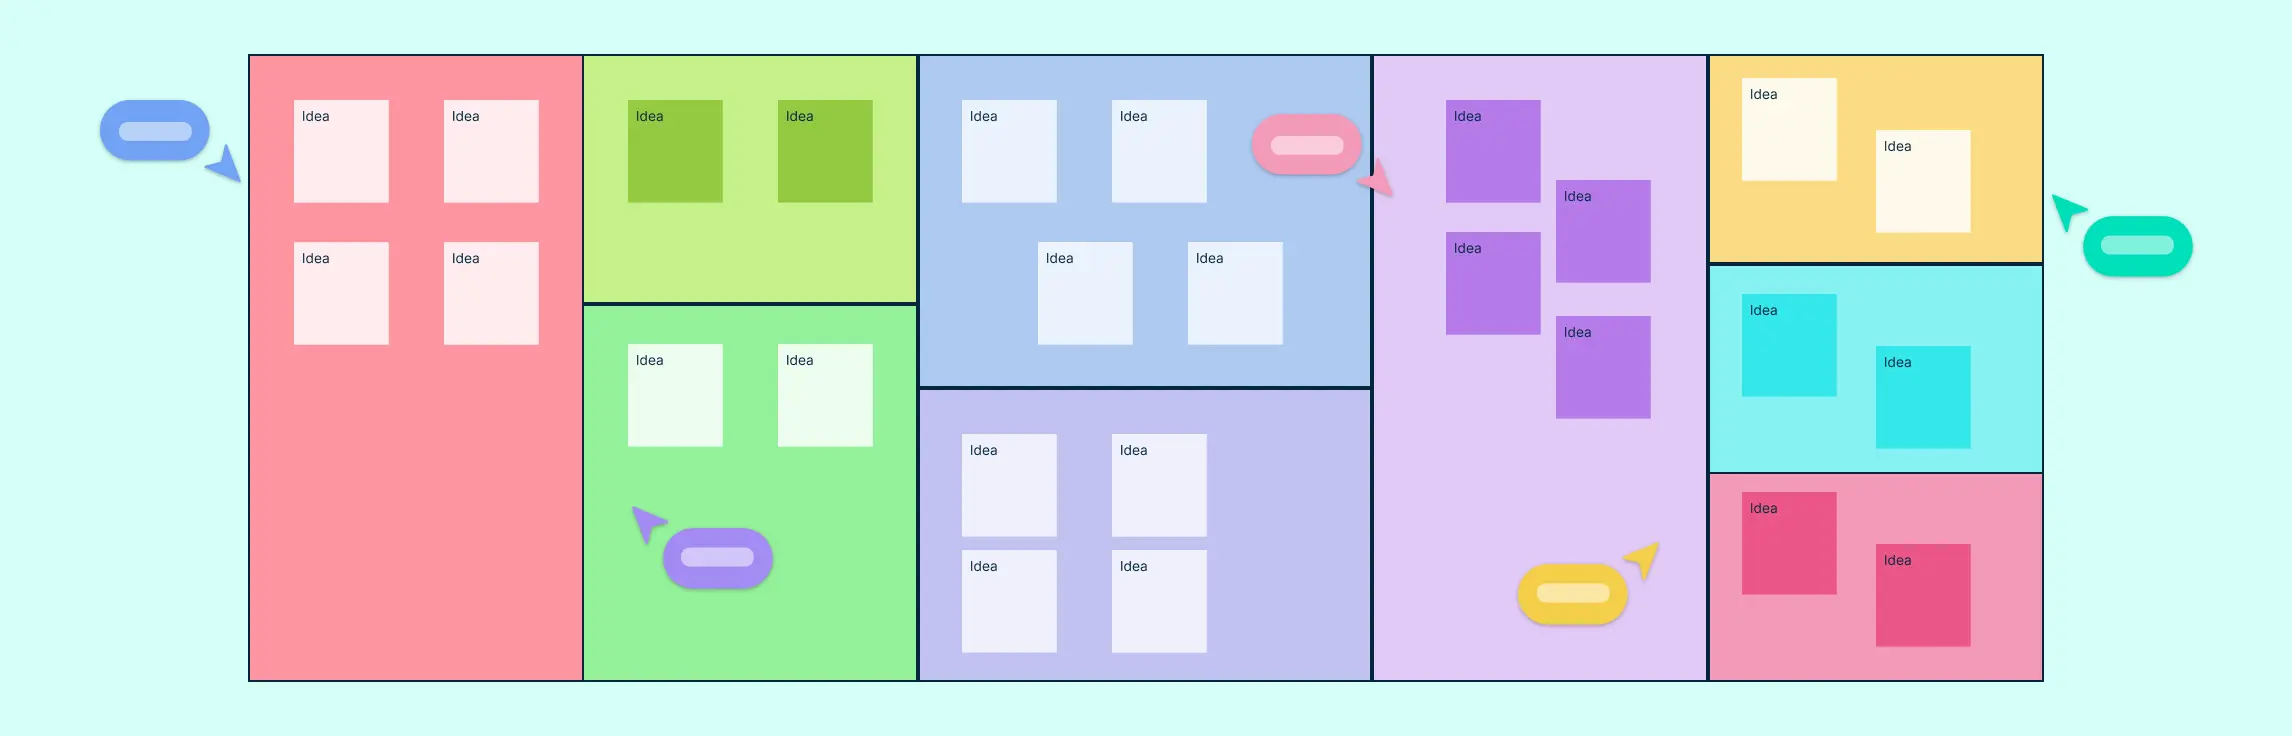
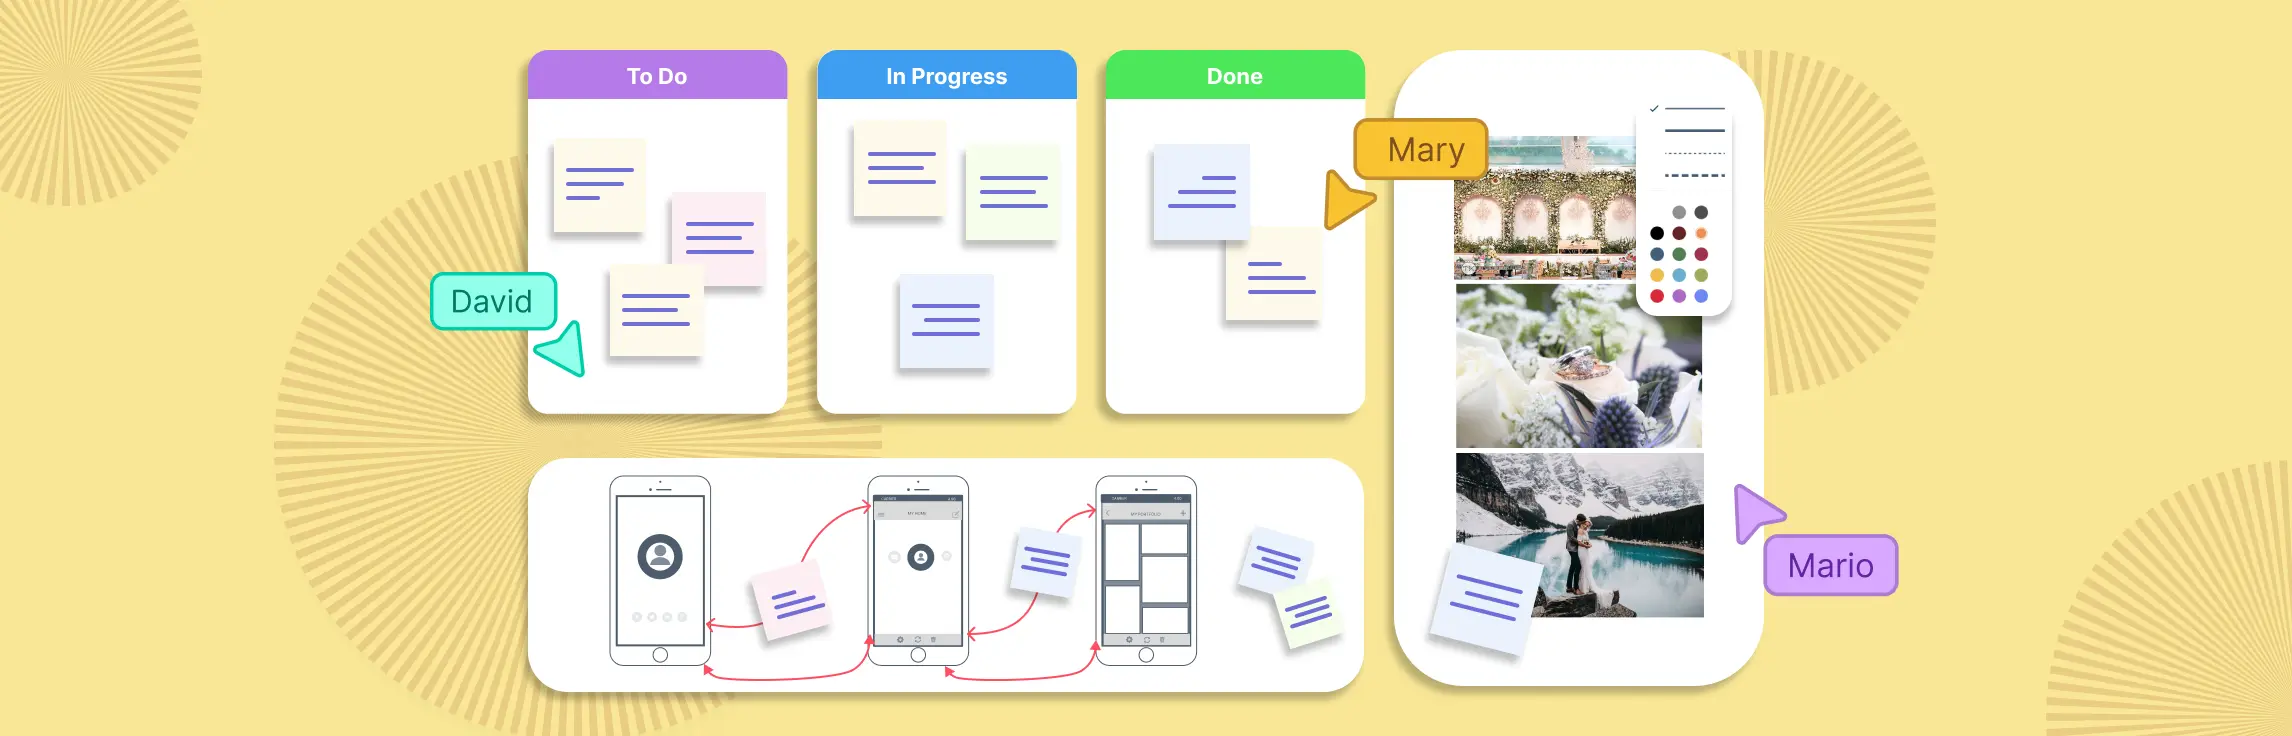
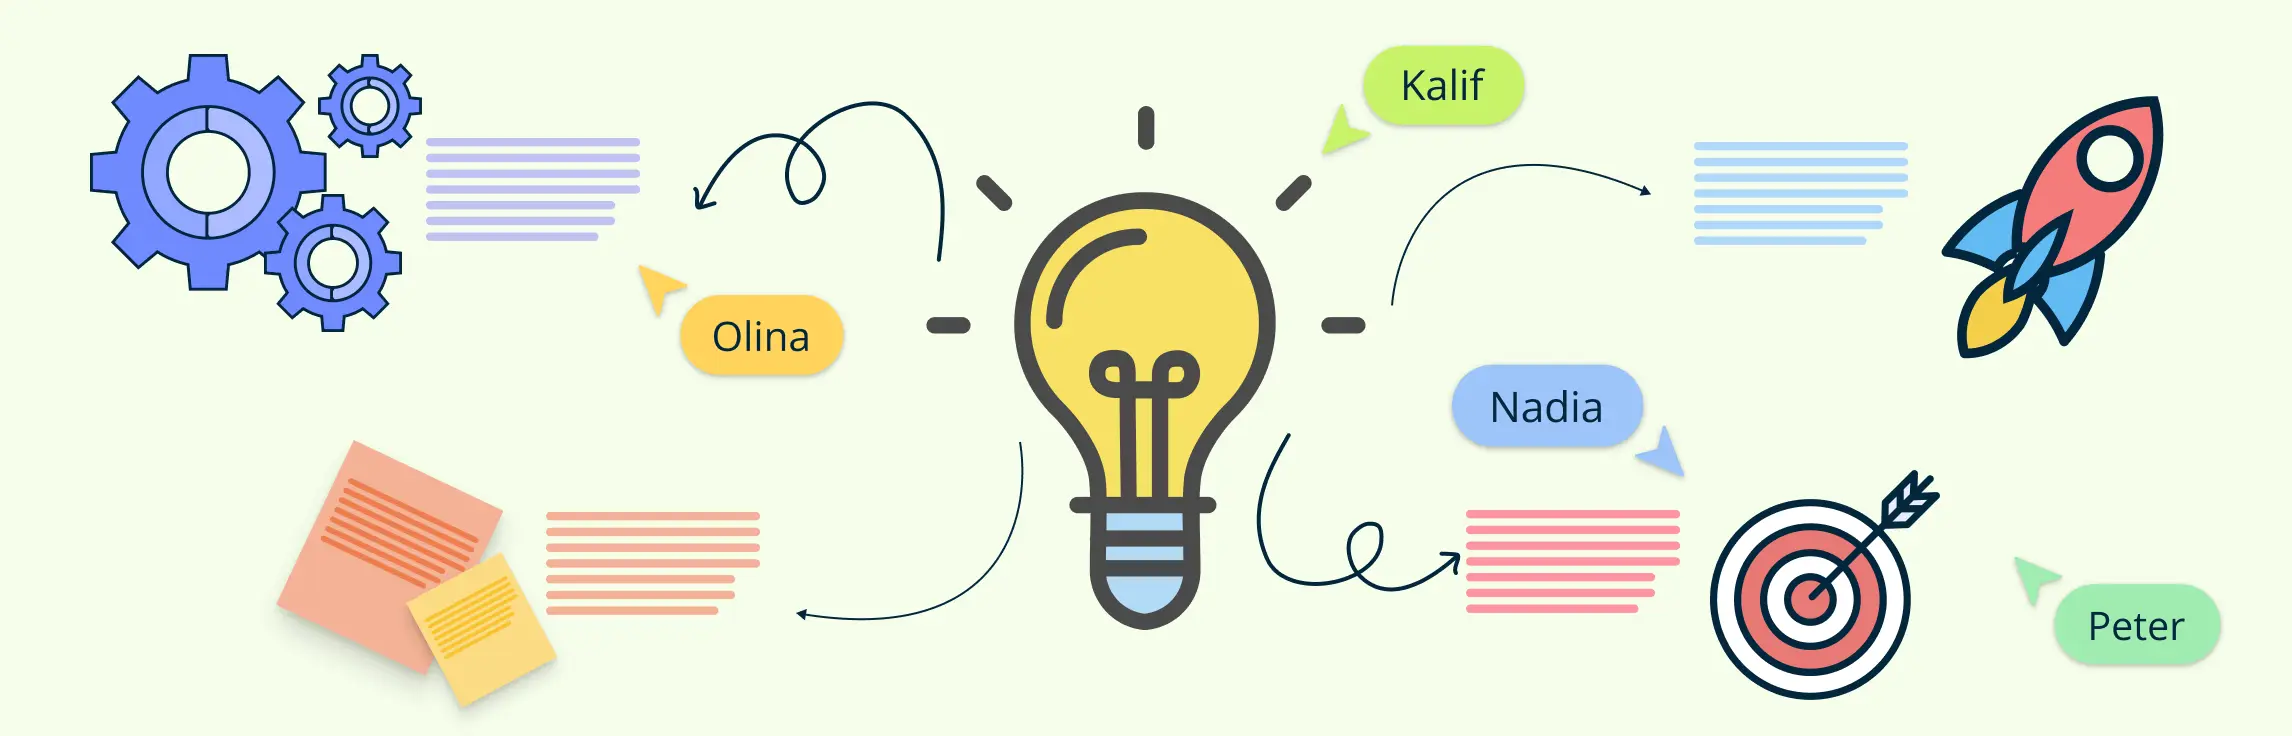
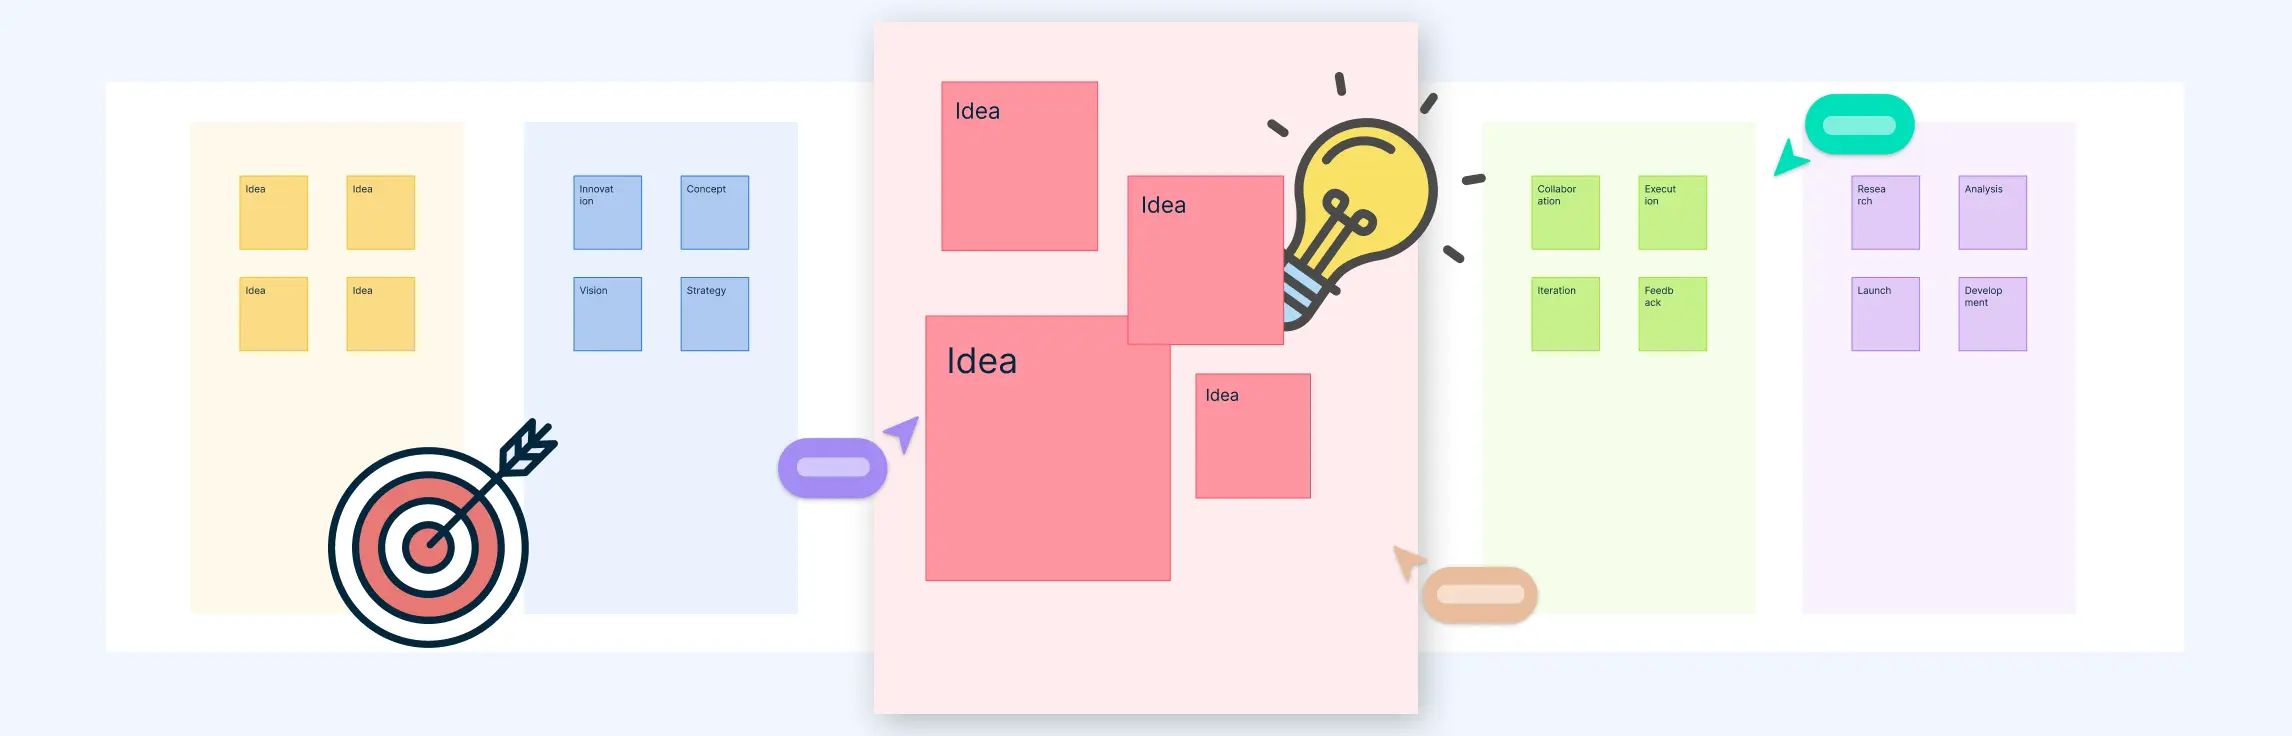
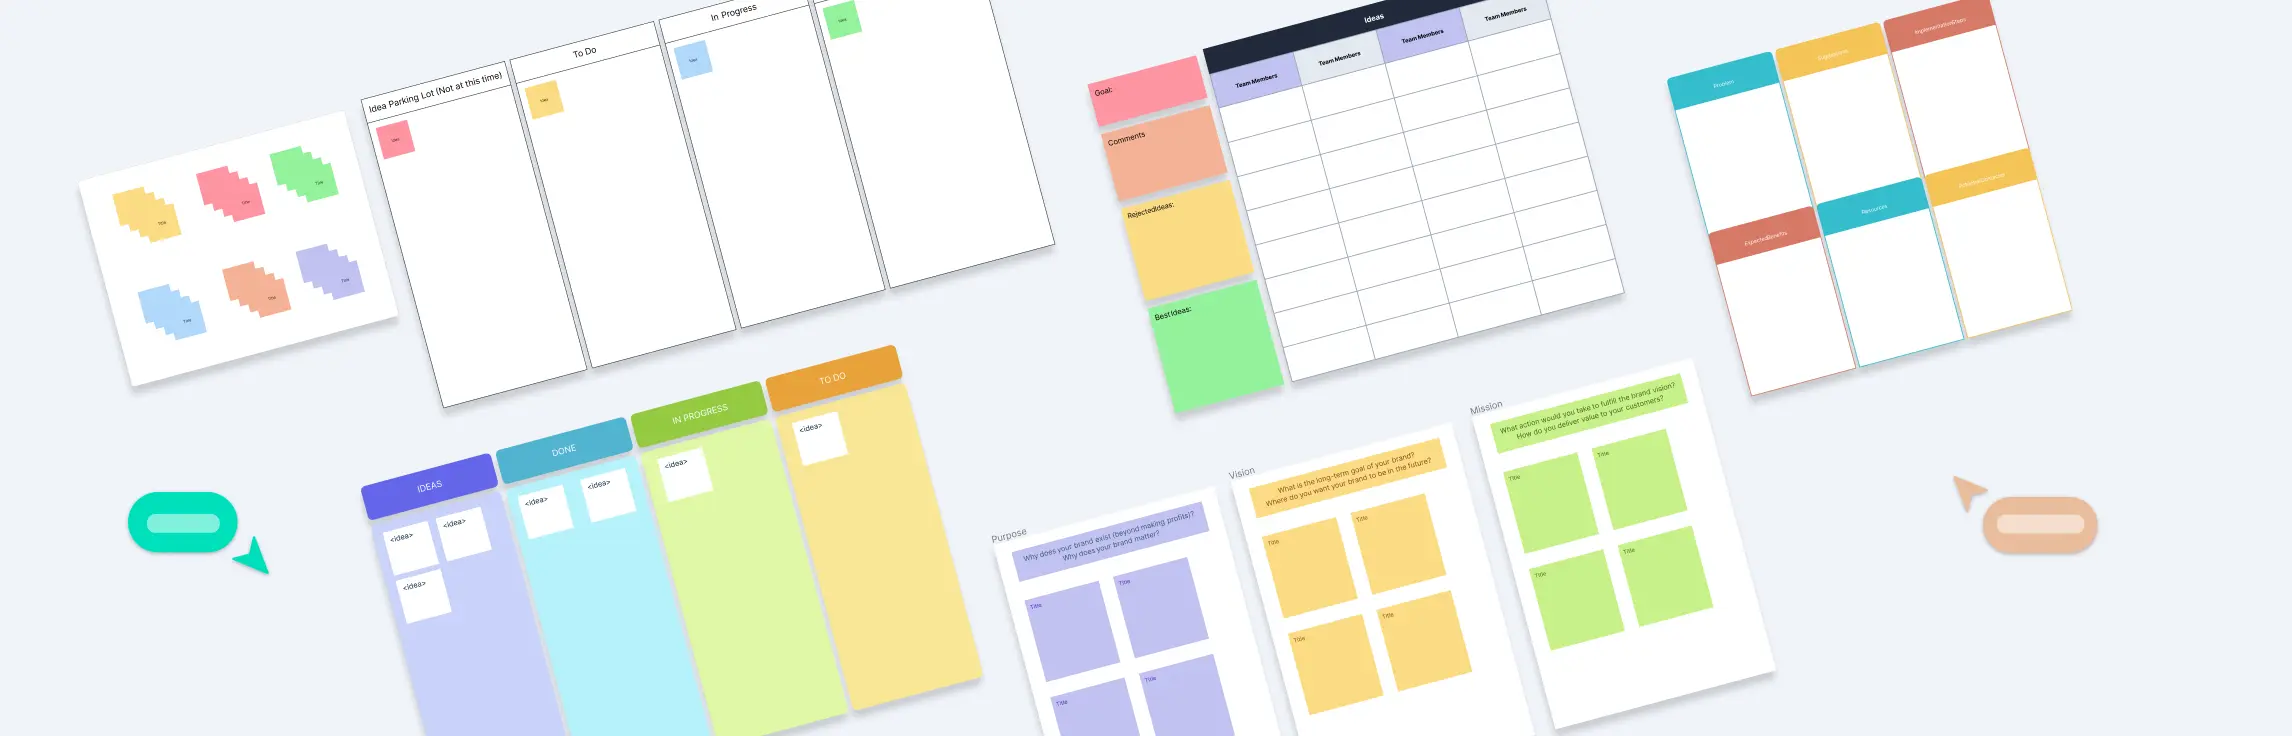
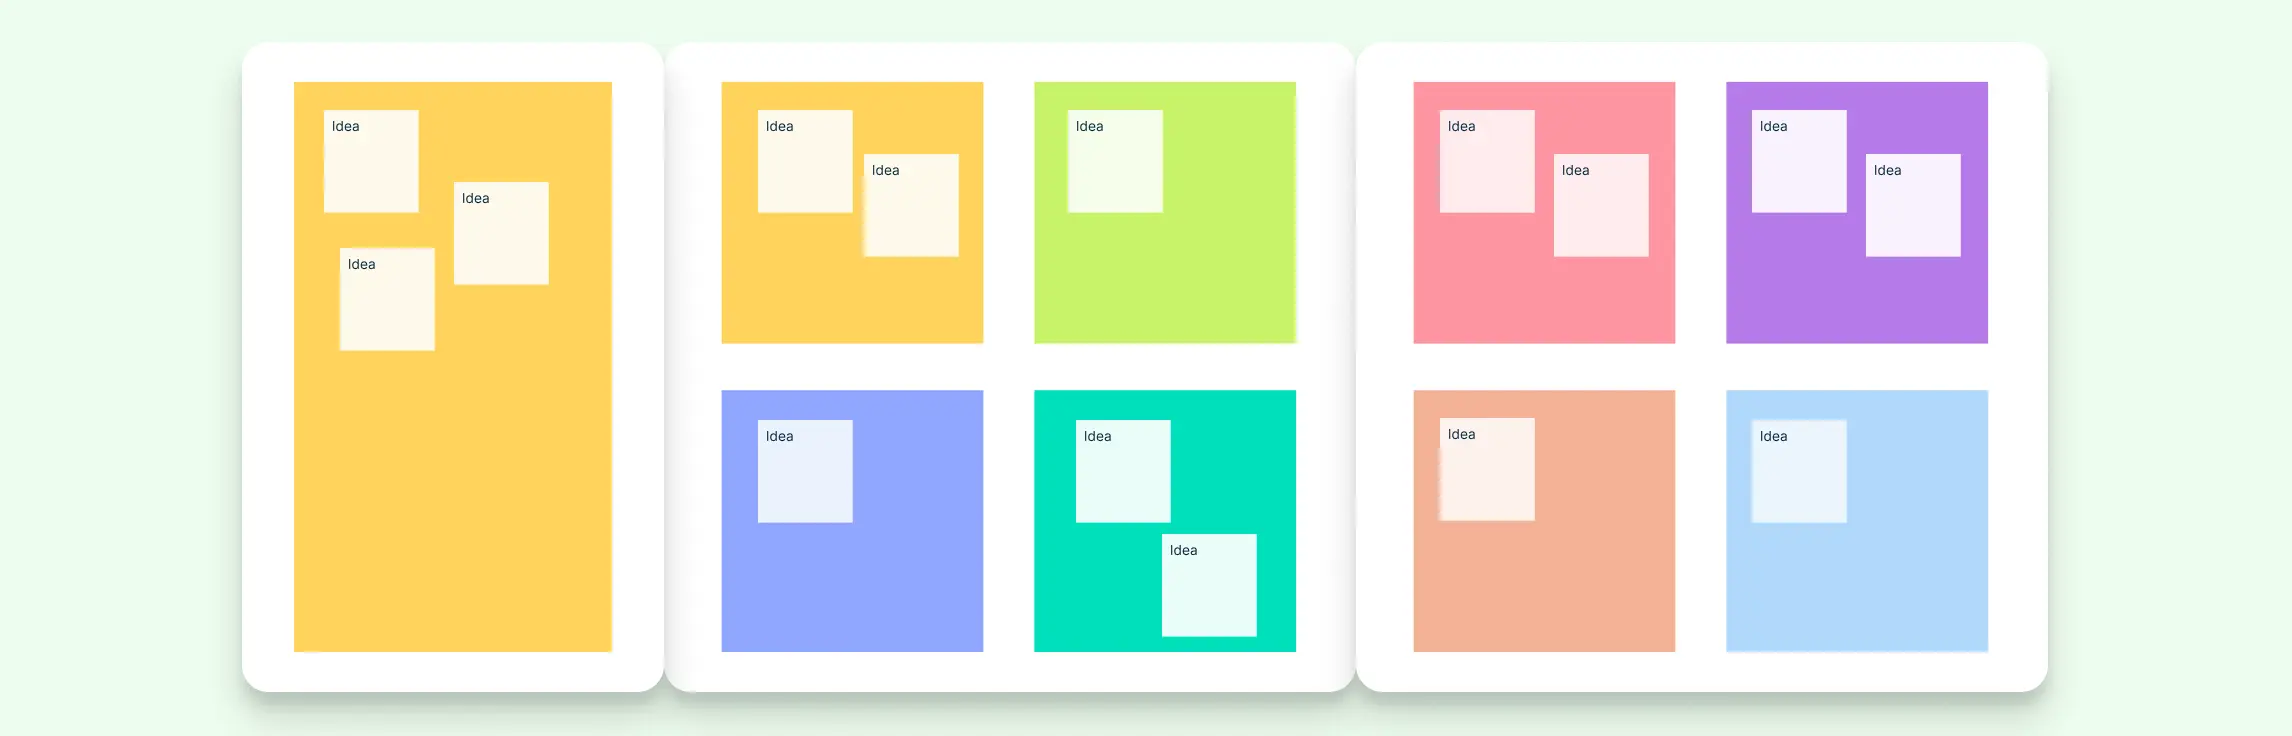
Ever feel like your ideas get lost in a jumble of sticky notes, spreadsheets, or scattered documents? That’s where an idea board comes in a simple, visual tool that brings clarity to creativity. Whether you’re brainstorming alone, collaborating with a team, or managing a complex project, a creative idea board or visual management board helps you see the big picture, organize thoughts, and turn concepts into actionable plans.
Innovation starts with a single spark — a great idea. But turning that spark into a breakthrough requires more than just creativity; it demands a clear, collaborative space where ideas can grow, connect, and evolve. That’s where a Board of Ideas comes in. Whether you’re leading a startup, managing a team, or driving strategic change, a well-structured ideation board acts as the foundation for capturing and shaping innovation. In this guide, we’ll explore what an idea generation board is, how to set one up effectively, and how to use proven frameworks and tools to unlock your team’s creative potential. Let’s dive in and transform the way you innovate.
In today’s fast-paced world, keeping project ideas organized and turning them into actionable plans can be a challenge, especially for remote and hybrid teams. An idea whiteboard offers a simple yet powerful way to capture, visualize, and collaborate on ideas all in one place. Whether you’re brainstorming, planning, or tracking progress, this digital tool helps teams stay aligned and creative. In this guide, you’ll learn what an idea mapping whiteboard is, why it’s essential for projects, how to use it effectively, and discover ready-to-use templates that make getting started easy.
In today’s fast-paced, collaborative environments, having a structured space to capture and grow ideas is essential. Idea boards for work provide that space, serving as a digital hub where teams brainstorm, organize thoughts, and align on next steps. Whether you’re planning a product roadmap, leading a workshop, or ideating a new campaign, idea boards keep your team focused, engaged, and moving forward.
In fast-moving hybrid work environments, capturing and prioritizing ideas across teams can be chaotic. That’s why more teams today are asking: What is an idea board?
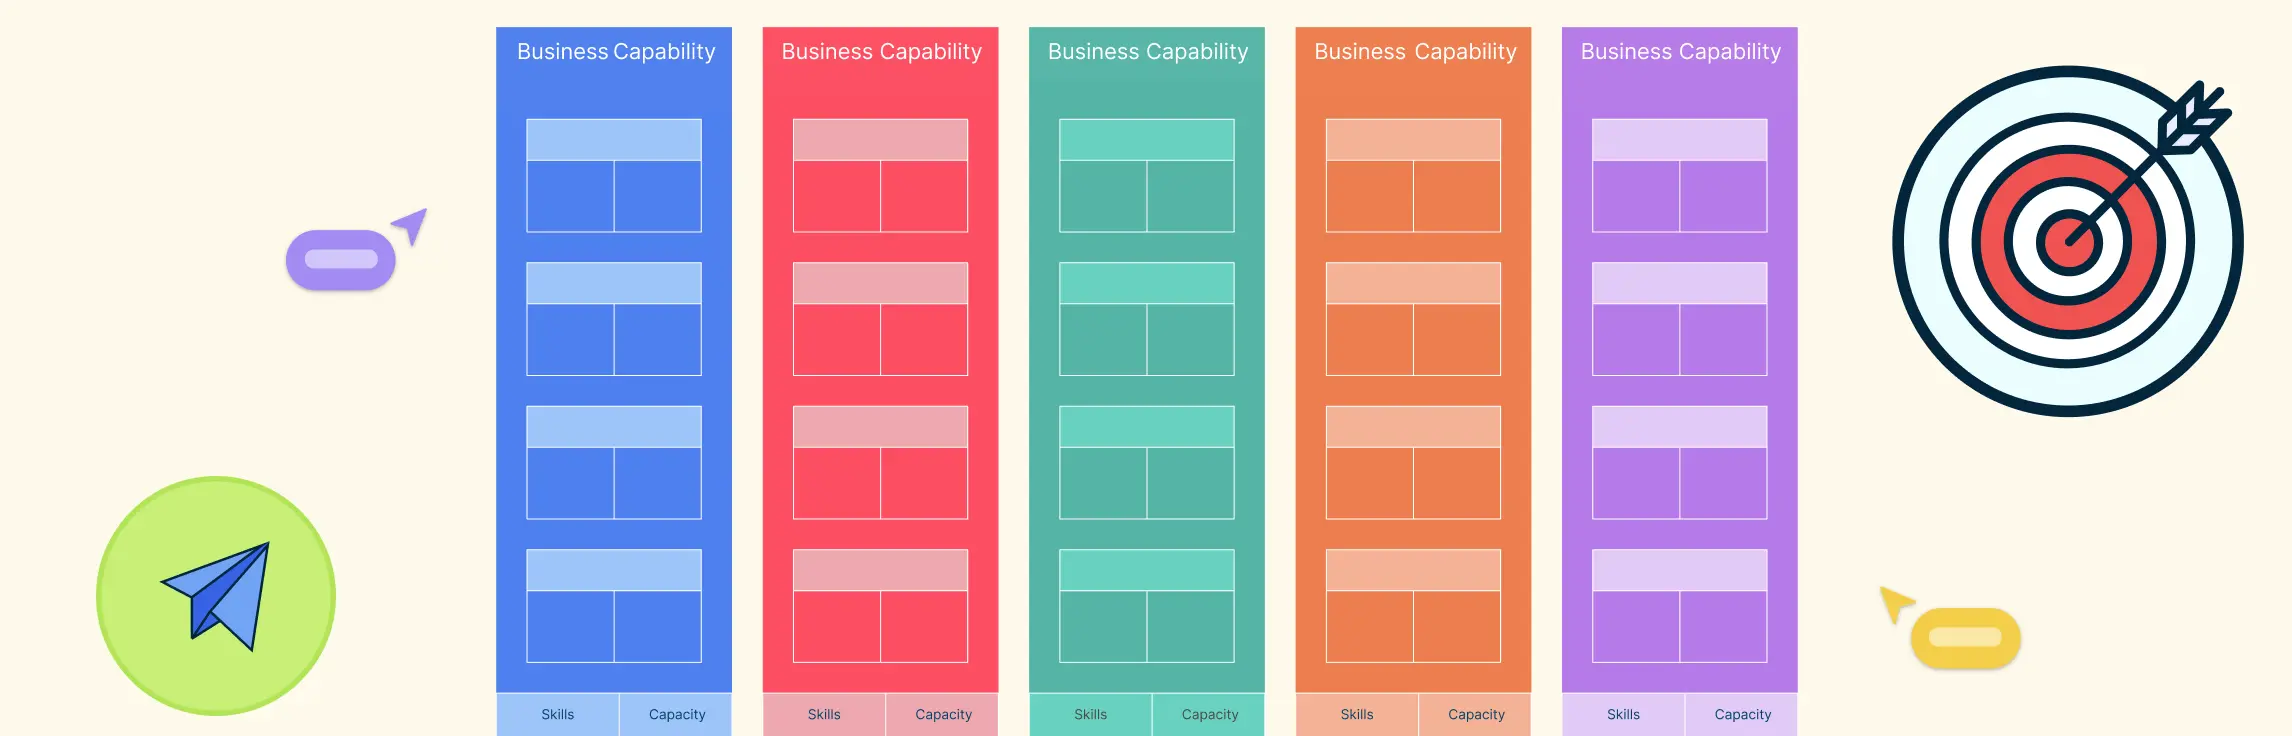
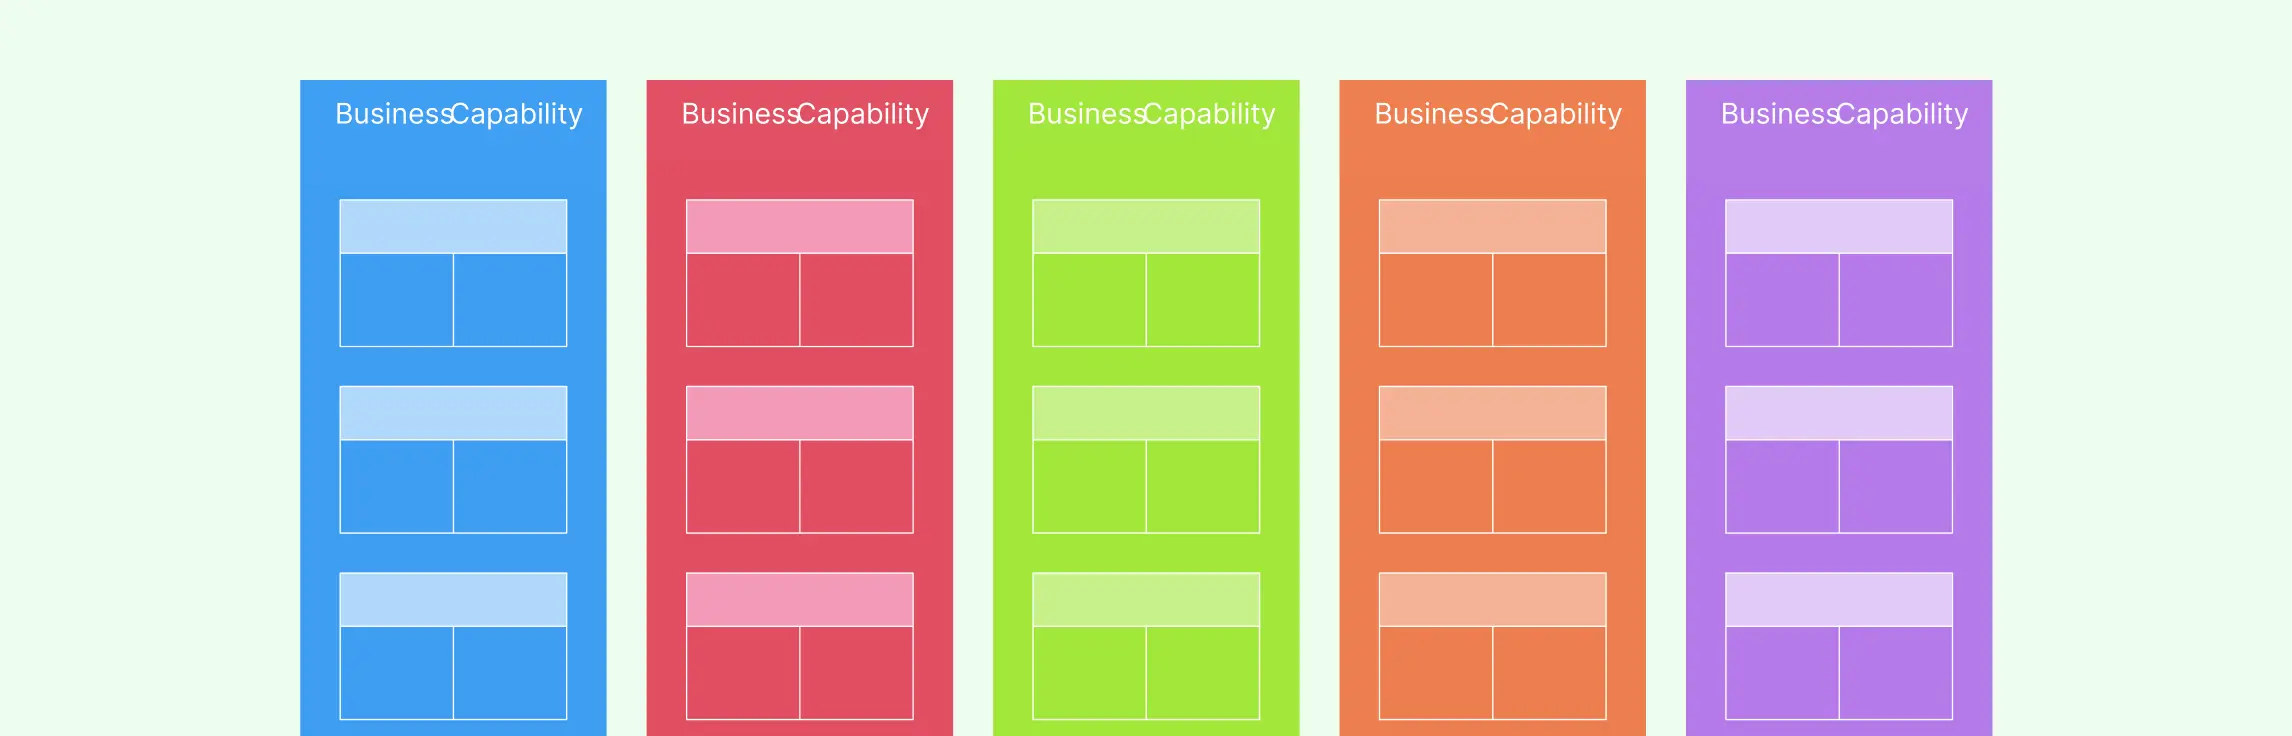
What Is a Business Capability Model? A business capability model is a visual representation of what a business does to deliver value, completely independent of how it’s done, who does it, or what systems are used.
What Is an Enterprise Capability Model An enterprise capability model is a structured, hierarchical representation of what an organization does, independent of how, where, or by whom the work is performed. It defines an organization’s capabilities—the core functions or outcomes it must deliver to succeed—without tying them to specific processes, systems, departments, or people.
Creating a business capability map might sound complex, but it’s really about stepping back and taking a thoughtful look at what your business needs to be able to do — not how it does it or who does it. The goal is to create a big-picture view of your organization’s abilities so you can plan better, make smarter decisions, and stay aligned. Let’s see how to create a business capability map.
A business capability map is a high-level view of what your organization does to deliver value, focusing on core areas like customer management, product development, or logistics. It strips away the complexity of roles and processes to highlight the actual capabilities that drive the business. In strategic management, capability maps help leaders see where the organization is strong, where it needs improvement, and where to invest. They provide a clear, shared view that connects strategy with real execution. Let’s see how to use business capability maps for strategic management.
Problem-solving tools are methods, techniques, or visual aids that help individuals and teams understand problems, find their causes, and identify effective solutions. These tools organize thinking, guide the decision-making process, and improve how people approach challenges—whether simple or complex.
A business capability map is a visual representation that shows what an organization is able to do. It doesn’t focus on how the work gets done, who does it, or what tools are used. Instead, it outlines the core abilities that allow the business to operate, deliver value to customers, and achieve its goals. These abilities, called capabilities, are stable over time even when processes, people, or technologies change.
Flowcharts are a great way for students to organize thoughts, simplify complex tasks, and improve problem-solving skills. In this guide, we’ll explore flowchart examples for students that cover various academic and personal scenarios, from solving math problems to planning study routines.
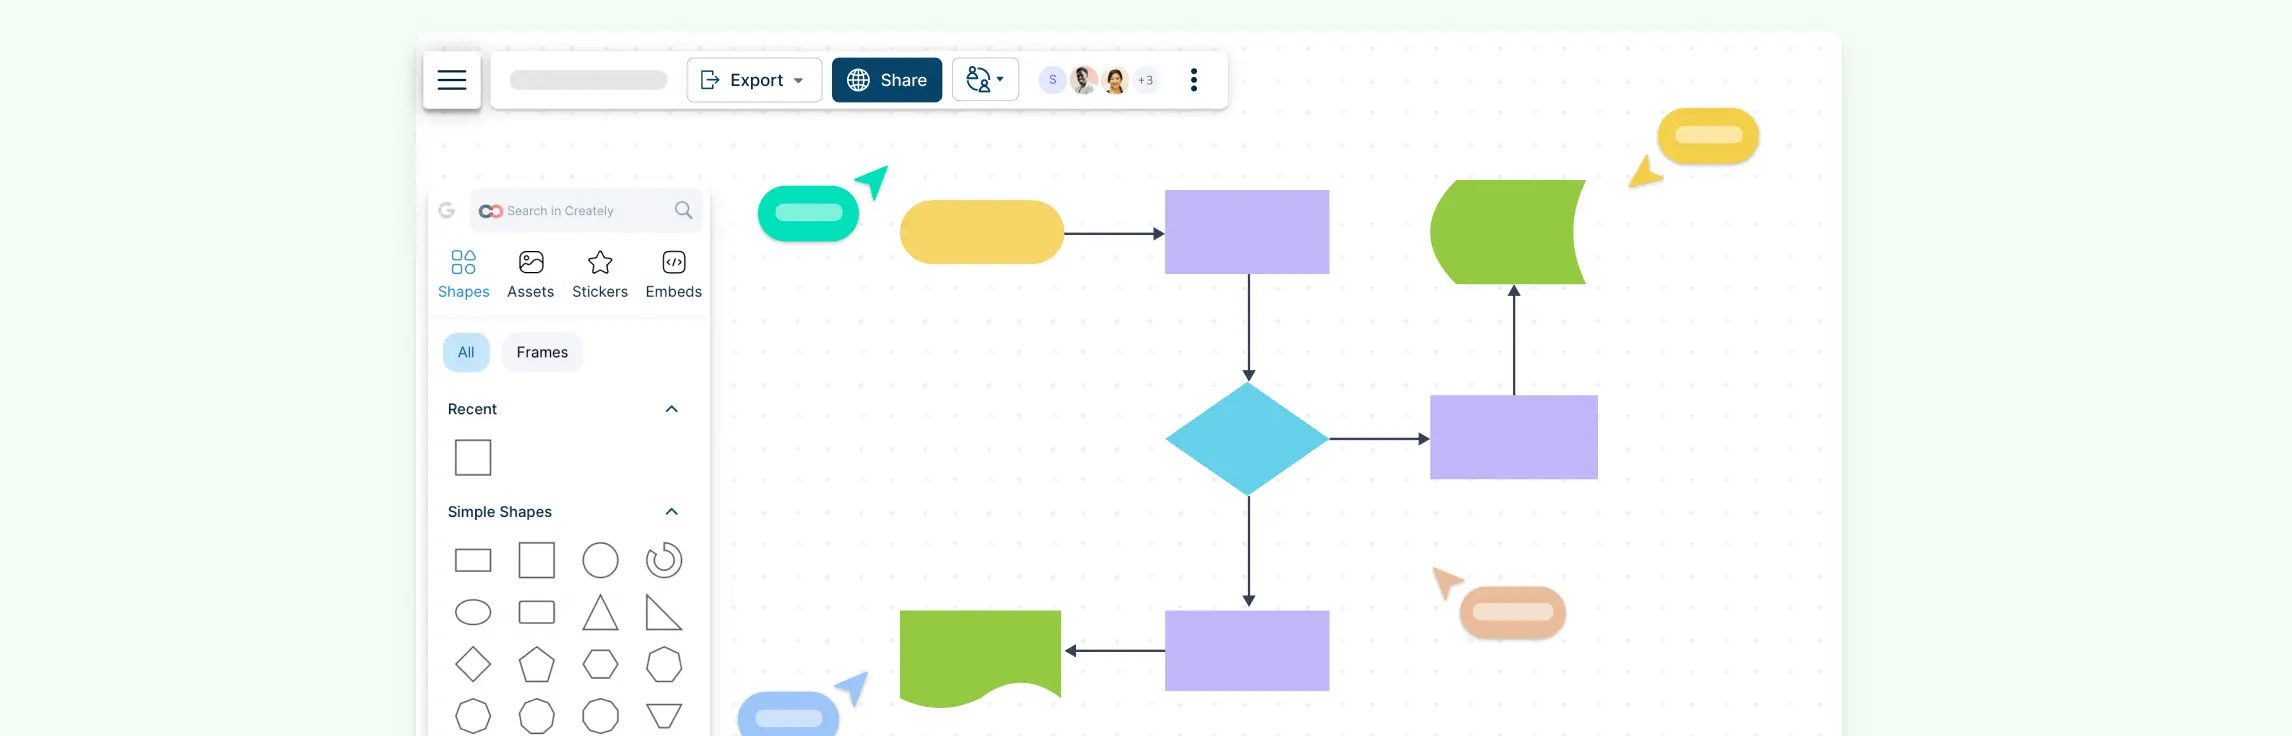
Flowcharts are powerful tools for visualizing processes and making complex information easier to understand. Whether you’re mapping out a business process, designing software, or planning a project, flowcharts help you break down tasks step by step. However, to create clear and effective flowcharts, it’s important to follow certain flowchart rules.
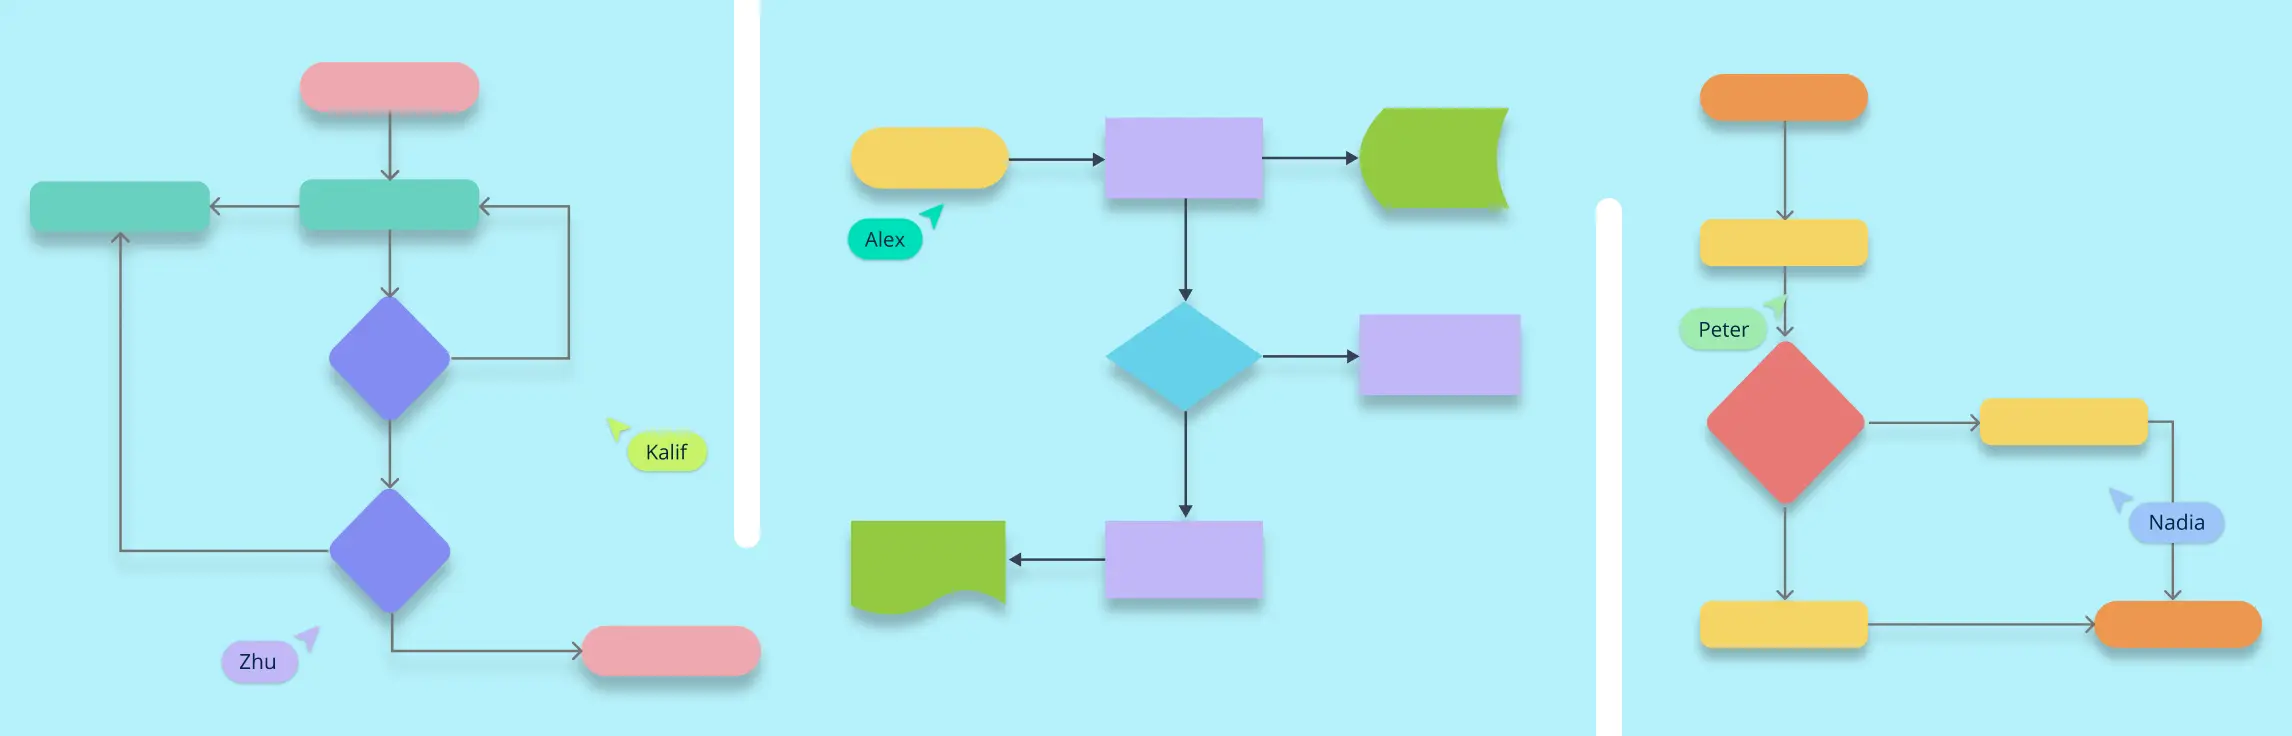
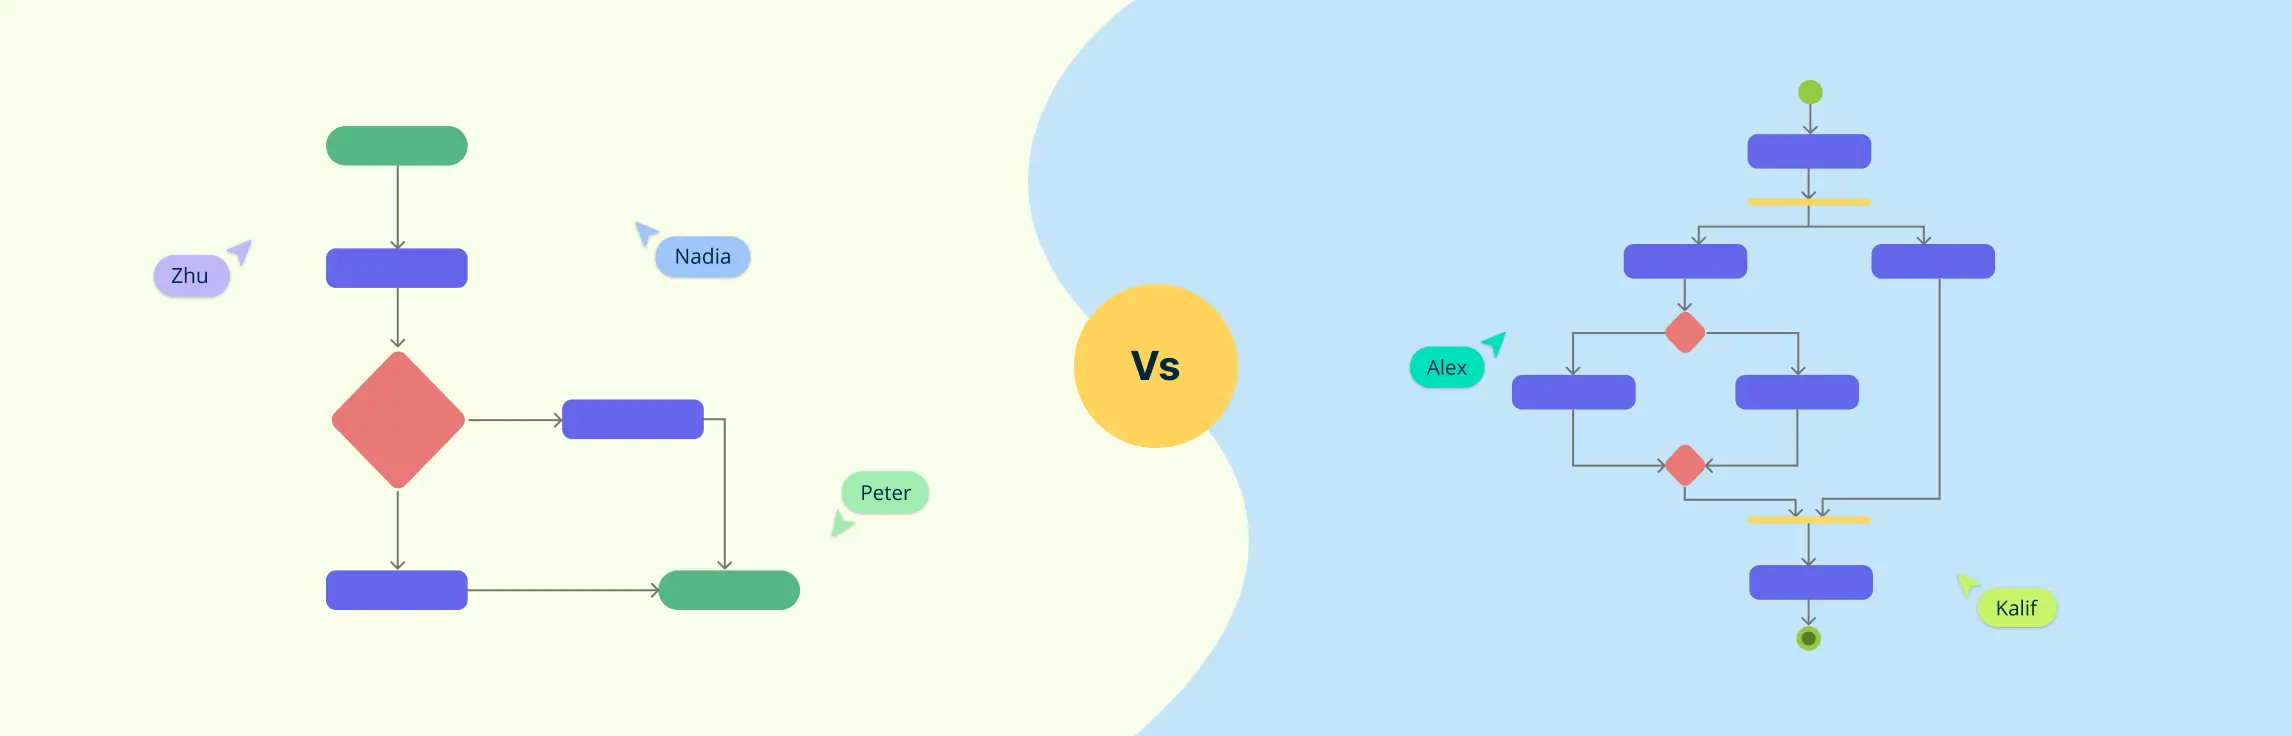
When mapping out processes, whether for business, software development, or everyday workflows, visual diagrams make things clearer. Two commonly used tools for this are flowcharts and activity diagrams. At first glance, they may seem similar—both show steps in a process—but they serve different purposes and are used in different fields.
A cross-functional flowchart is a simple but powerful tool that helps businesses and teams visualize their processes more clearly. Unlike a regular flowchart, it doesn’t just show the steps of a process—it also highlights who is responsible for each step. This makes it especially useful for teams that work across different departments, ensuring everyone understands their role in the bigger picture.
Every day, businesses and organizations handle countless documents—contracts, invoices, reports, and more. Keeping track of how these documents move from one step to another can get complicated. That’s where a document flowchart comes in.
Mathematics can be a challenging subject for many students, and understanding complex concepts often requires a visual approach. Math graphic organizers are powerful tools that help simplify difficult topics, improve understanding, and make problem-solving more efficient. These organizers not only aid in organizing information but also provide a way for students to visualize mathematical relationships, patterns, and solutions. In this article, we will explore 8 essential math graphic organizers that can boost learning, comprehension, and problem-solving skills in mathematics.
A flowchart loop is a fundamental concept in process automation and programming, allowing tasks to repeat based on a defined condition. Whether used in software development, workflow optimization, or decision-making processes, flowchart loops help visualize repetitive actions clearly and efficiently.
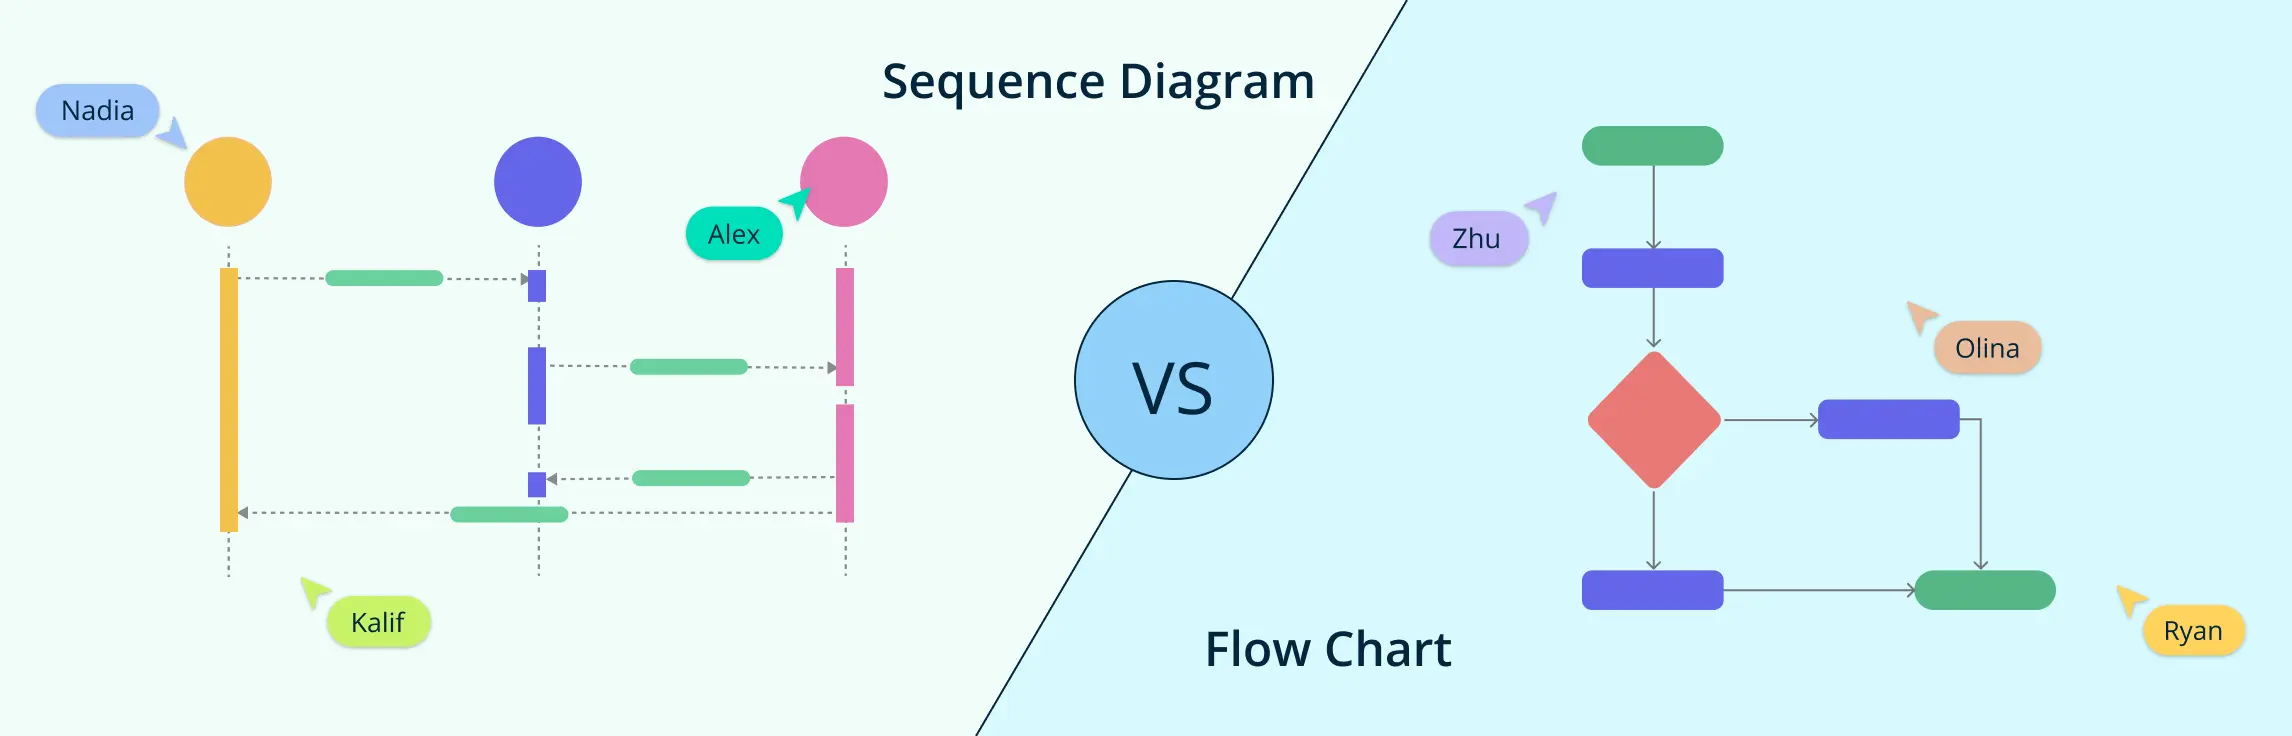
When it comes to visualizing processes and system interactions, two of the most commonly used diagramming methods are flowcharts and sequence diagrams. While both are powerful tools for representing workflows and system behaviors, they serve distinct purposes and follow different structures.
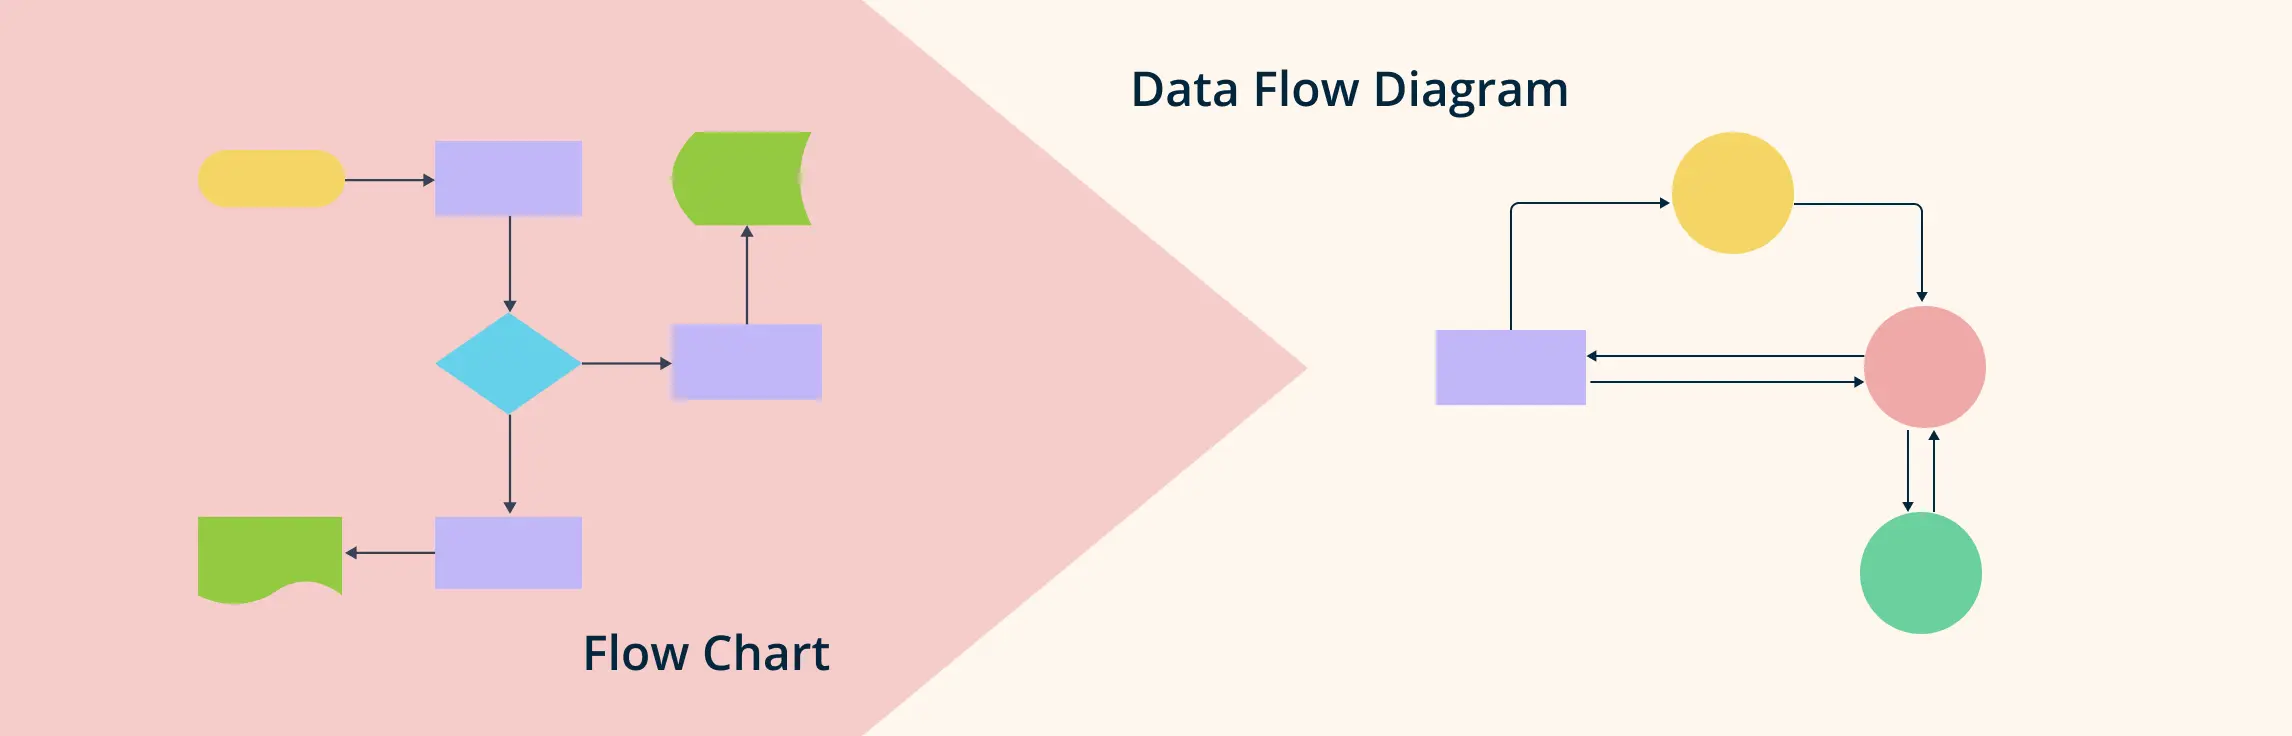
In today’s fast-paced world, visualizing data and processes is essential for clear communication and effective decision-making. Flowcharts and Data Flow Diagrams (DFDs) are powerful tools that help break down complex workflows, making them easier to understand and analyze. Whether you’re looking to map out a business process, analyze a data system, or improve communication within your team, flowcharts and DFDs can simplify the process and enhance collaboration.
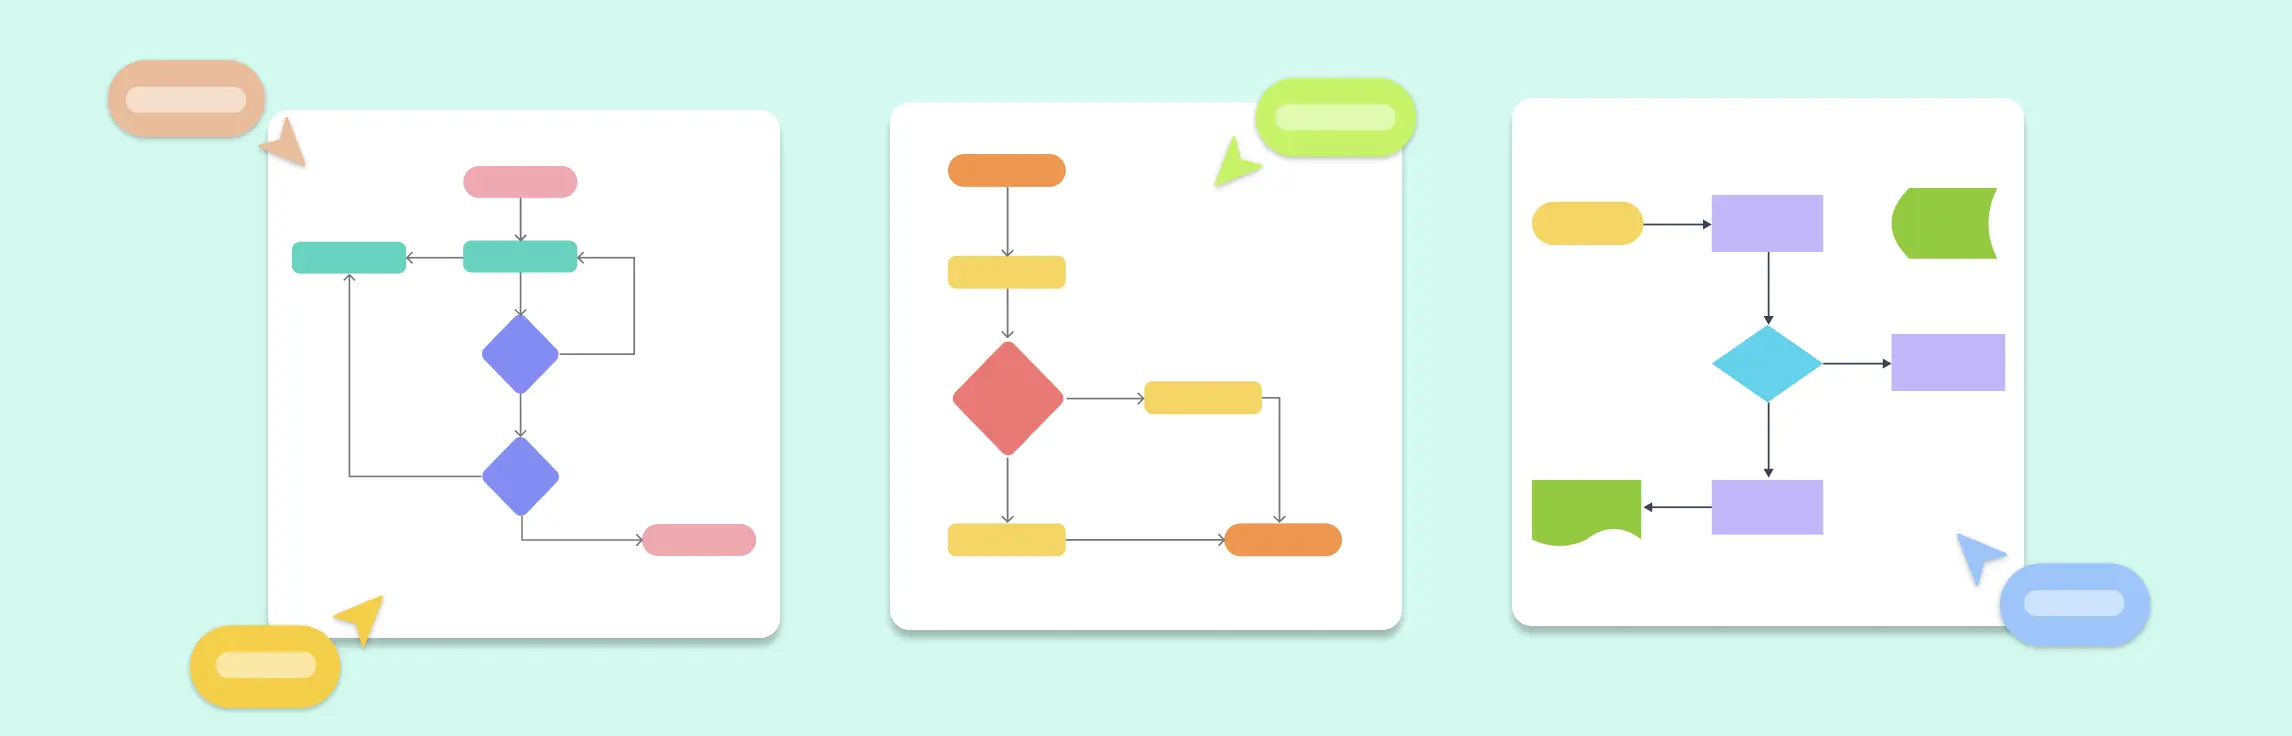
Flowcharts are powerful tools that help visualize processes, systems, and workflows. Whether you’re mapping out a business operation, designing a computer program, or organizing daily tasks, flowcharts make complex ideas easier to understand.
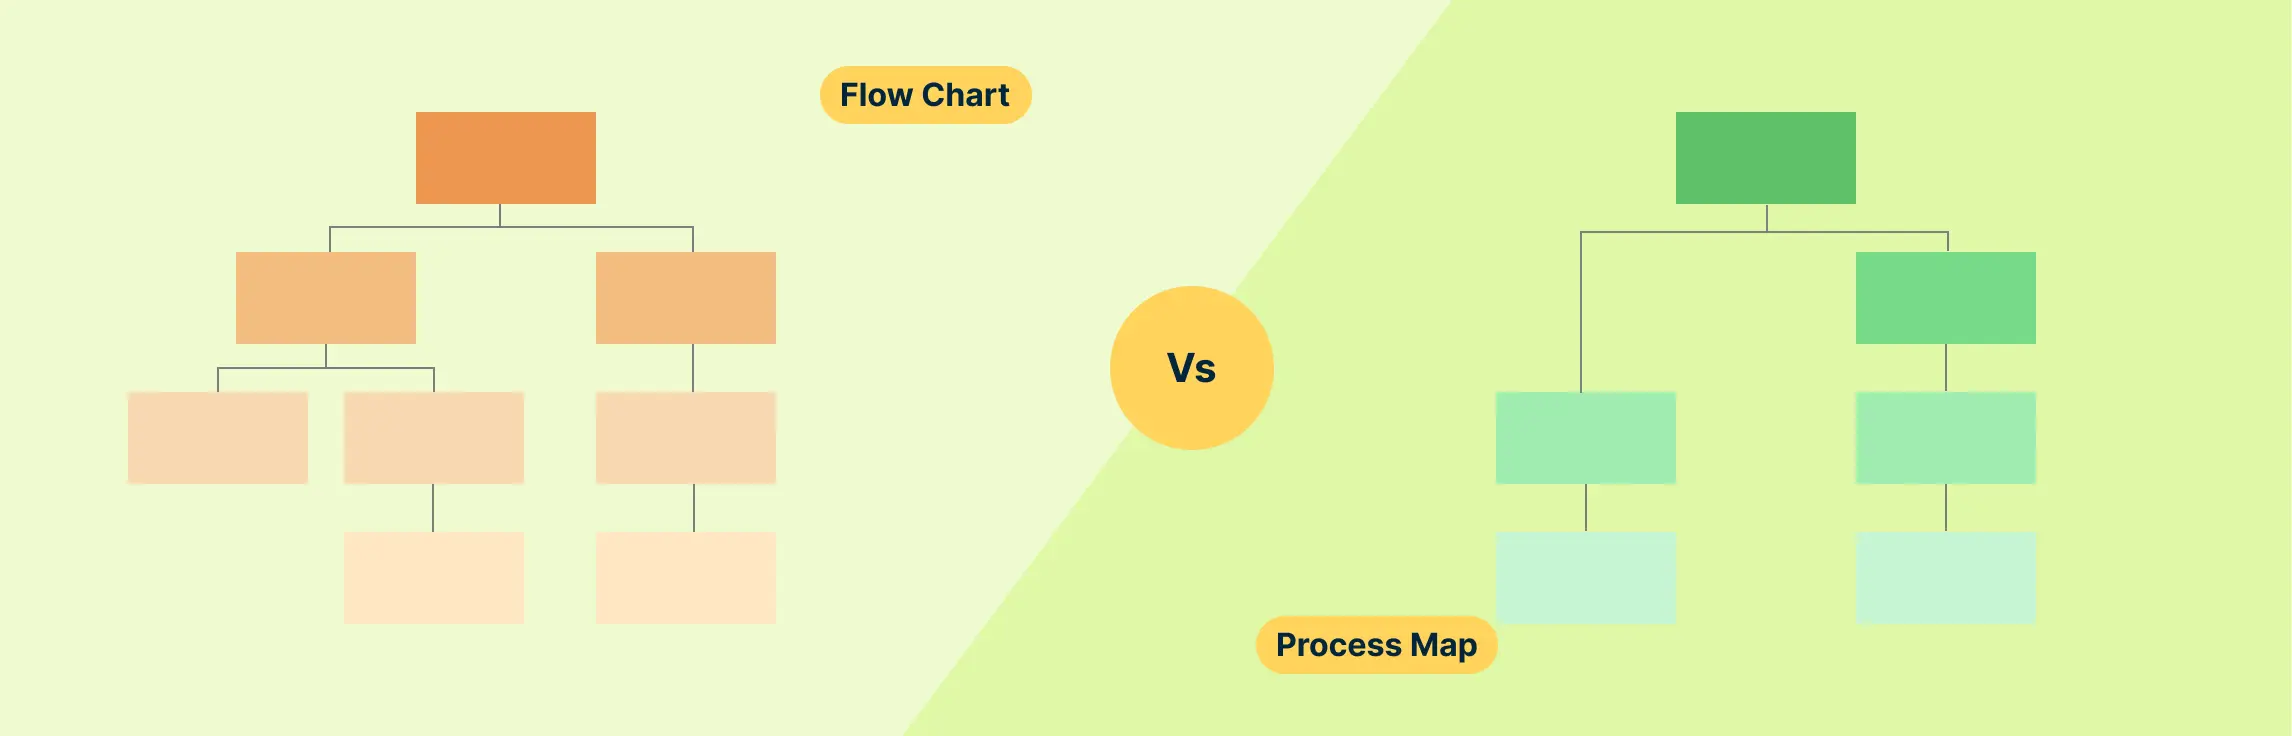
Understanding processes is key to making tasks more efficient and effective, whether you’re managing a project, improving workflows, or solving problems. Two useful tools for visualizing and analyzing processes are flowcharts and process maps. Though they may look similar, each one serves a distinct purpose and works better in different scenarios.
A decision flowchart is a simple yet powerful tool that visually maps out choices and outcomes, making decision-making easier. Whether for work, projects, or daily life, a decision-making flowchart helps clarify options and improve efficiency.
An Emergency Action Plan (EAP) for schools is a critical safety strategy that outlines procedures for effectively responding to crises and ensuring the well-being of everyone on campus. Schools need clear and actionable emergency protocols that align with local laws and safety regulations. Emergency action plan should be updated regularly and communicated to all stakeholders, including students, teachers, parents, and emergency responders.
A successful CAP should include clear objectives, measurable expectations, a timeline for improvement, and support mechanisms for the employee. Corrective action plans are essential for maintaining workplace standards, ensuring compliance with company policies, and fostering a culture of continuous improvement. Here is a 10 Examples of Corrective Action Plans for Employees
Employee action plans can be used for professional development, performance improvement, or addressing behavioral concerns. They provide employees with a clear understanding of their objectives while offering managers a structured method to monitor and support progress. Here are 10 examples of employee action plans with editable templates.
Management action plans can address various business needs, such as project execution, risk management, performance improvement, and strategic planning. Below are ten examples of management action plan templates that organizations can use to enhance efficiency and productivity. Here are 10 Examples of Management Action Plan with templates.
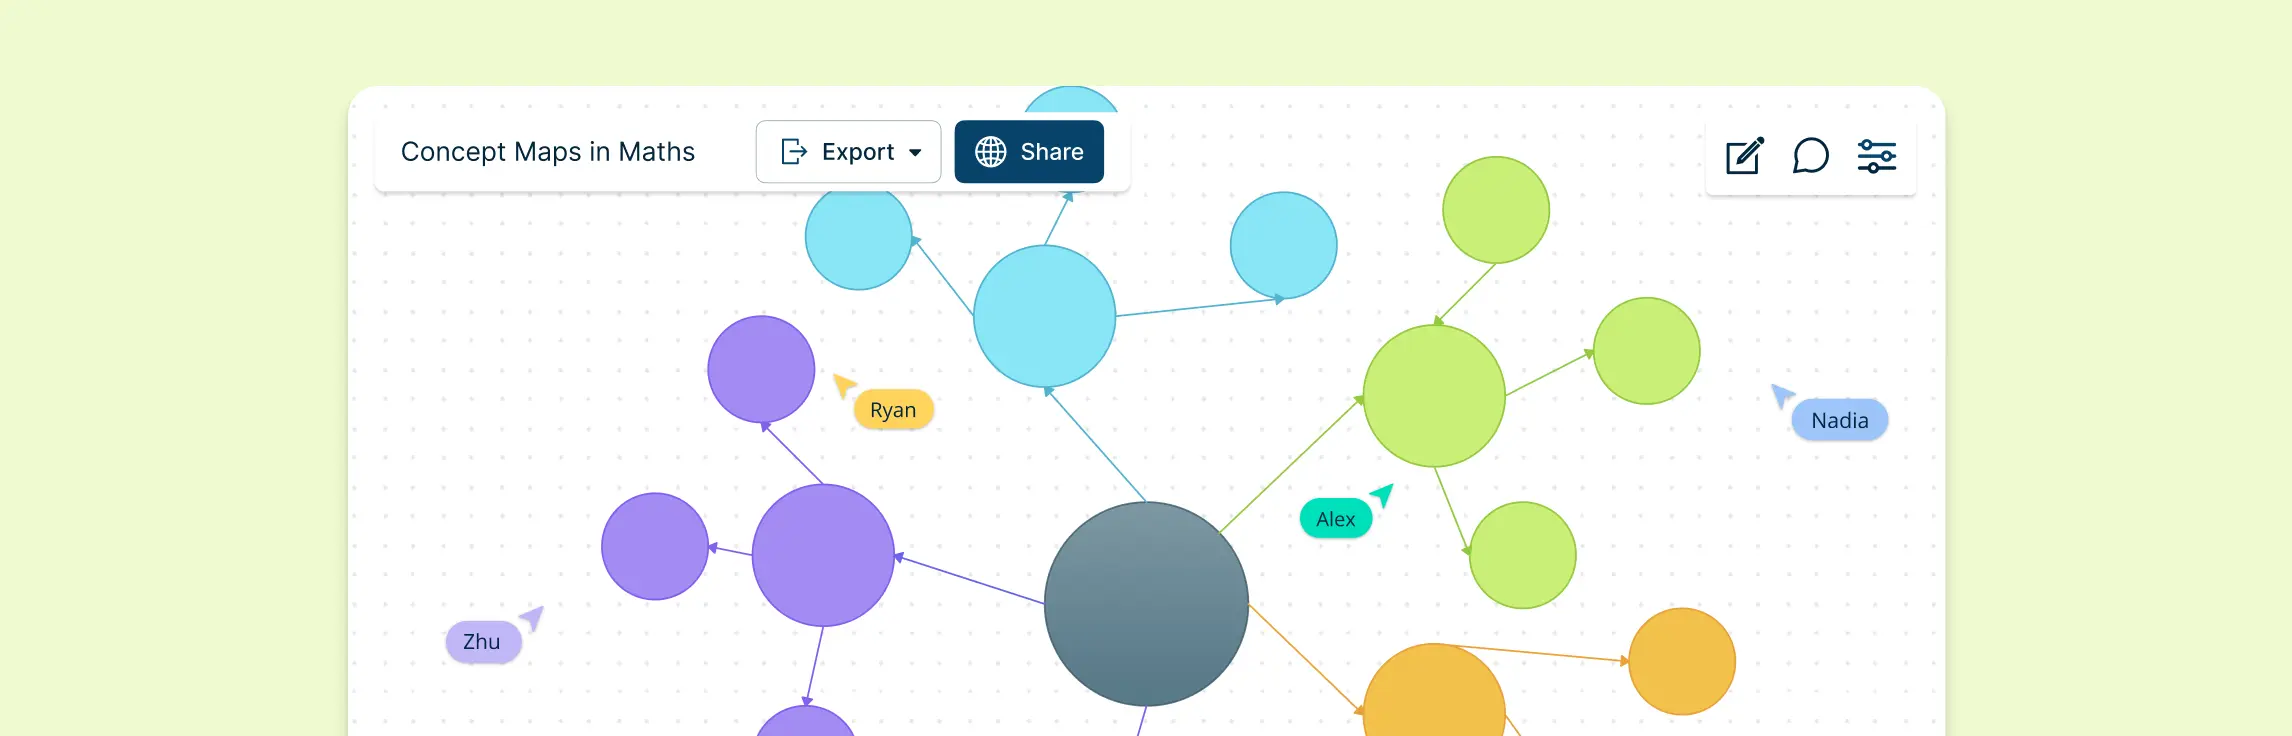
Mathematics can often feel overwhelming due to its abstract concepts, complex formulas, and intricate relationships between ideas. However, one powerful tool can simplify these challenges: concept maps.In this guide, we’ll explore how concept mapping maths can transform the way you learn and teach mathematics, offering step-by-step guidance and real-world examples to help you get started.
Using a concept map for research helps researchers organize and represent ideas, concepts, and their relationships within a research project. In this guide, we will explore how concept mapping in research can simplify the process of visualizing your ideas, enhance your critical thinking, and improve your research outcomes.
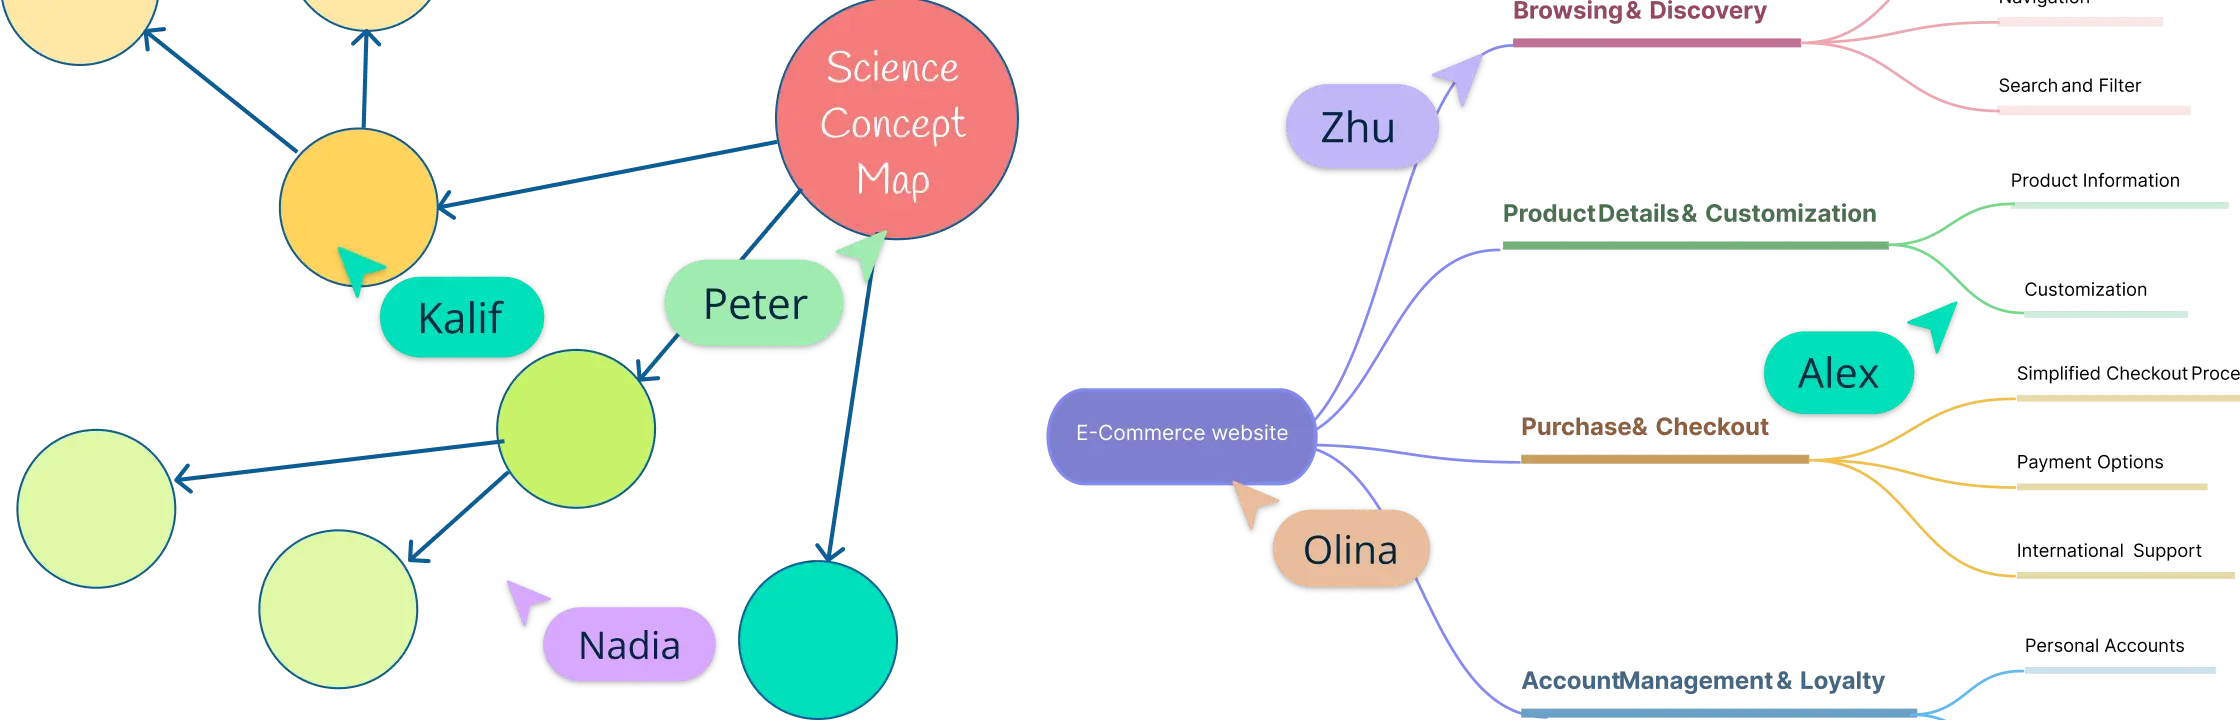
Definition of a Concept Map Concept map is a visual tool used to represent relationships between different concepts. They help organize and structure knowledge in a way that makes connections and hierarchies clear. They contain,
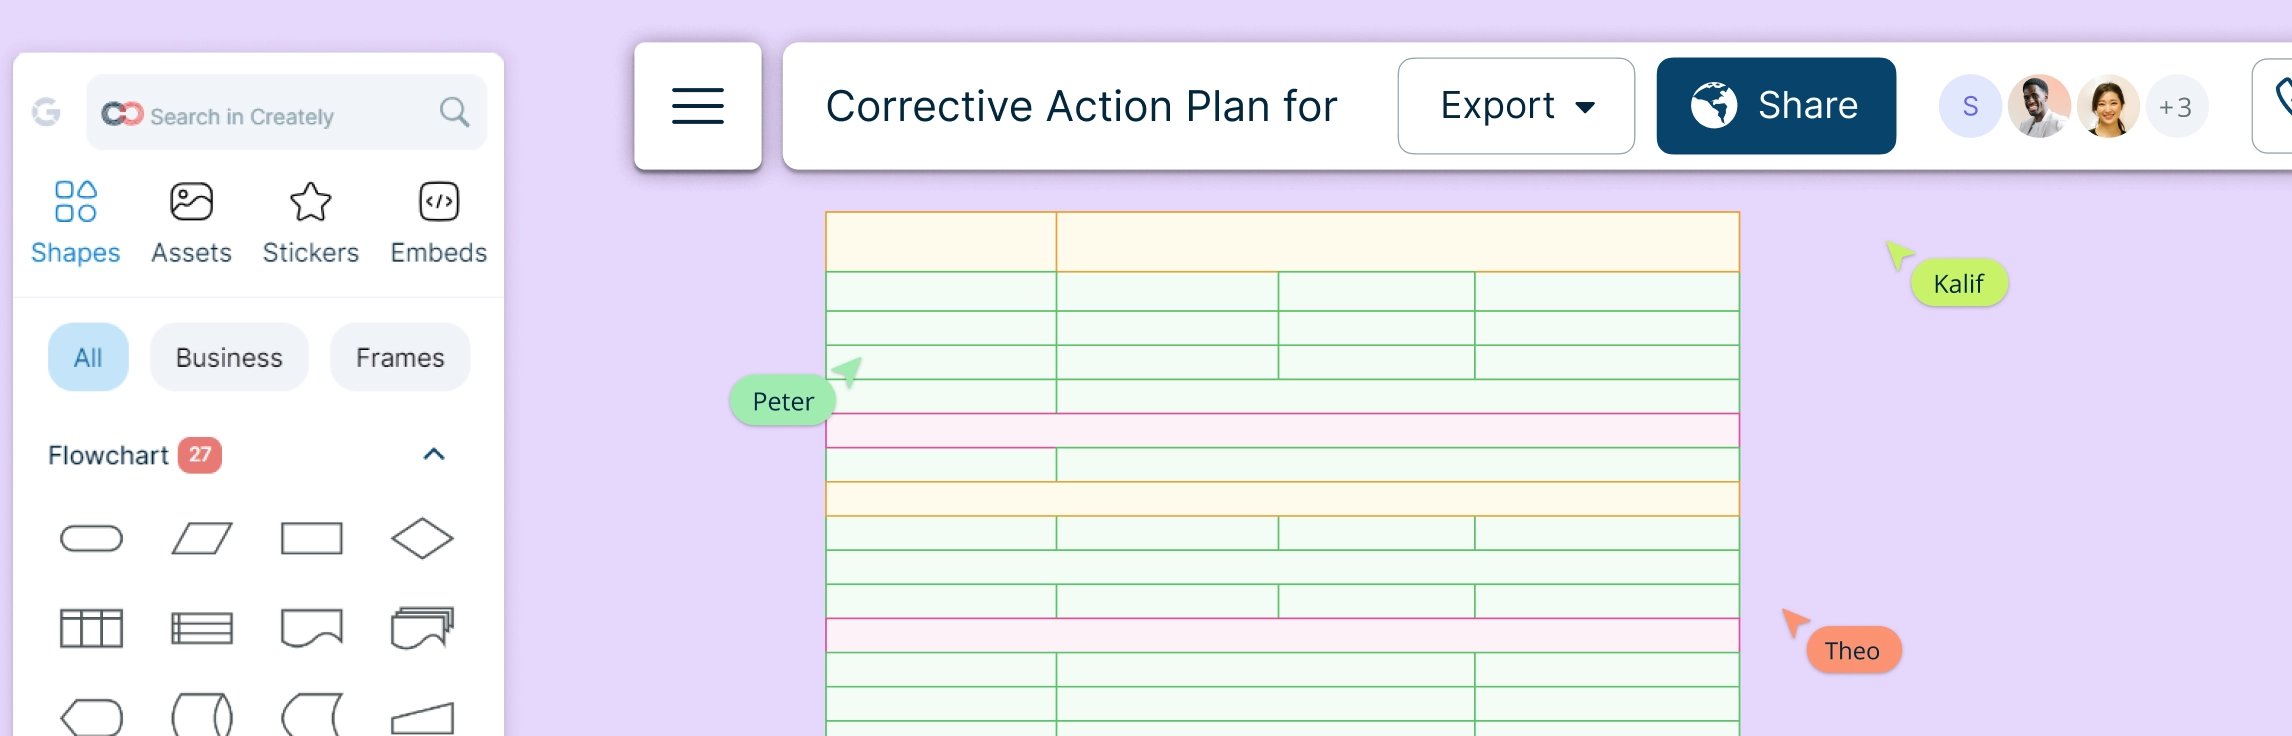
A Corrective Action Plan (CAP) is essential in quality management for addressing issues at their root and driving long-term improvements aligned with organizational goals. Commonly used in industries like manufacturing, healthcare, IT, and food safety, CAPs help meet industry standards, enhance customer satisfaction, and ensure compliance. This guide covers everything you need to know about corrective action plans—from understanding their purpose and key components to step-by-step instructions on how to develop, implement, and monitor them for sustained success.
A Corrective Action Plan (CAP) is a structured approach to identifying, addressing, and preventing recurring issues in an organization. Whether dealing with compliance violations, operational inefficiencies, or quality concerns, a well-designed CAP helps resolve problems at their root cause while improving processes and accountability. This guide provides a step-by-step approach to how to write a Corrective Action Plan to enhance efficiency, minimize risks, and drive continuous improvement.
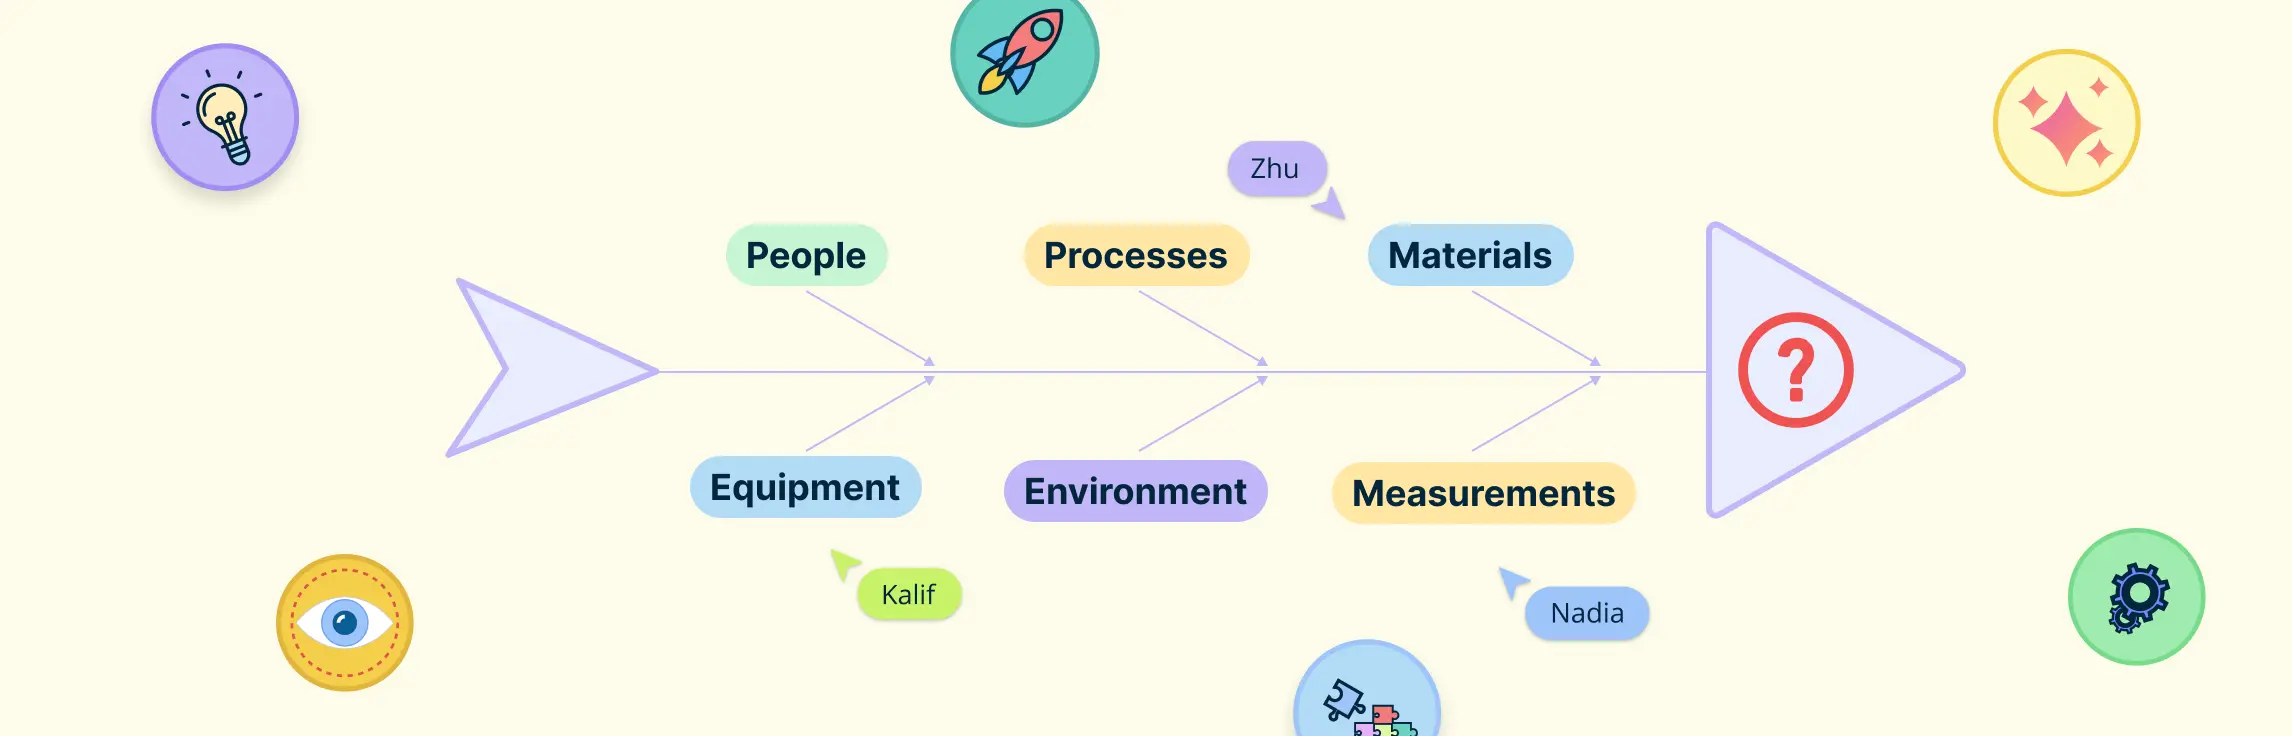
When problems arise, pinpointing the real cause can be challenging. Instead of guessing, teams need a structured way to analyze issues and find effective solutions. That’s where the right tools come in. In this guide, we’ll explore what is a fishbone diagram and how a fishbone diagram helps break down problems, uncover root causes, and improve decision-making. You’ll also find insights on its benefits, uses, and templates to help you get started right away.
Imagine a fire breaks out in your office or a severe storm forces an evacuation. Would your team know what to do? That’s where an emergency action plan (EAP) comes in. It’s a step-by-step guide that helps businesses and organizations prepare for unexpected emergencies, ensuring everyone stays safe and knows their role when disaster strikes.
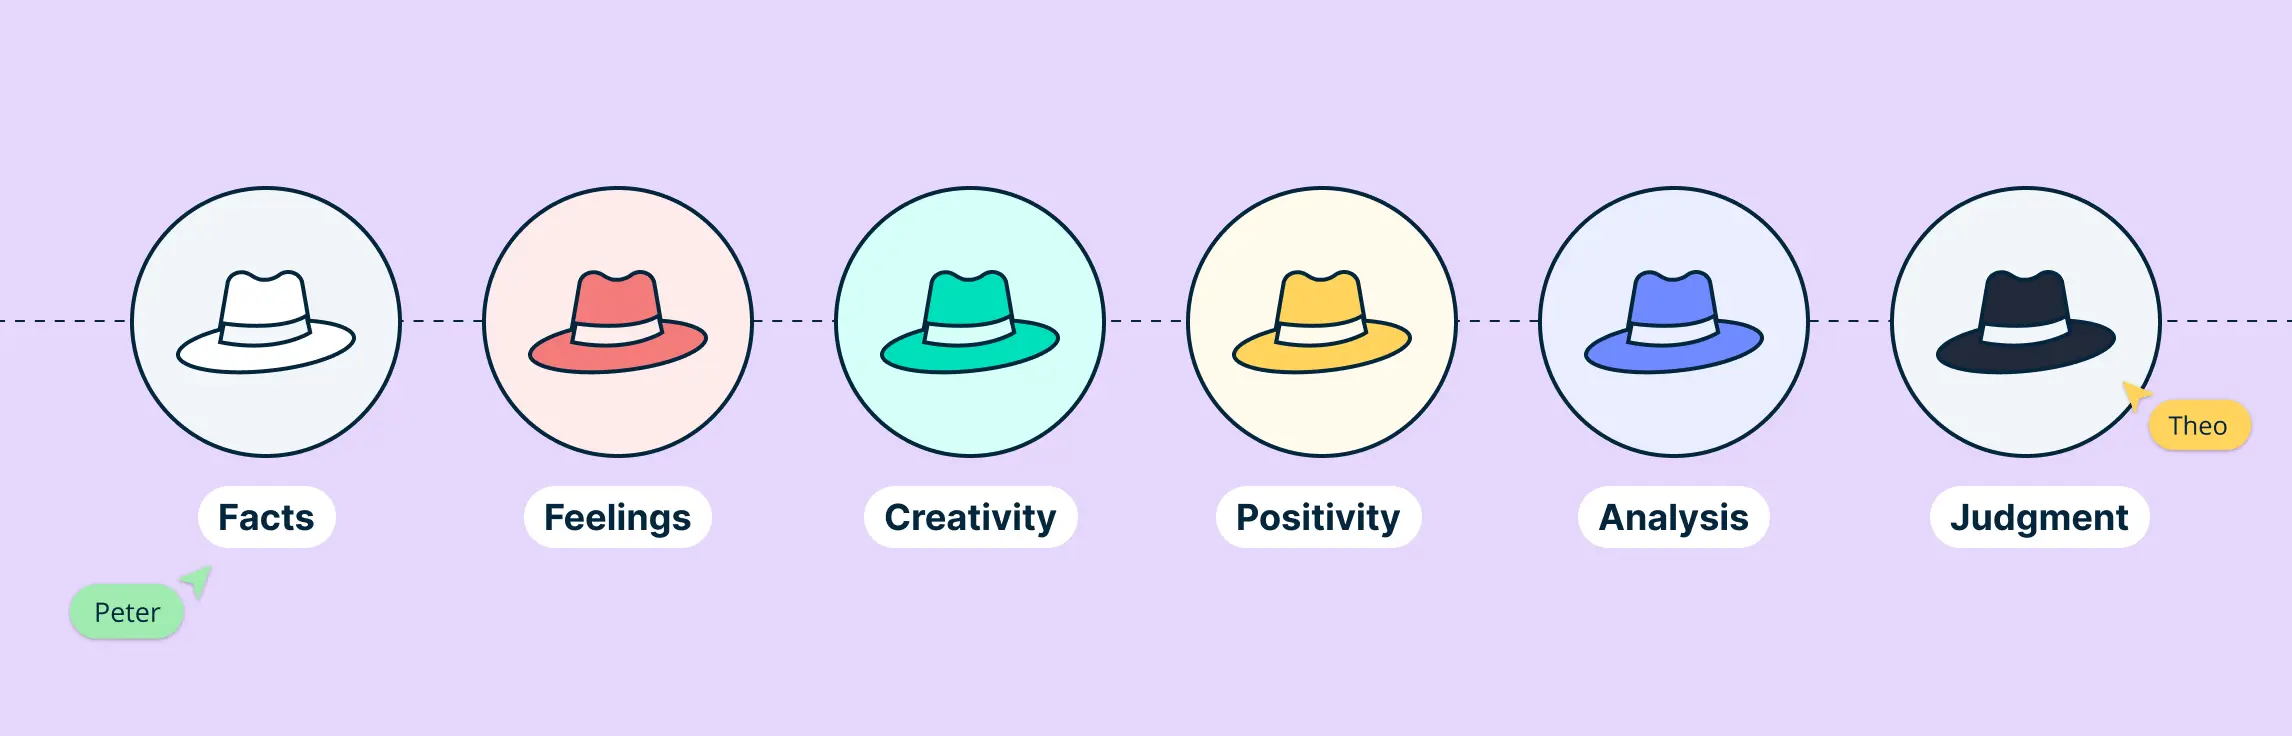
Making decisions—whether in business, education, or everyday life—can be tough. Sometimes, discussions go in circles, people talk over each other, and important ideas get lost. That’s where the Six Thinking Hats method comes in.
When making decisions as a group, it’s easy for some voices to get lost or for people to simply agree with the majority. The stepladder technique offers a way to encourage everyone’s input and create more thoughtful, well-rounded decisions. This method helps reduce groupthink by gradually adding people to the discussion one by one, ensuring that each person has a chance to share their unique perspective before hearing others’ thoughts.
When a problem arises, finding its root cause can feel like searching for a needle in a haystack. That’s where a fishbone diagram (also called an Ishikawa diagram or cause-and-effect diagram) comes in handy. It’s a simple yet powerful tool that helps teams break down problems into different contributing factors, making it easier to pinpoint the real issue.
In today’s fast-paced digital world, organizations generate vast amounts of knowledge daily. However, without a structured approach to managing this knowledge, valuable insights can be lost, leading to inefficiencies and missed opportunities. Knowledge management is the systematic process of capturing, organizing, sharing, and utilizing information to enhance decision-making, innovation, and overall business performance.
Ever feel overwhelmed by all the things you need to get done, with no clear path forward? That’s where an action plan comes in. What is an action plan? It is your roadmap to success. It breaks down your goals into simple, manageable steps so you know exactly what to do and when to do it.
In today’s rapidly evolving business landscape, effective knowledge management (KM) is crucial for driving innovation, improving efficiency, and enhancing decision-making. At the core of a successful KM strategy is the understanding that not all knowledge is the same. Knowledge within an organization can take many forms, from structured data and documented processes to personal expertise and intuitive insights. To harness the full potential of knowledge, organizations must recognize and manage different types of knowledge effectively.
The Knowledge Management process involves capturing, organizing, sharing, and utilizing knowledge within an organization to enhance decision-making, innovation, and efficiency. An effective KM process eliminates silos, reduces redundancies, and fosters collaboration, driving productivity and a culture of continuous learning. A visual collaboration tool like Creately simplifies KM by providing intuitive visual solutions, such as flowcharts and knowledge maps, to capture and share information seamlessly. By making knowledge accessible and actionable, Creately helps organizations transform scattered insights into a cohesive, collaborative resource for improved performance.
A brace map is a powerful visual tool that helps break down complex concepts into smaller, manageable parts. Whether you’re in education, business, or problem-solving, brace maps allow you to clearly understand relationships by visualizing components in a structured way. In this guide, we’ll dive into what a brace map is, how to create one, and how you can use brace maps to organize your thoughts and ideas. Let’s explore how this tool can enhance your workflow with Creately’s versatile platform.
Often, when we make decisions, we need to compare between two options. Visualizing the similarities and differences of the two options can be a better way to make a decision. A double bubble map is a powerful visual tool designed to compare and contrast two ideas, concepts, or items in a structured and engaging way. This versatile tool enhances comprehension, critical thinking, and collaboration. Unlike traditional charts or lists, double bubble maps offer a dynamic framework to organize similarities and differences clearly. In this guide, we’ll explore what a double bubble map is, how it differs from tools like Venn diagrams, practical applications, and step-by-step instructions for creating one using tools like Creately. Read on to discover how this versatile tool can simplify complex topics, enhance decision-making, and become a go-to resource for visualizing comparisons.
Knowledge management (KM) is a systematic approach to capturing, organizing, sharing, and analyzing an organization’s knowledge to enhance its overall efficiency and effectiveness. It involves leveraging organizational knowledge as a strategic asset to improve decision-making, collaboration, and innovation. In this comprehensive guide, we delve into the definition, process, examples, strategies, and best practices associated with knowledge management.
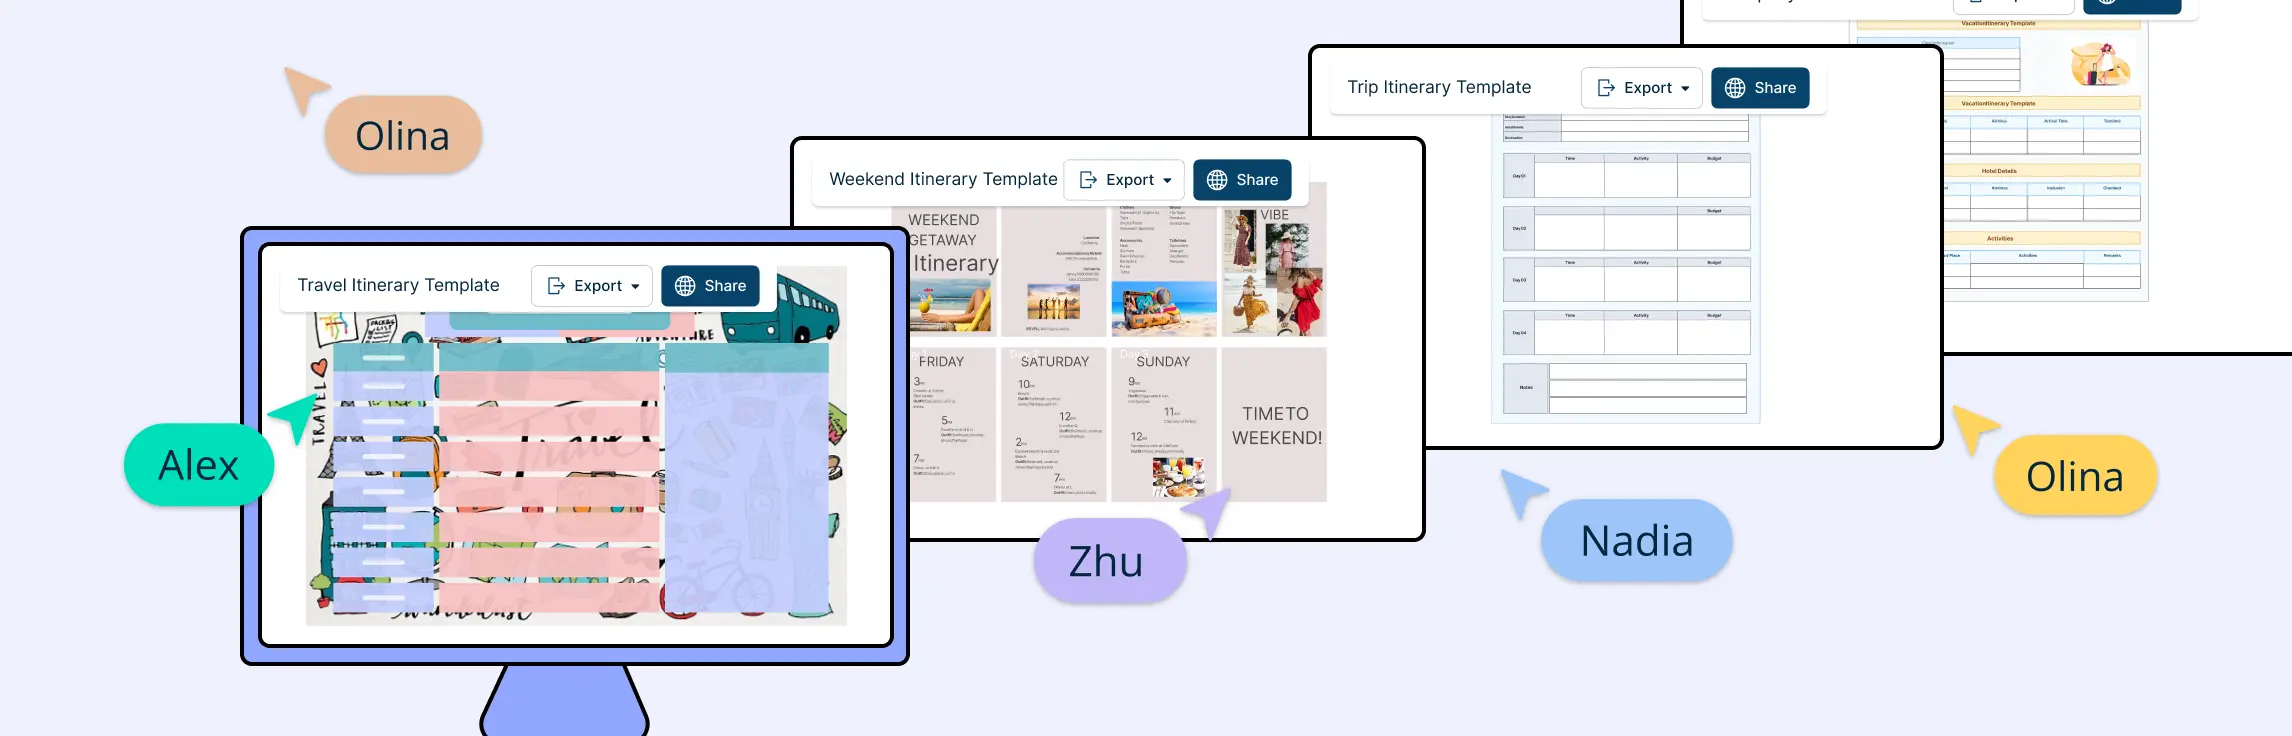
Planning a trip can be exciting, but it can also get overwhelming without a clear schedule. That’s where itinerary templates come to the rescue! These handy tools make organizing your travel plans a breeze, giving you a stress-free way to ensure nothing falls through the cracks.
Have you ever felt overwhelmed by information? Or struggled to connect the dots between what you know and what you need to do? That’s where knowledge mapping comes in. Think of it as a way to visually organize your ideas, information, and insights into one easy-to-follow map.
Studying effectively is a challenge many students face, especially when dealing with large volumes of information. A mind map for studying offers a powerful solution by turning complex concepts into visually organized diagrams. This technique not only enhances understanding but also improves memory retention and encourages creative thinking. Whether you’re preparing for exams, brainstorming essay ideas, or grasping intricate theories, mind mapping can transform your study routine. In this guide, we’ll explore what a mind map for studying is, its benefits, and how to create one step-by-step. Plus, you’ll discover practical templates and tools to integrate mind mapping into your academic journey.
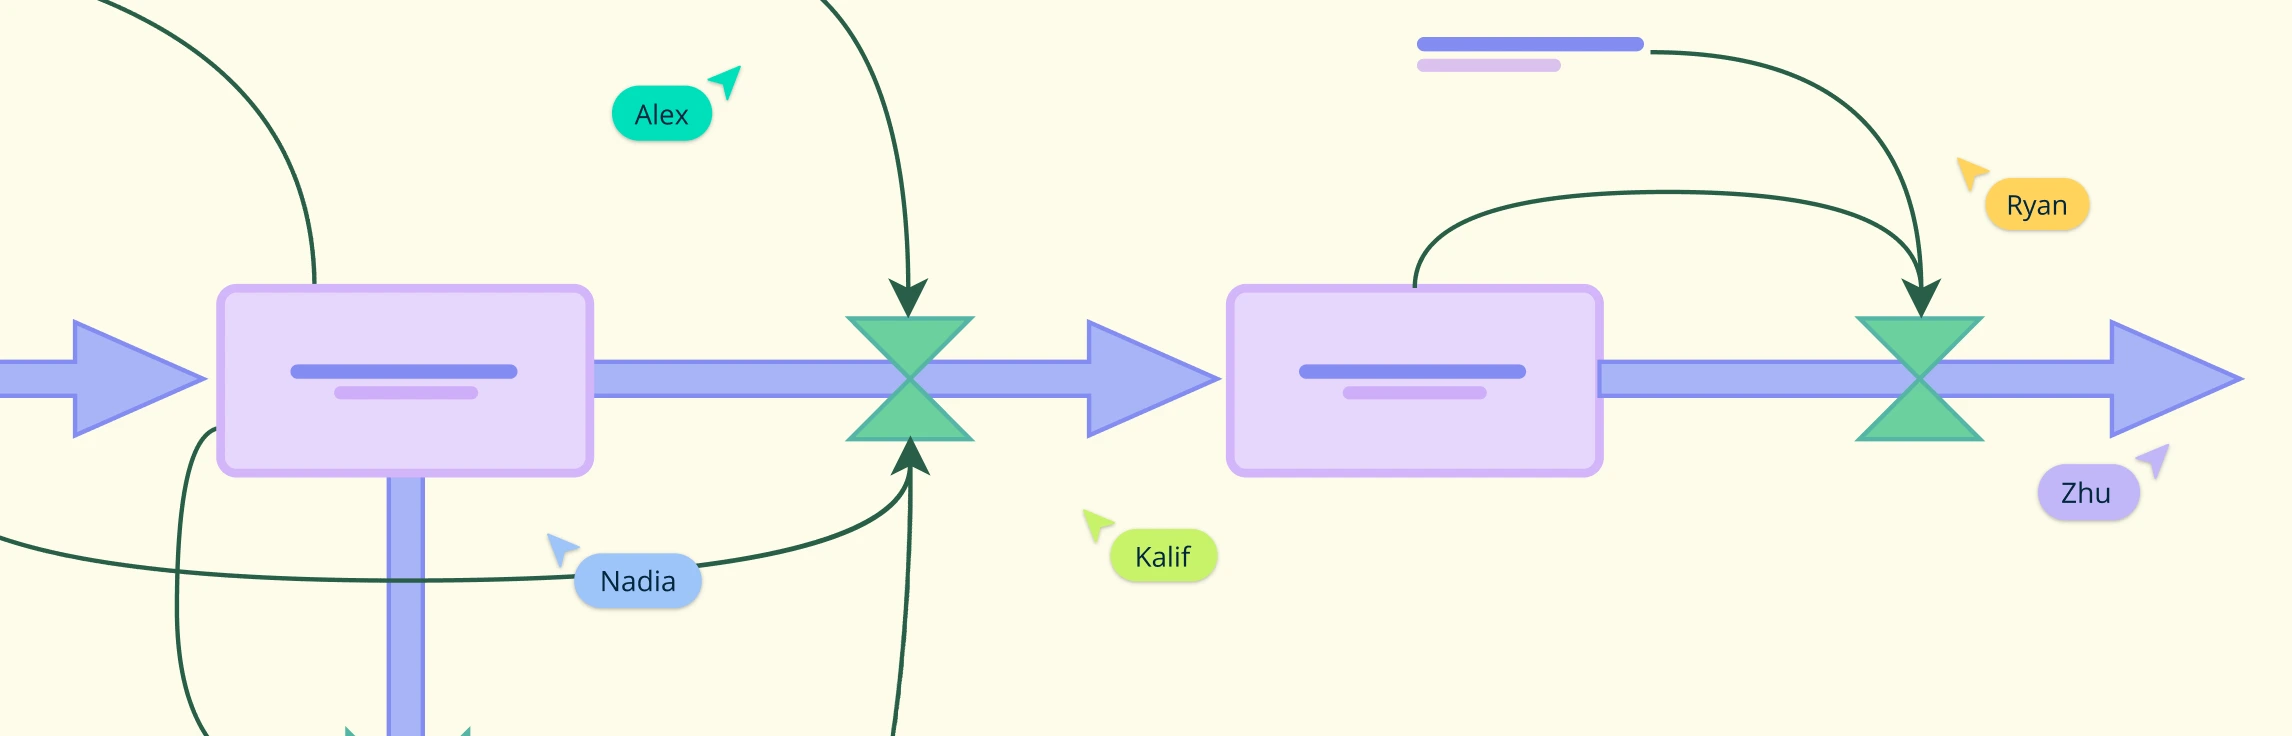
The stock and flow diagram is a powerful tool used in system dynamics to visualize and analyze complex systems. These diagrams help us understand how different elements within a system interact over time, making them invaluable in various fields, including business, economics, and environmental science. This guide will delve into the intricacies of stock and flow diagrams, their applications, how to create them, and provide templates to assist you in your modeling endeavors.
A family vision board is a powerful way to bring everyone together to focus on shared goals and dreams. It’s a visual tool that helps your family set intentions for the future, whether it’s planning a big vacation, saving for a home, or improving your health and well-being. By creating a vision board, you can see your goals every day, keeping everyone motivated and on the same page.
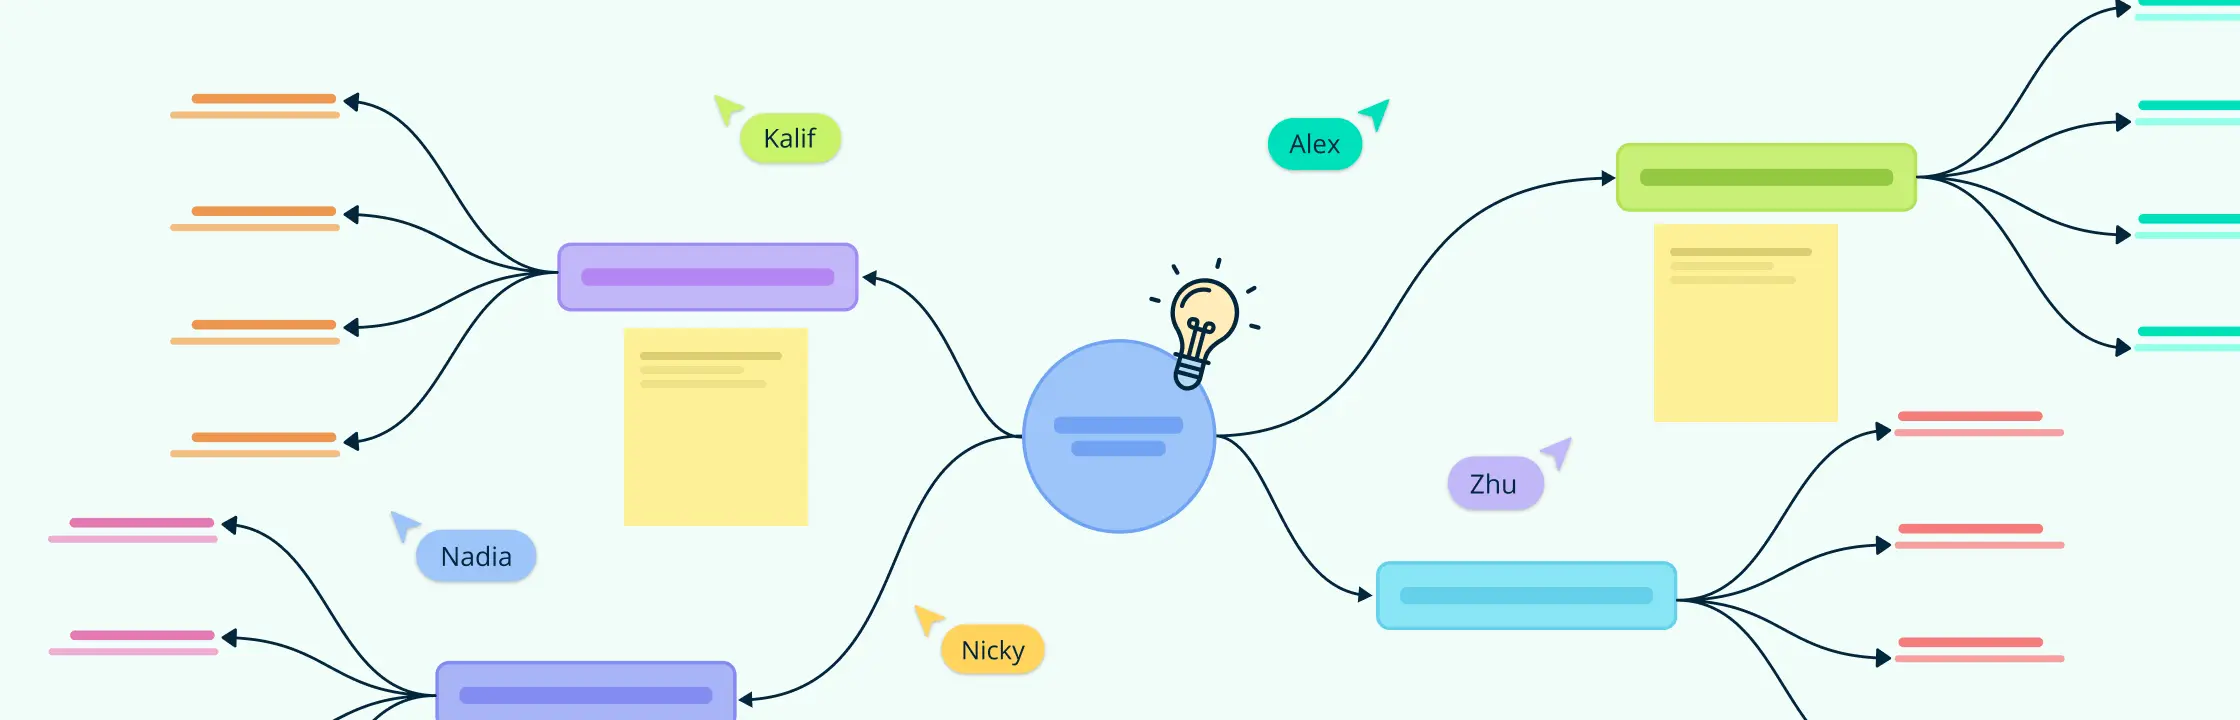
Mind mapping is a creative way to take notes that helps you visualize and organize information clearly and effectively. It’s different from traditional note-taking because it makes use of branches and visuals, making it easier to understand and remember what you’ve learned. This guide will show you how to use mind maps for note-taking, and provide practical steps, templates, and useful tips to get started.
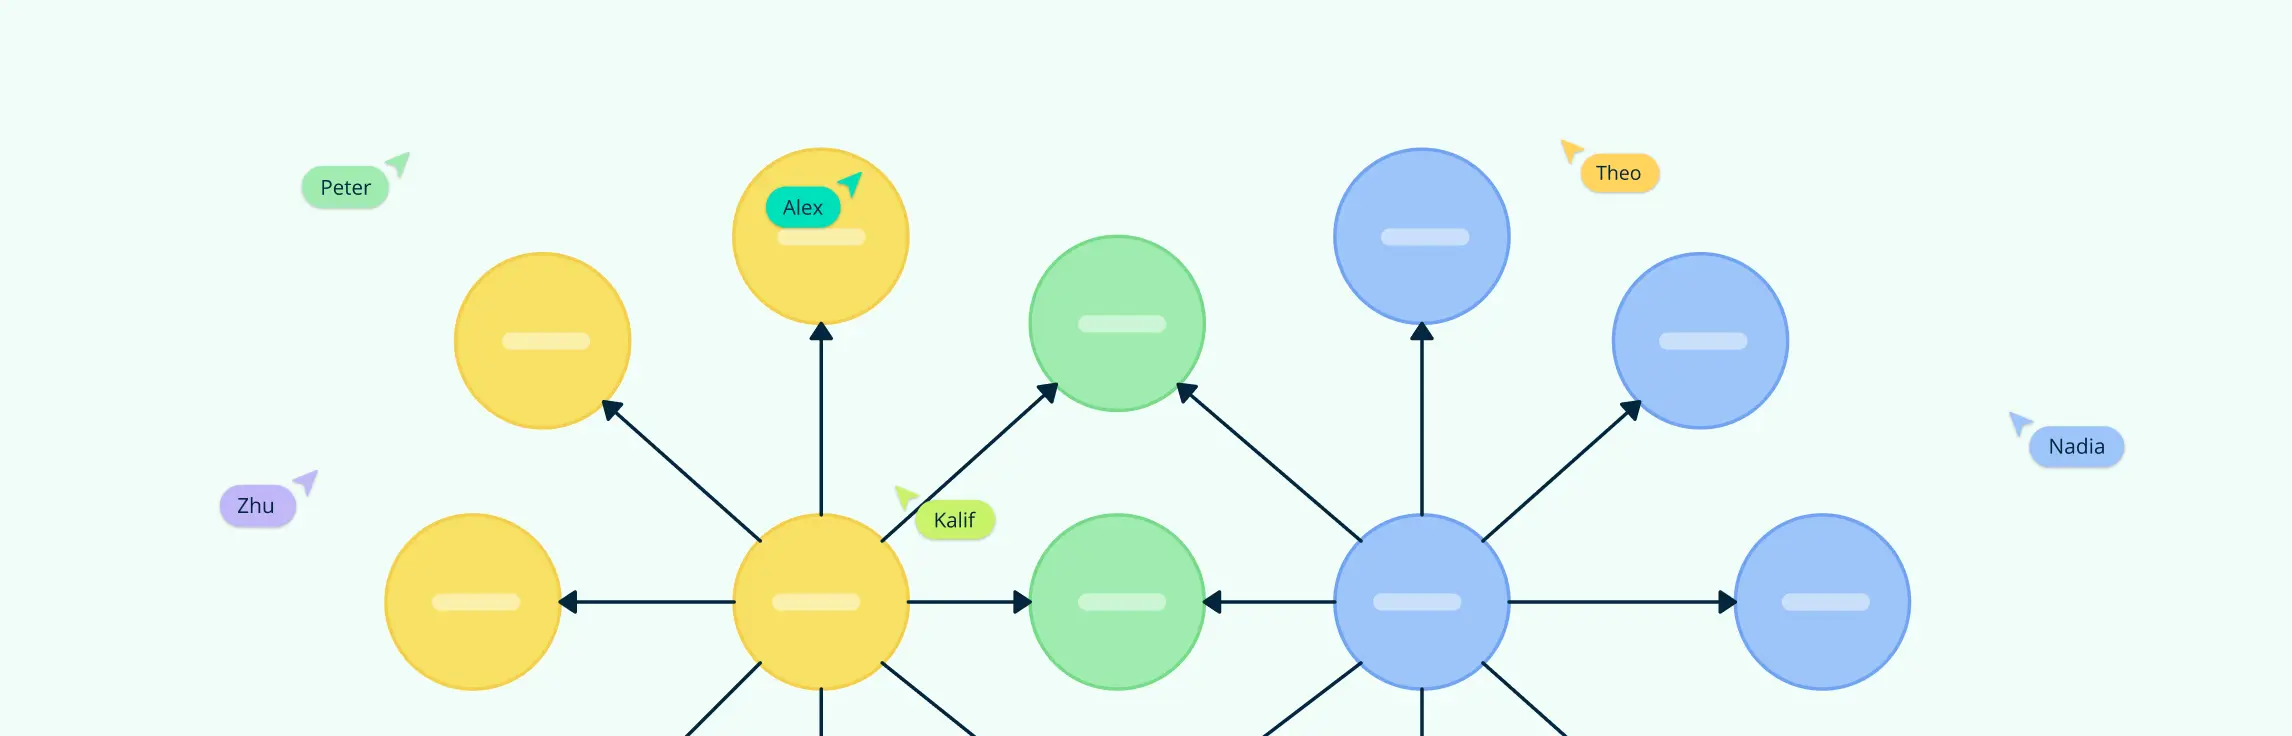
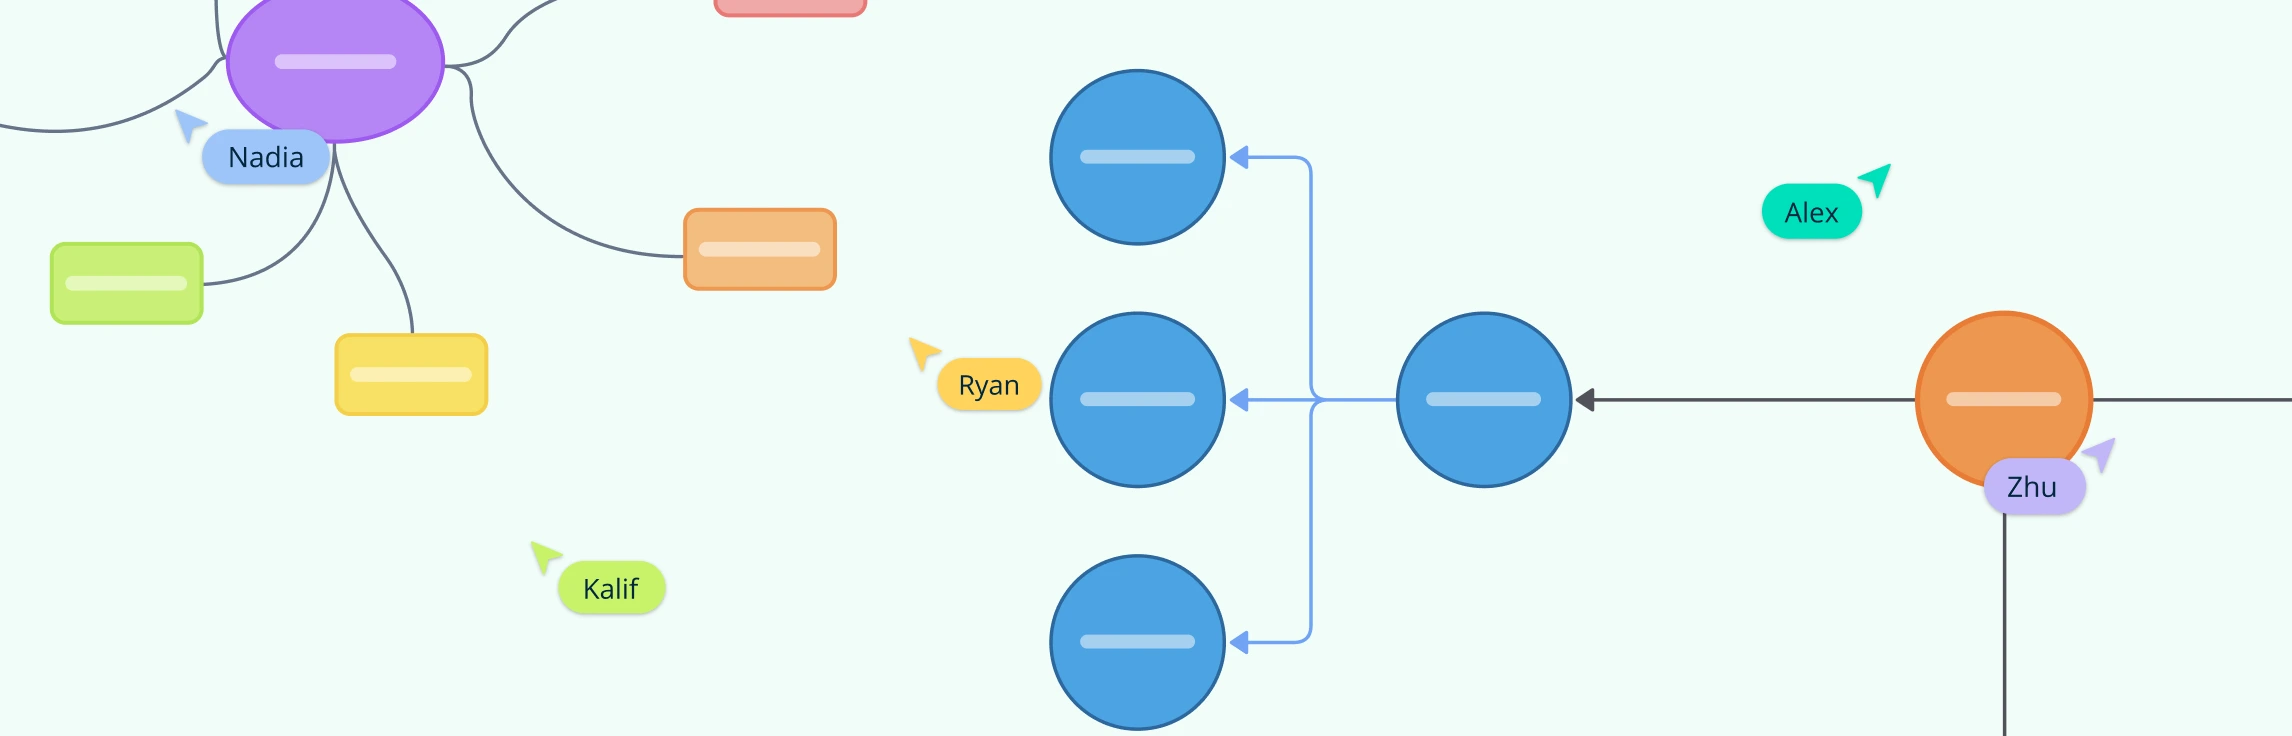
Mind mapping is a powerful tool that helps you organize your thoughts, solve problems, and boost creativity. Whether you’re brainstorming ideas, planning a project, or studying a complex topic, mind mapping makes it easier to break down information and see connections between ideas. In this guide, we’ll explore different mind mapping techniques that can help you think more clearly and work more efficiently. You’ll learn how to structure your thoughts visually, making complex tasks simpler and improving your productivity. By the end, you’ll be able to apply these techniques in various situations, from personal projects to professional work.
If you’ve already read our previous guide on what a mind map is, you know how useful this tool can be for organizing thoughts and ideas. In this guide, we’ll walk you through the straightforward steps on how to make a mind map. Whether you’re planning a project, brainstorming ideas, or studying for an exam, this guide will help you use mind maps effectively. Let’s get started!
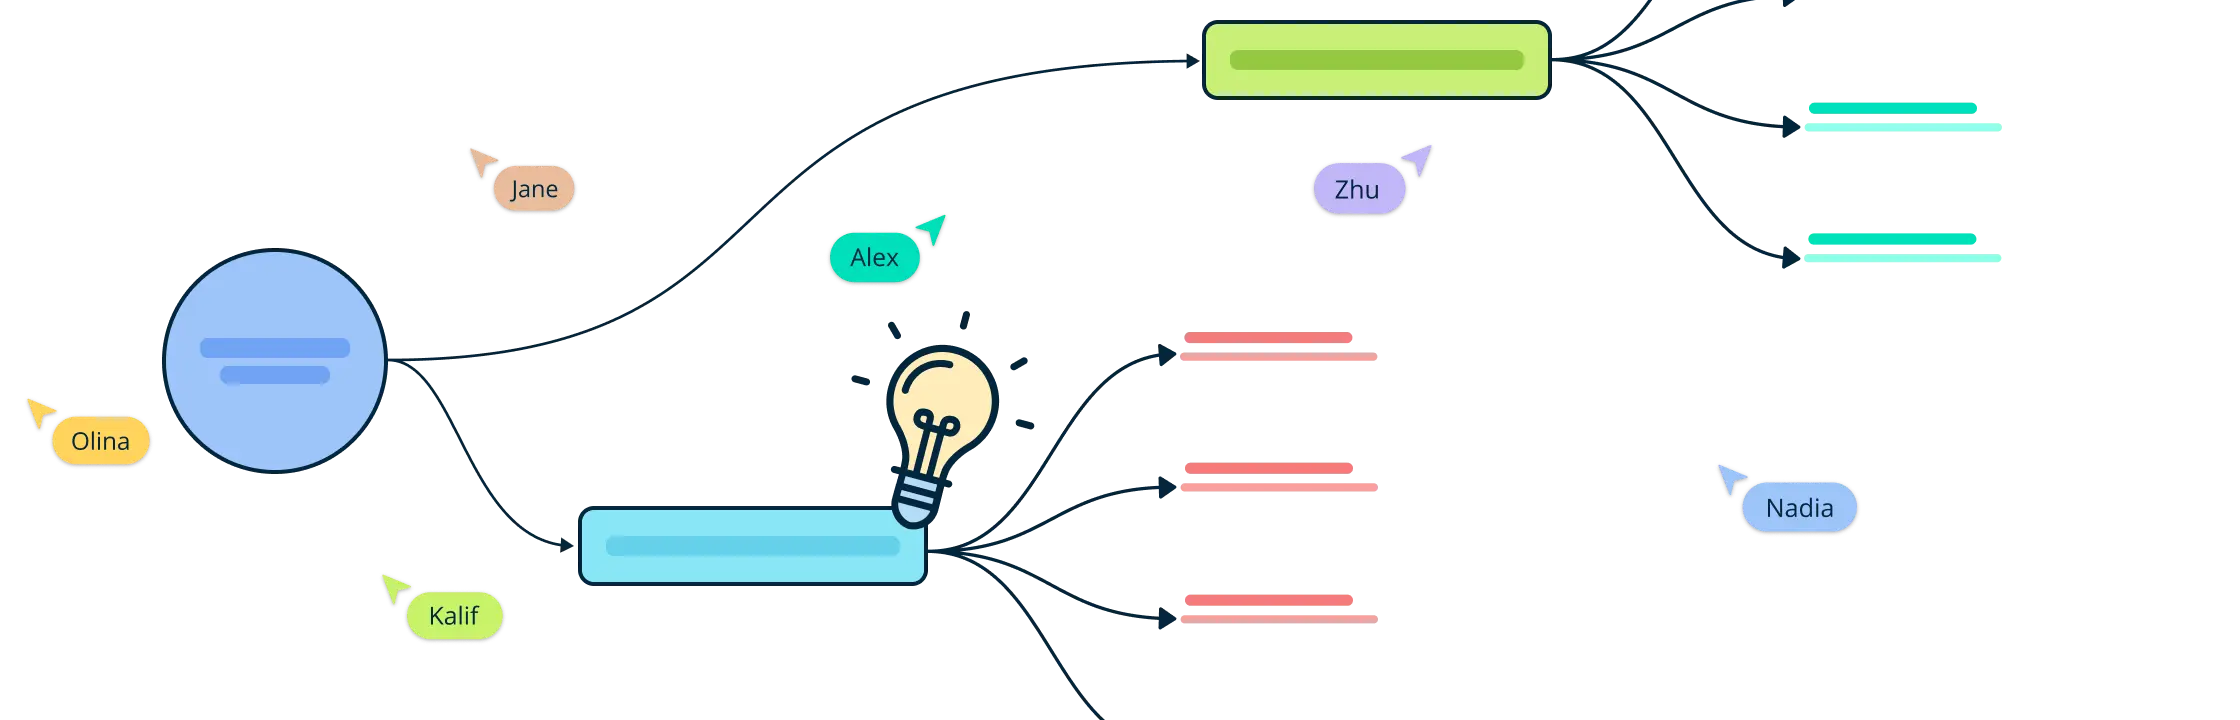
Mind maps are a simple yet powerful way to organize thoughts and ideas visually. They help you brainstorm, plan, and problem-solve by mapping out information around a central theme. Whether you’re a student, professional, or creative, mind maps make complex topics easier to understand and remember. This guide explores what mind maps are, their history, key features, benefits, and practical uses.
How to Create a Design Board Picture this: You’re standing in an empty room with ideas on how to design it but unsure how to bring them to life. This is where the design board can help. Whether you’re a seasoned interior designer or a DIY enthusiast, design boards are effective tools that can help you bring your vision to life.
A vision board is a powerful tool for turning your dreams into reality. By gathering images, quotes, and reminders, you keep your goals in sight and stay motivated. In this guide, you’ll find 40 unique vision board ideas to inspire and help you achieve your dreams. From travel and career goals to personal wellness and creative projects, these ideas will help you create a vision board that motivates and guides you on your journey. Let’s explore how to bring your aspirations to life with these simple and effective concepts.
A vision board is a powerful tool that helps you visualize your goals and dreams by creating a visual representation of them. When it comes to finances, a money vision board can be an effective way to focus your efforts and keep your financial goals in sight. In this guide, we’ll walk you through the steps to create a money vision board that will help you achieve your financial aspirations.
A digital vision board is a visual representation of your goals, dreams, and aspirations, created using digital tools. Digital vision boards offer a more flexible and dynamic way to visualize your future. In this blog post, we dive into how.
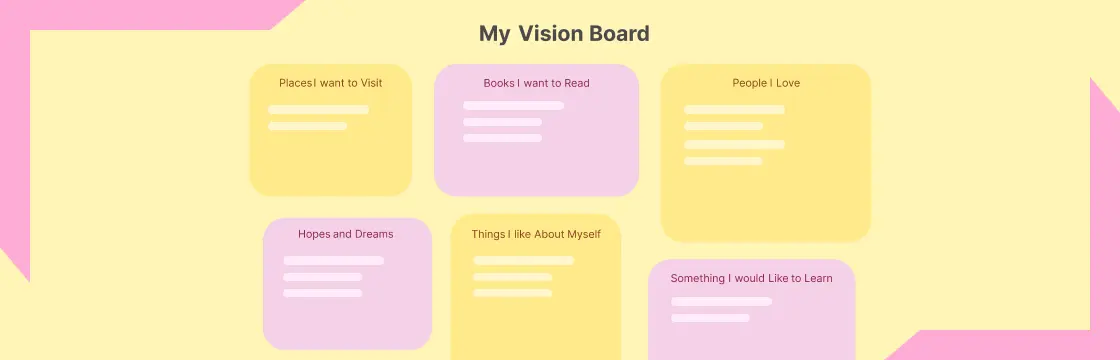
What is a Vision Board? A vision is a collage of images, words, and other visual representations that embody your goals and ambitions. The purpose of a vision board is to help clarify, concentrate, and maintain focus on specific life goals. By placing visual reminders of your aspirations in a dedicated space, you can continually inspire and motivate yourself to strive towards achieving those goals.
A vision board is more than just a collage of pretty pictures; it’s a transformative tool that can help you visualize your dreams, manifest your desires, and ultimately create the life you’ve always wanted. In this comprehensive blog post, we’ll take you step-by-step through the process of creating a vision board, from understanding what it is and how it works to practical tips for maximizing its effectiveness. Whether you’re a seasoned manifestor or a skeptic dipping your toes into the world of visualization, this guide will empower you to unlock your full potential and turn your dreams into reality.
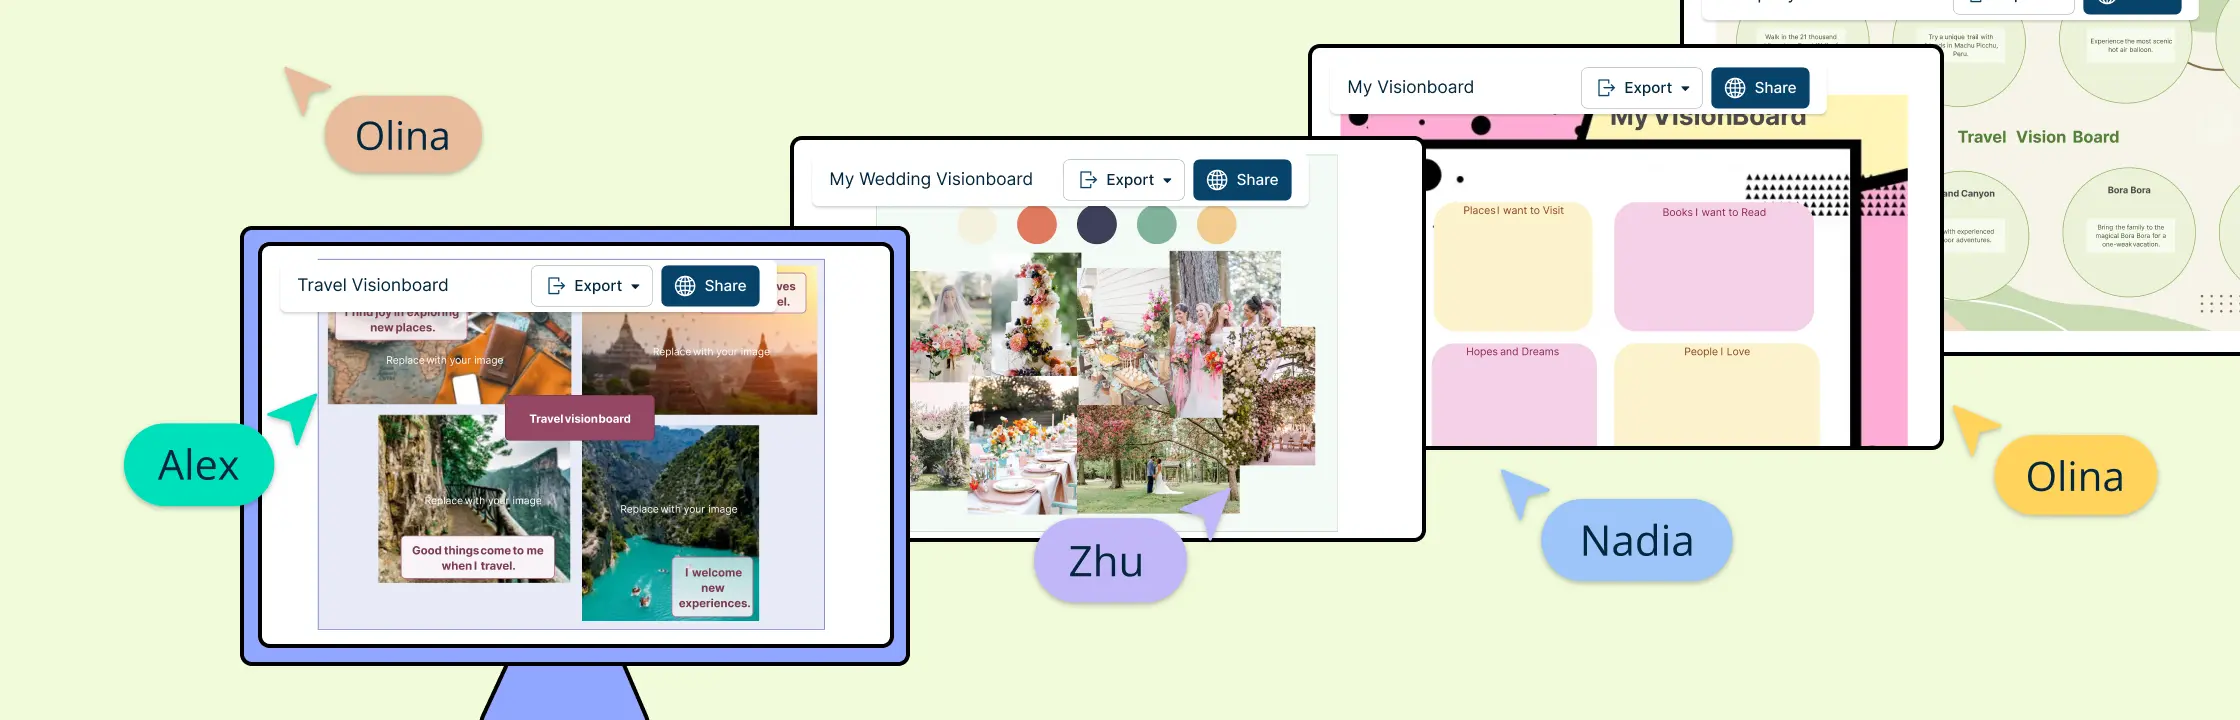
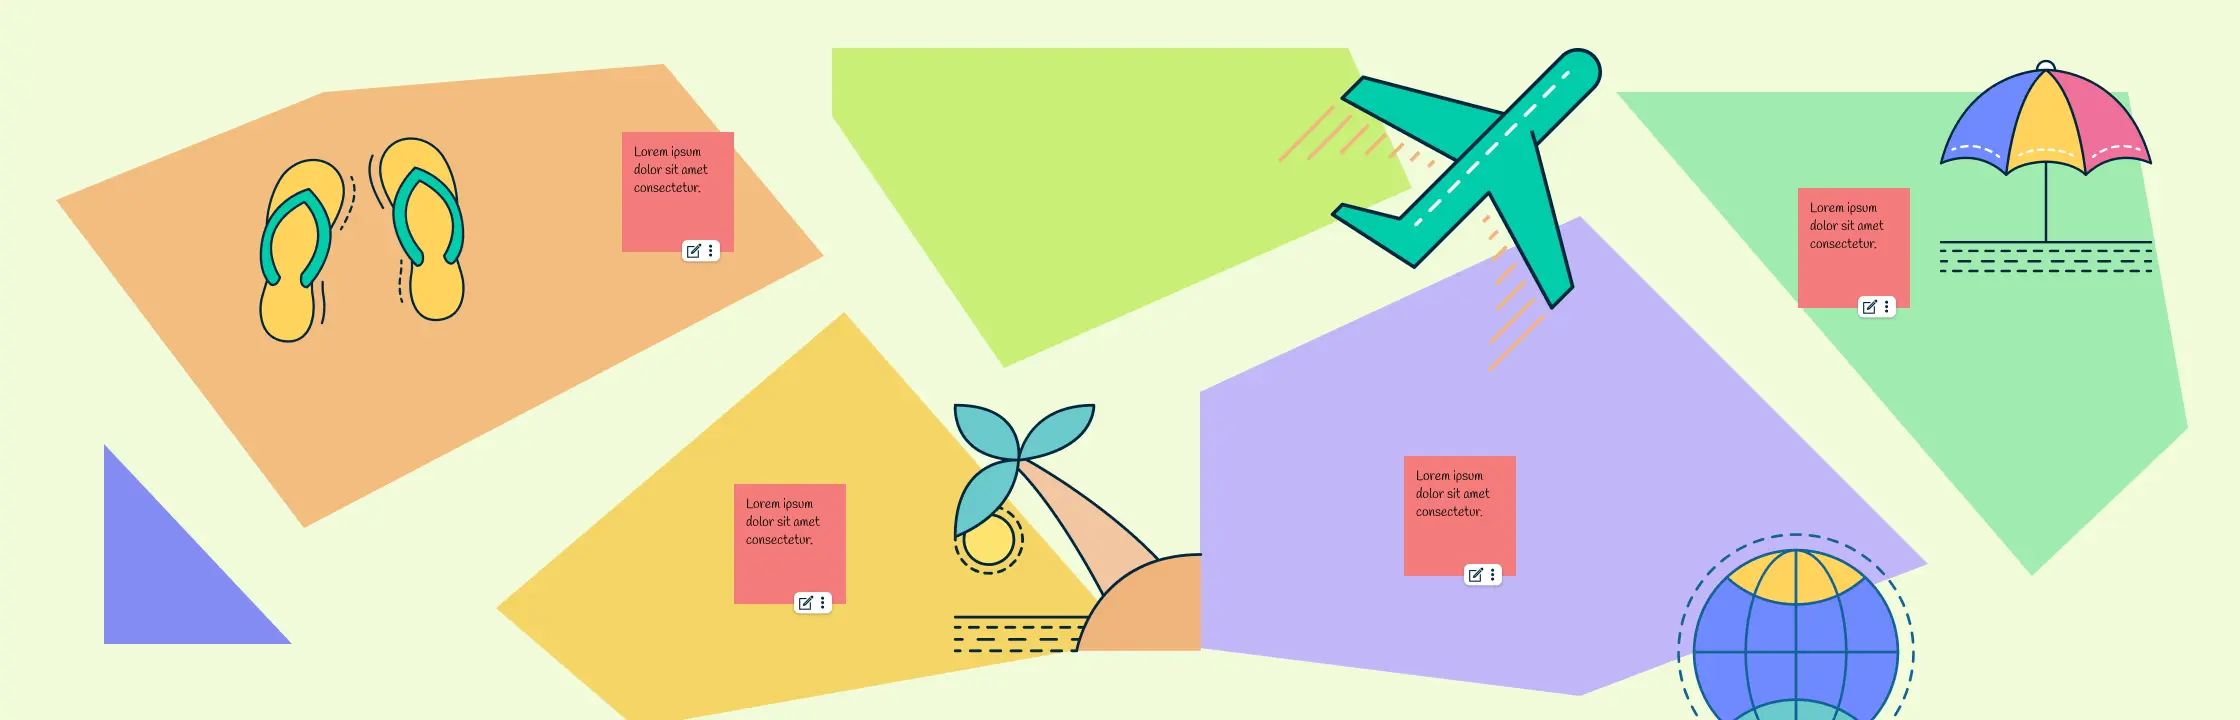
Do you ever find yourself daydreaming about exploring the bustling streets of Tokyo, lounging on the pristine beaches of Bali, or hiking through the majestic mountains of Patagonia? If so, a travel vision board might be just what you need to turn those dreams into reality. A travel vision board is a powerful tool that helps you visualize your travel goals, stay motivated, and ultimately manifest your dream destinations. In this blog post, we’ll guide you through the process of creating your own travel vision board and share tips on how to make it work for you.
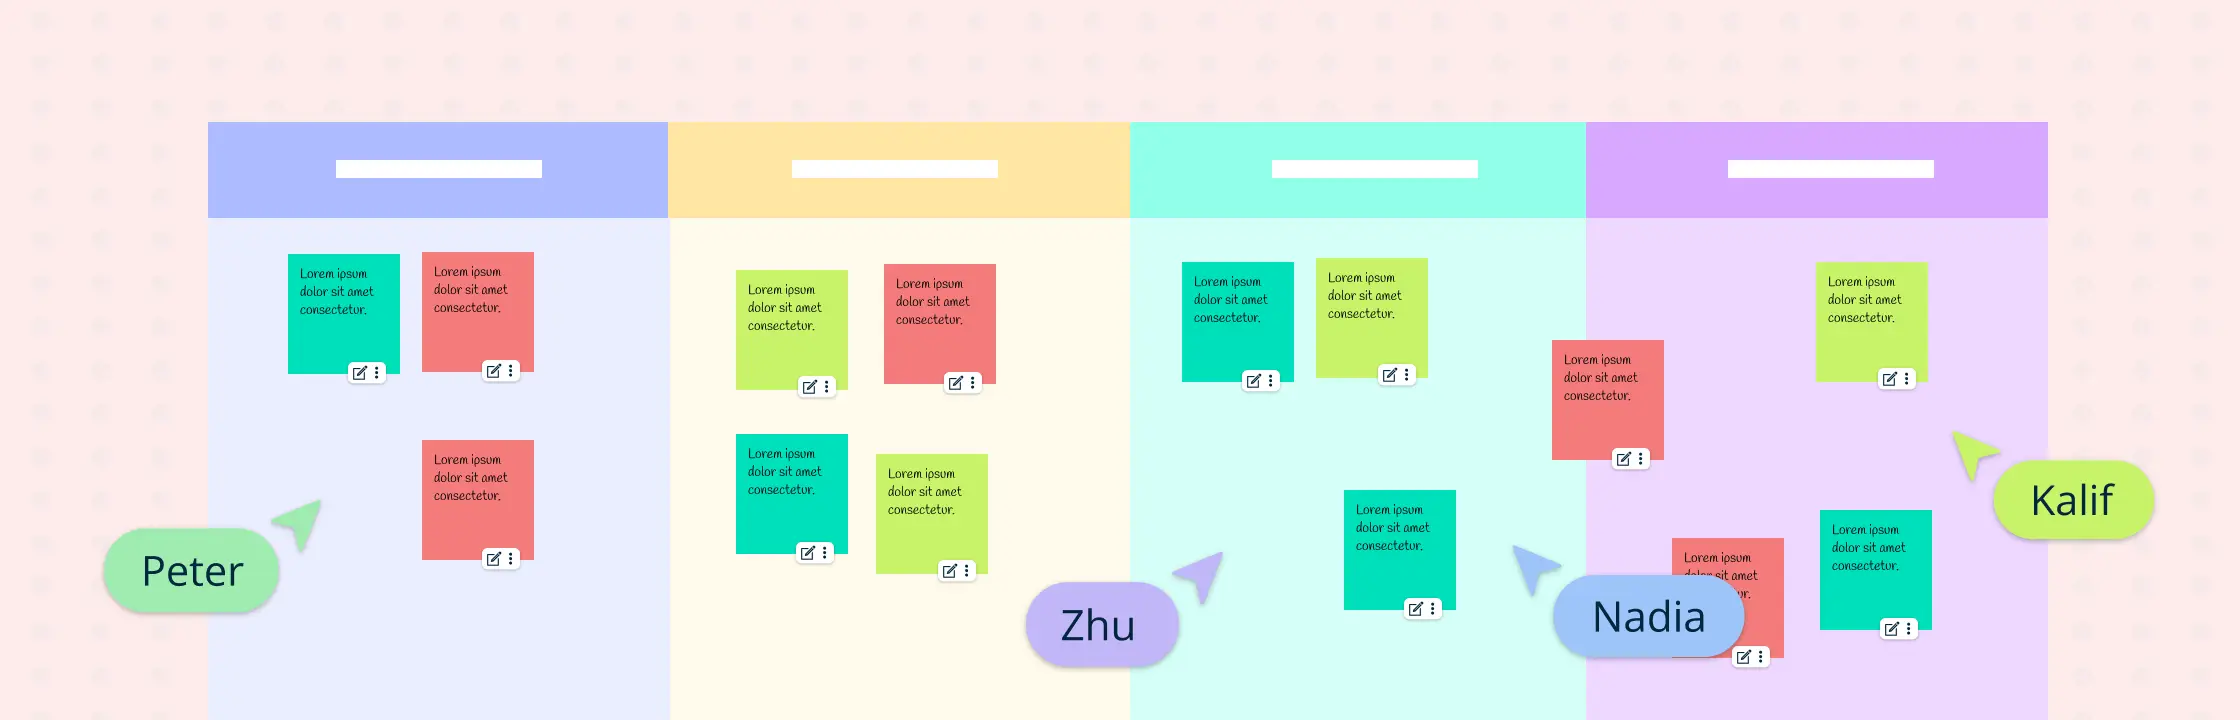
In the fast-changing world of business, it’s crucial to turn your big dreams into practical plans. But with so much going on, it’s easy to lose sight of the bigger picture. That’s where the business vision board comes in. It’s a simple tool that helps you stay focused on your long-term goals and keeps everyone on the same page. This guide is here to help entrepreneurs and business leaders make the most of their vision boards, offering straightforward tips and advice along with business vision board templates to turn dreams into reality.
In a world where distractions abound and goals can sometimes feel out of reach, empowering our children with tools to visualize and achieve their dreams is more important than ever. One such tool that holds immense power is the humble vision board. In this post, we’ll delve into the wonders of the vision board for kids and how it can transform the way our little ones perceive and pursue their aspirations.
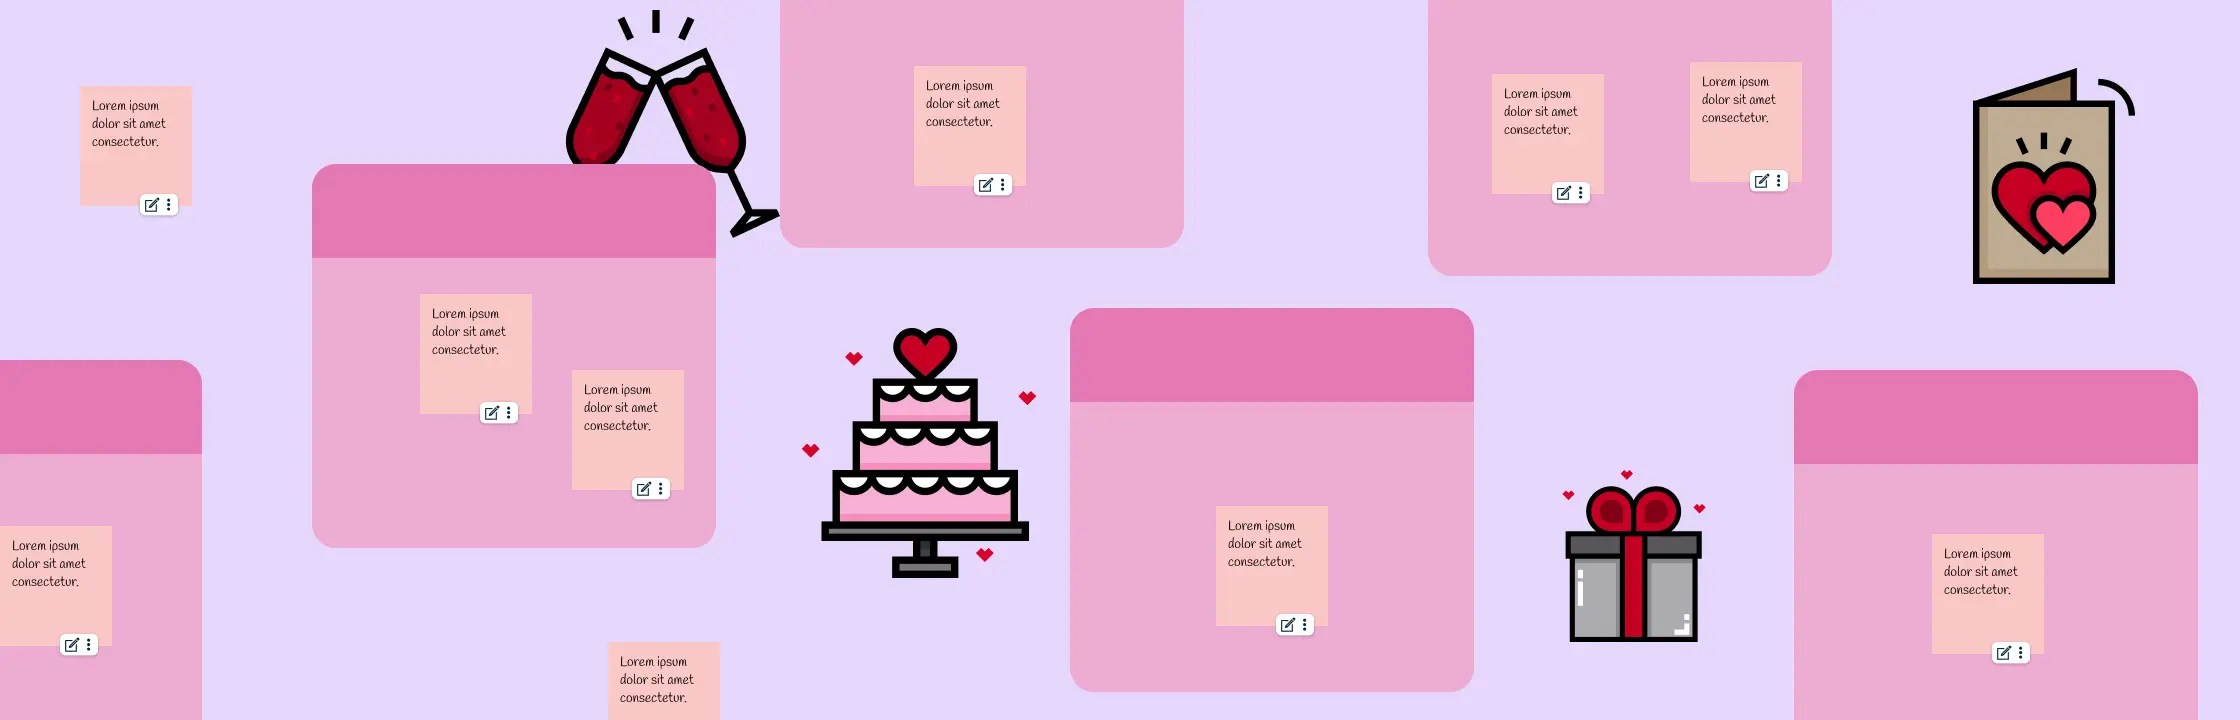
Planning a wedding can feel overwhelming, but creating a wedding vision board can help turn your dream day into reality. A wedding vision board is a visual tool that helps you clarify and communicate your wedding style, preferences, and ideas. It serves as a roadmap that guides you through the planning process, making decisions easier and keeping you focused on your goals. In this post, we’ll walk you through everything you need to know to create your own wedding vision board along with wedding vision board templates to get started.
In the quest to organize our thoughts and improve understanding, visual thinking tools like concept maps and mind maps have become invaluable. These tools help us to structure information visually, making complex ideas easier to grasp and retain. In this blog post, we’ll explore the differences between concept map vs mind map, and discuss their unique uses to help you decide which tool is right for your needs.
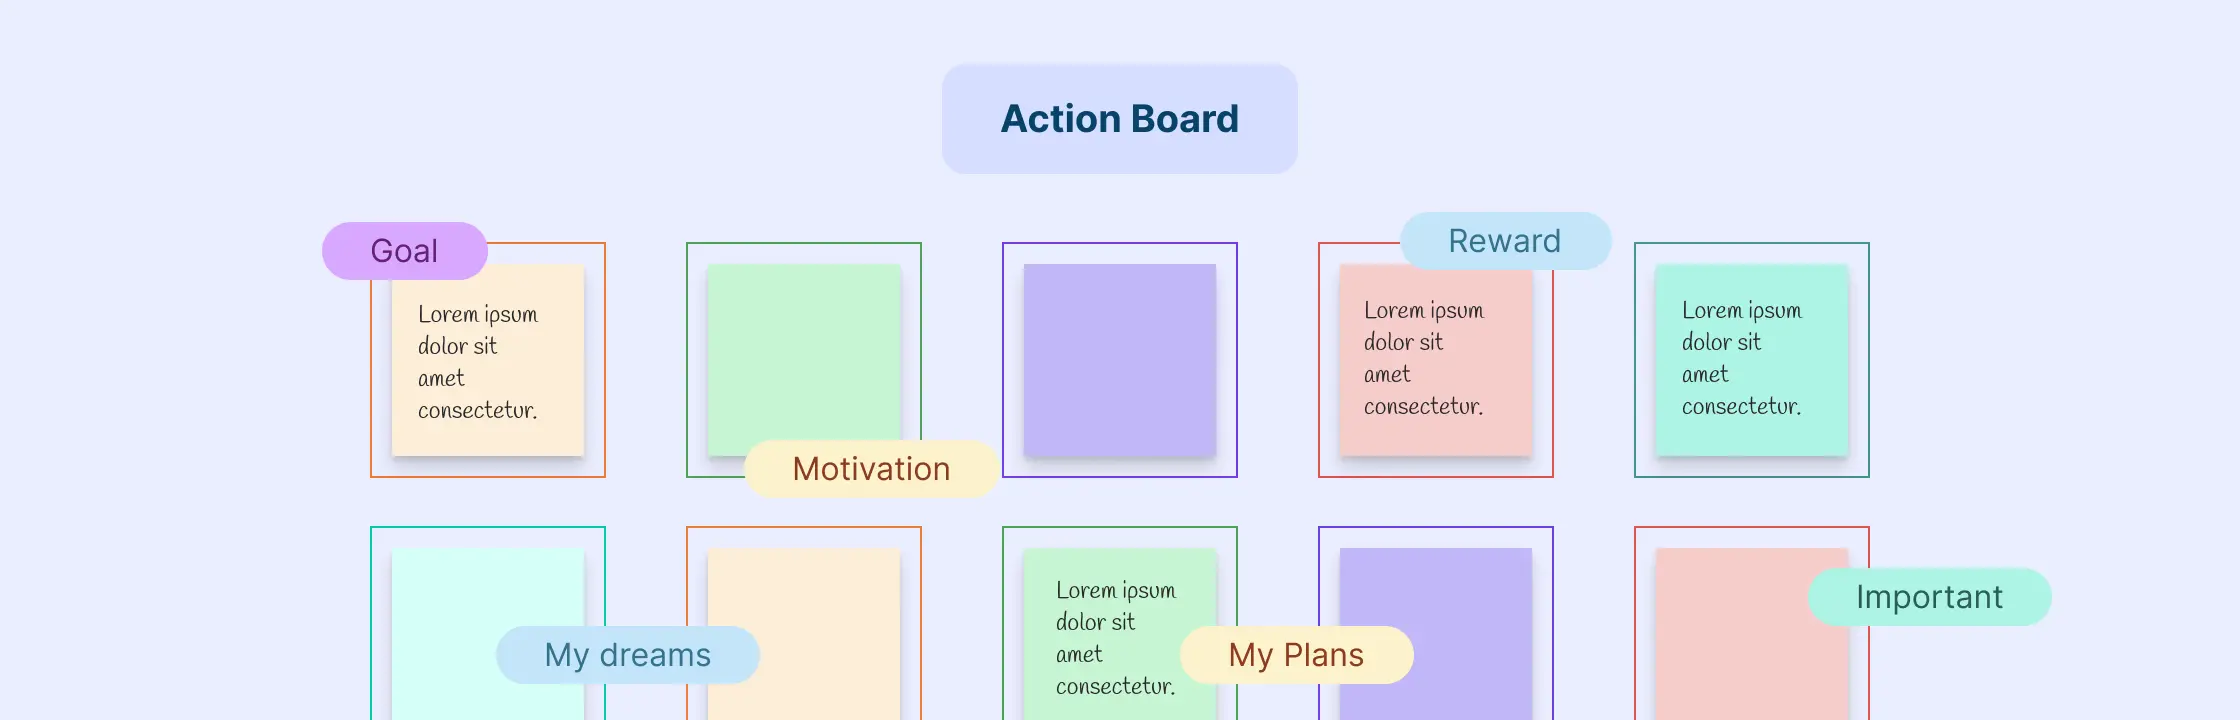
Creating an action board can be a transformative experience. It’s a powerful tool that helps you visualize your goals, stay motivated, and track your progress. Whether you’re looking to advance your career, improve your health, or achieve personal milestones, an action board can guide you toward success. In this blog post, we’ll walk you through the steps to creating an effective action board.
Planning your dream wedding involves bringing together countless ideas, inspirations, and visions into one cohesive and beautiful event. Amidst the whirlwind of decisions, there’s one tool that can help you streamline your thoughts and visualize your perfect day: the wedding mood board. In this guide, we will walk you through the steps to create the perfect mood board for your wedding to inspire your big day.
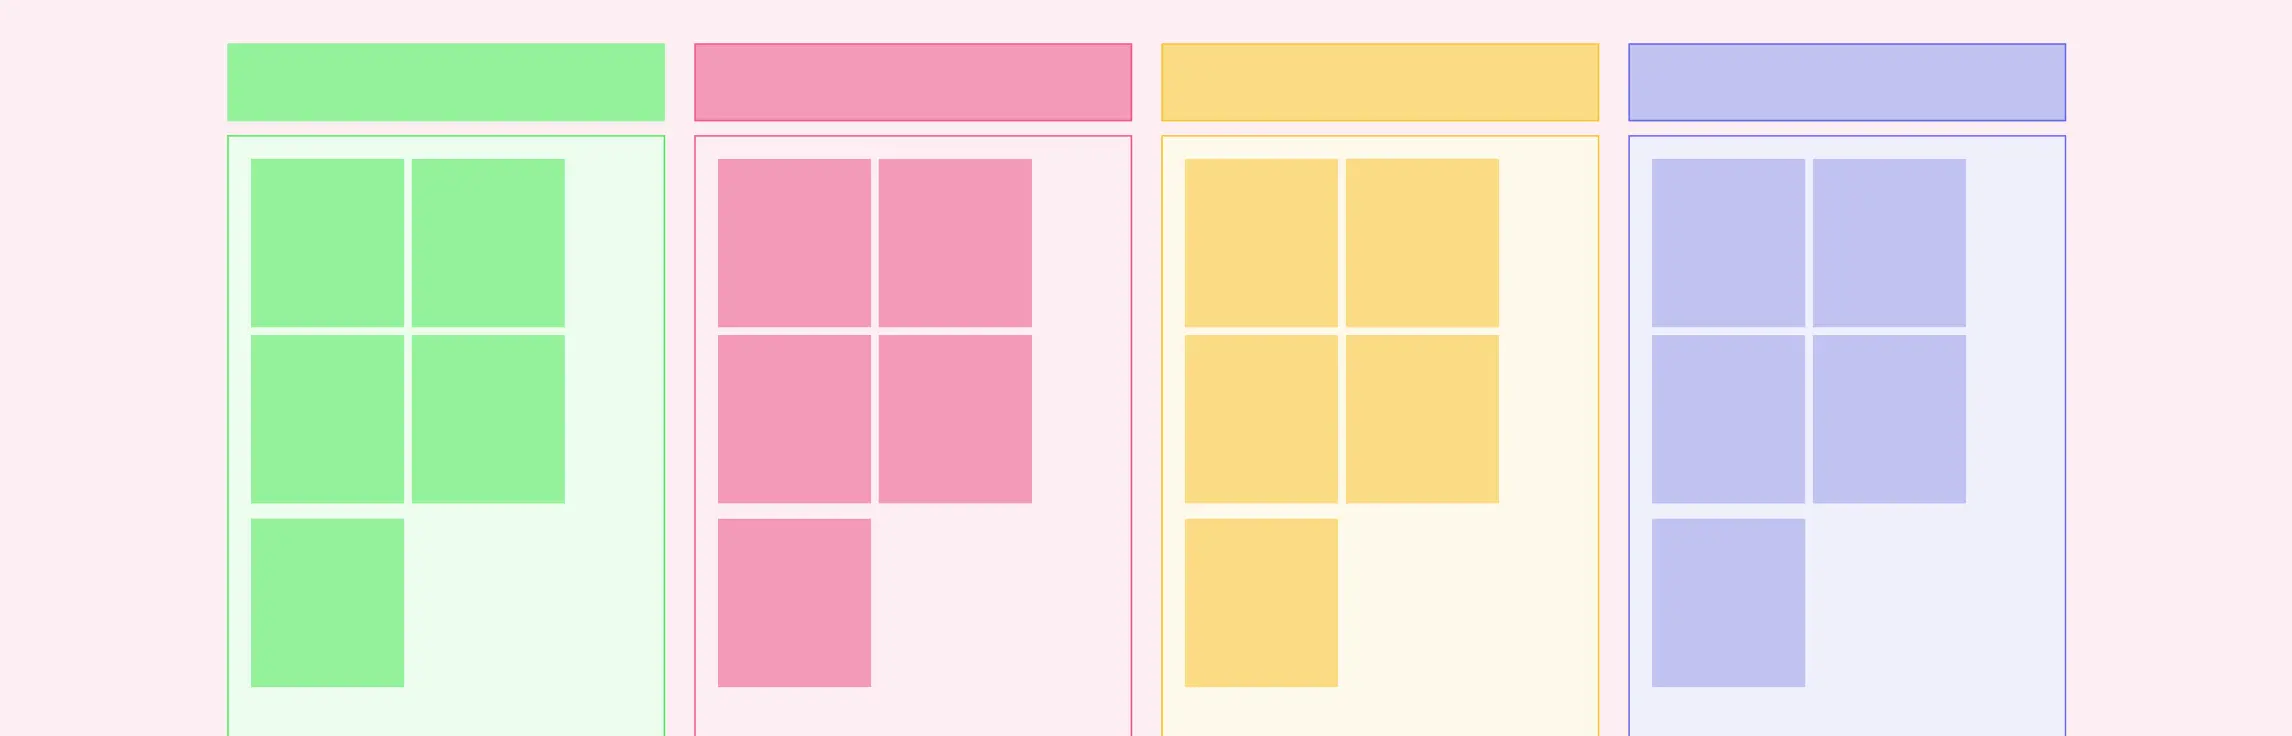
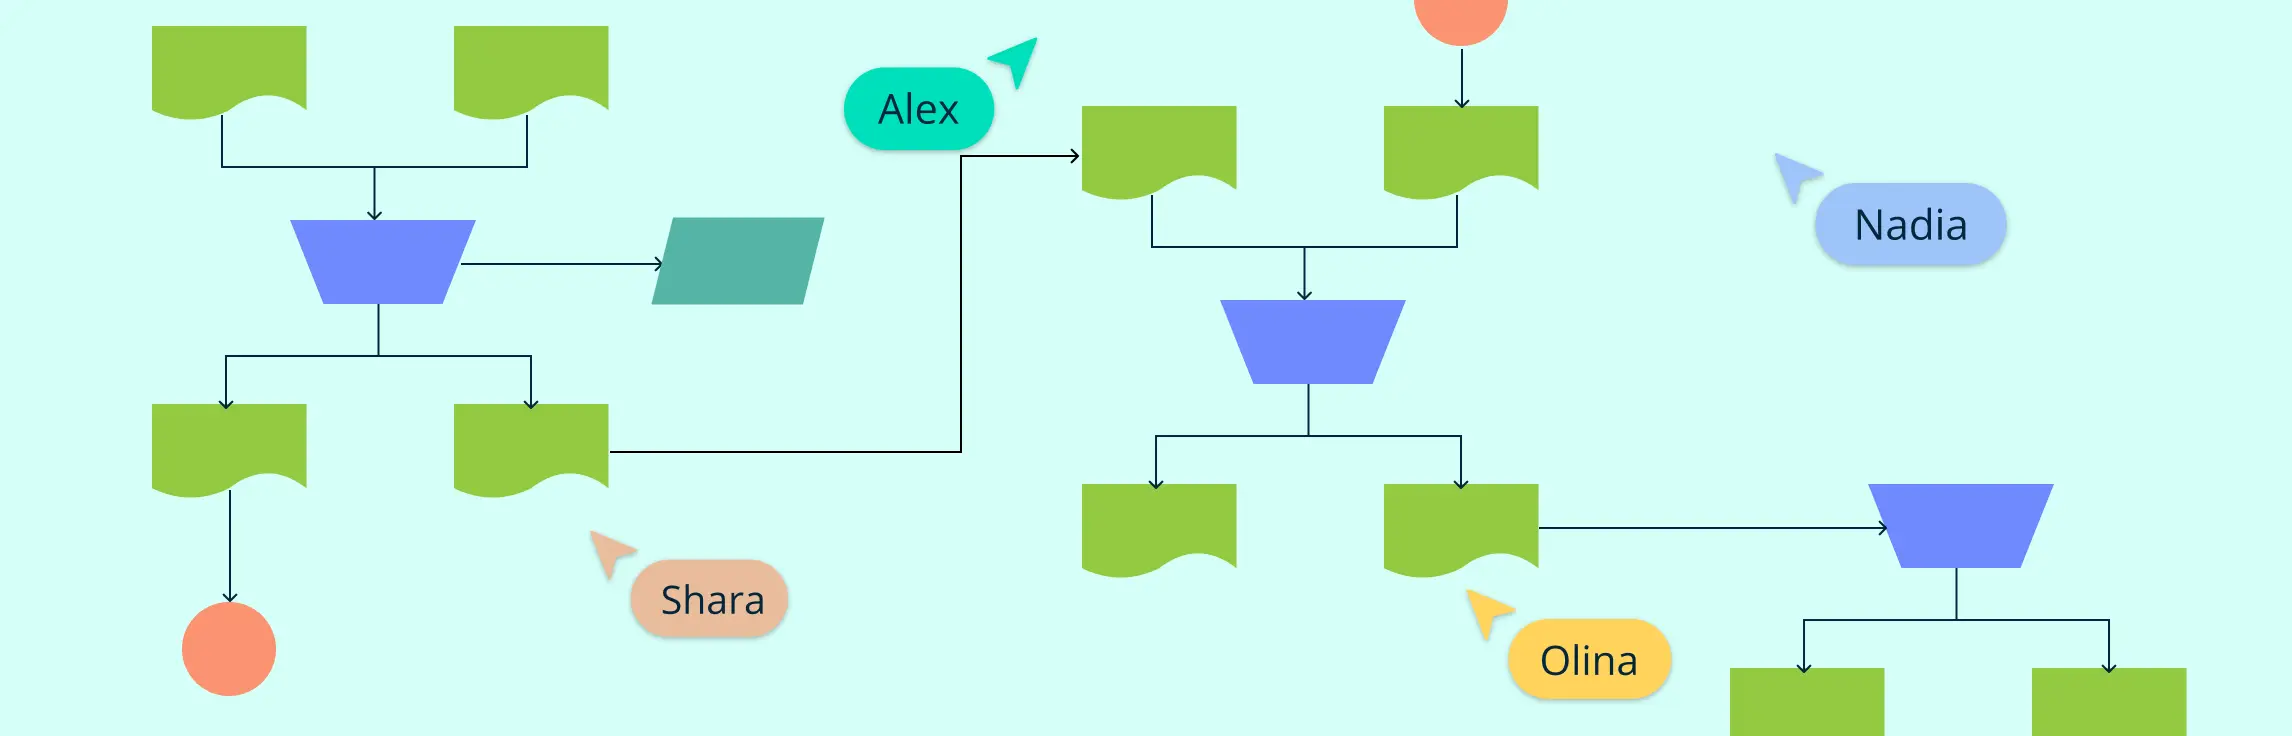
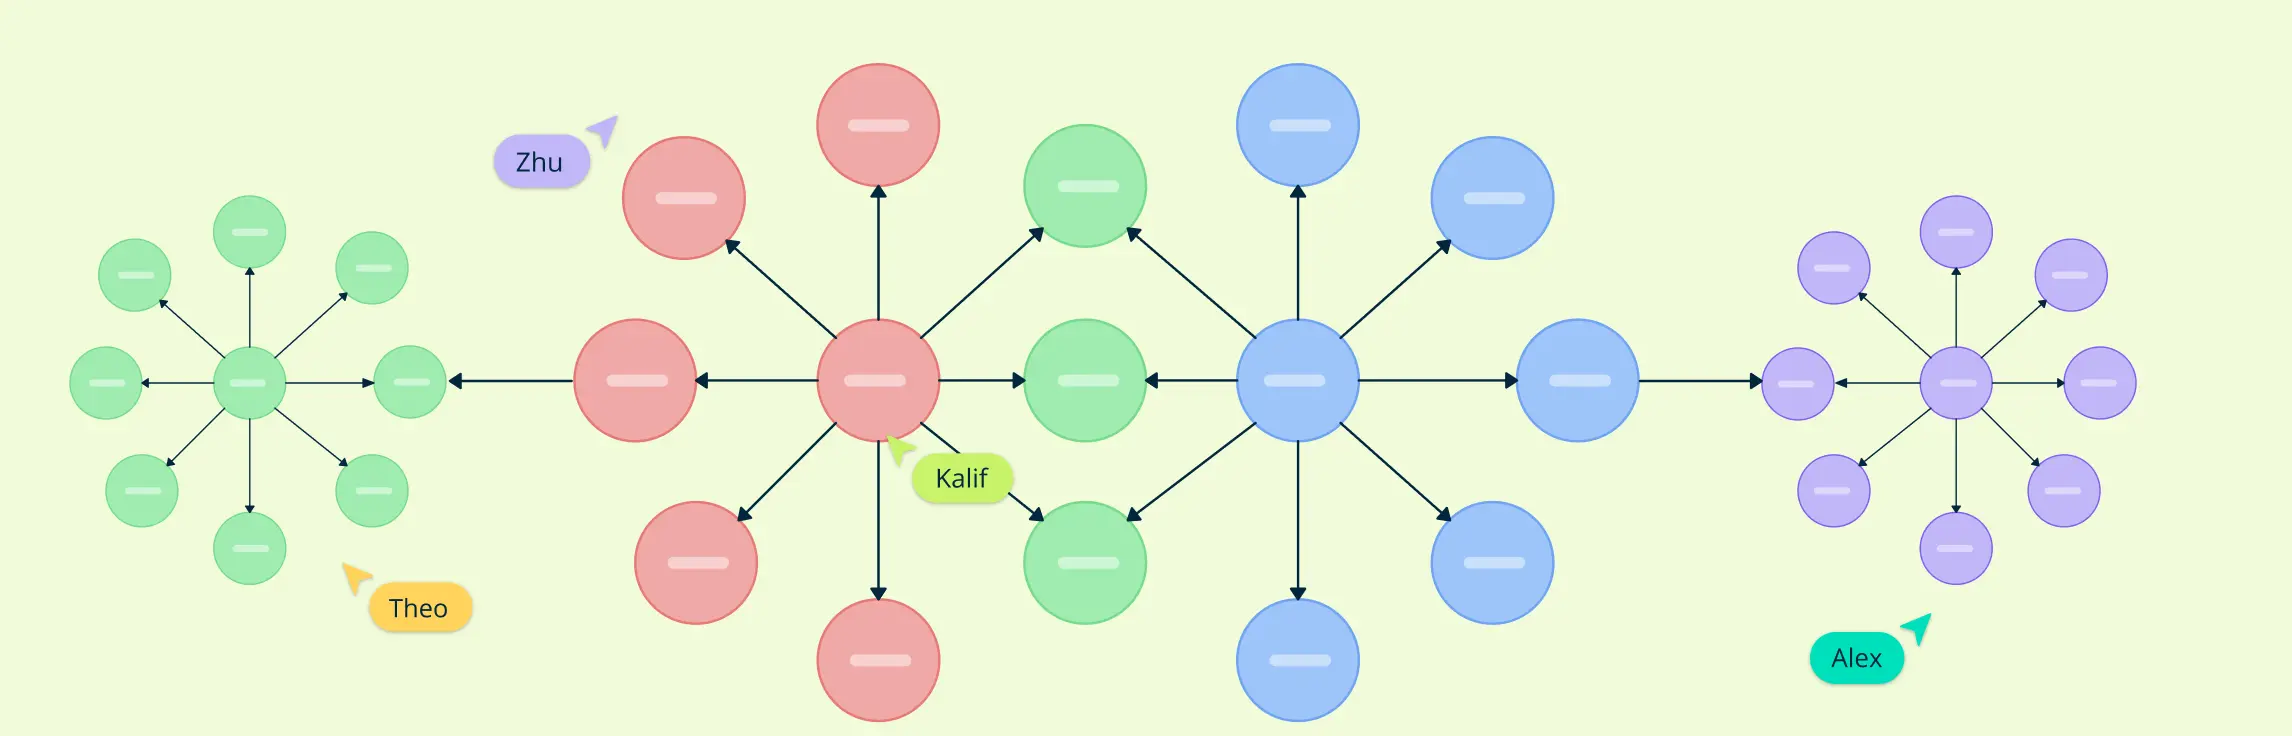
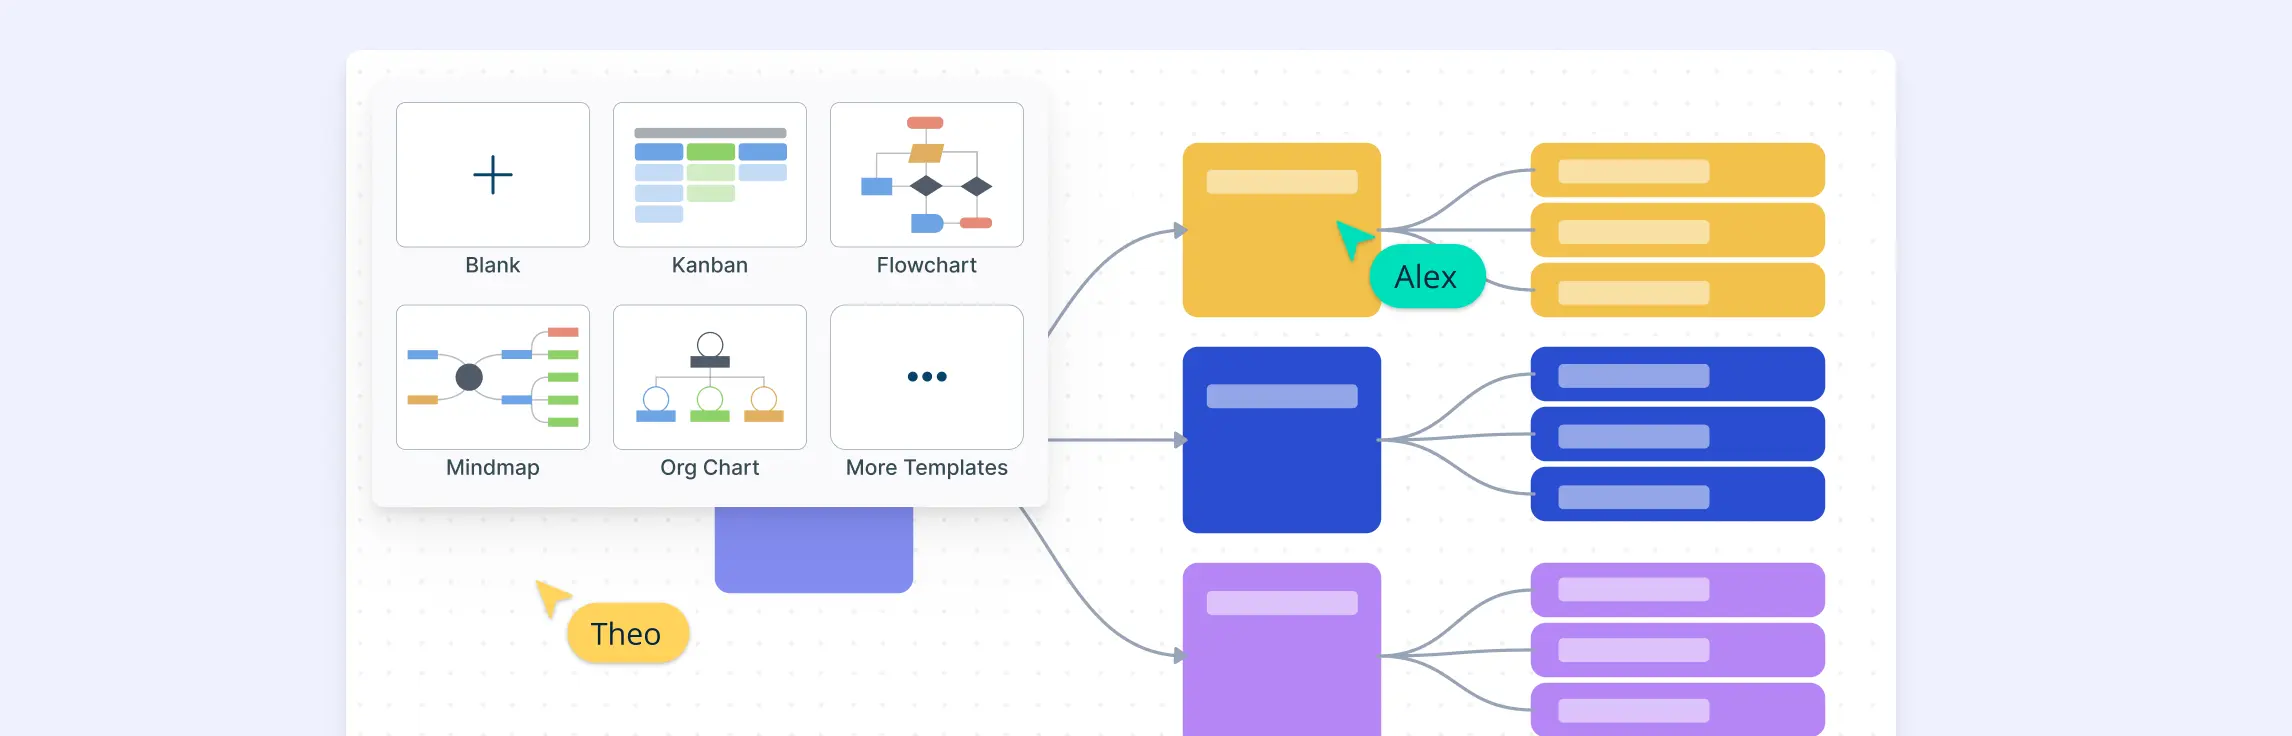
The four main types—Spider Maps, Flowcharts, Hierarchy Maps, and System Maps—serve different purposes, from brainstorming to process mapping. This guide explores their structures, uses, and examples to help you choose the right one for your needs.
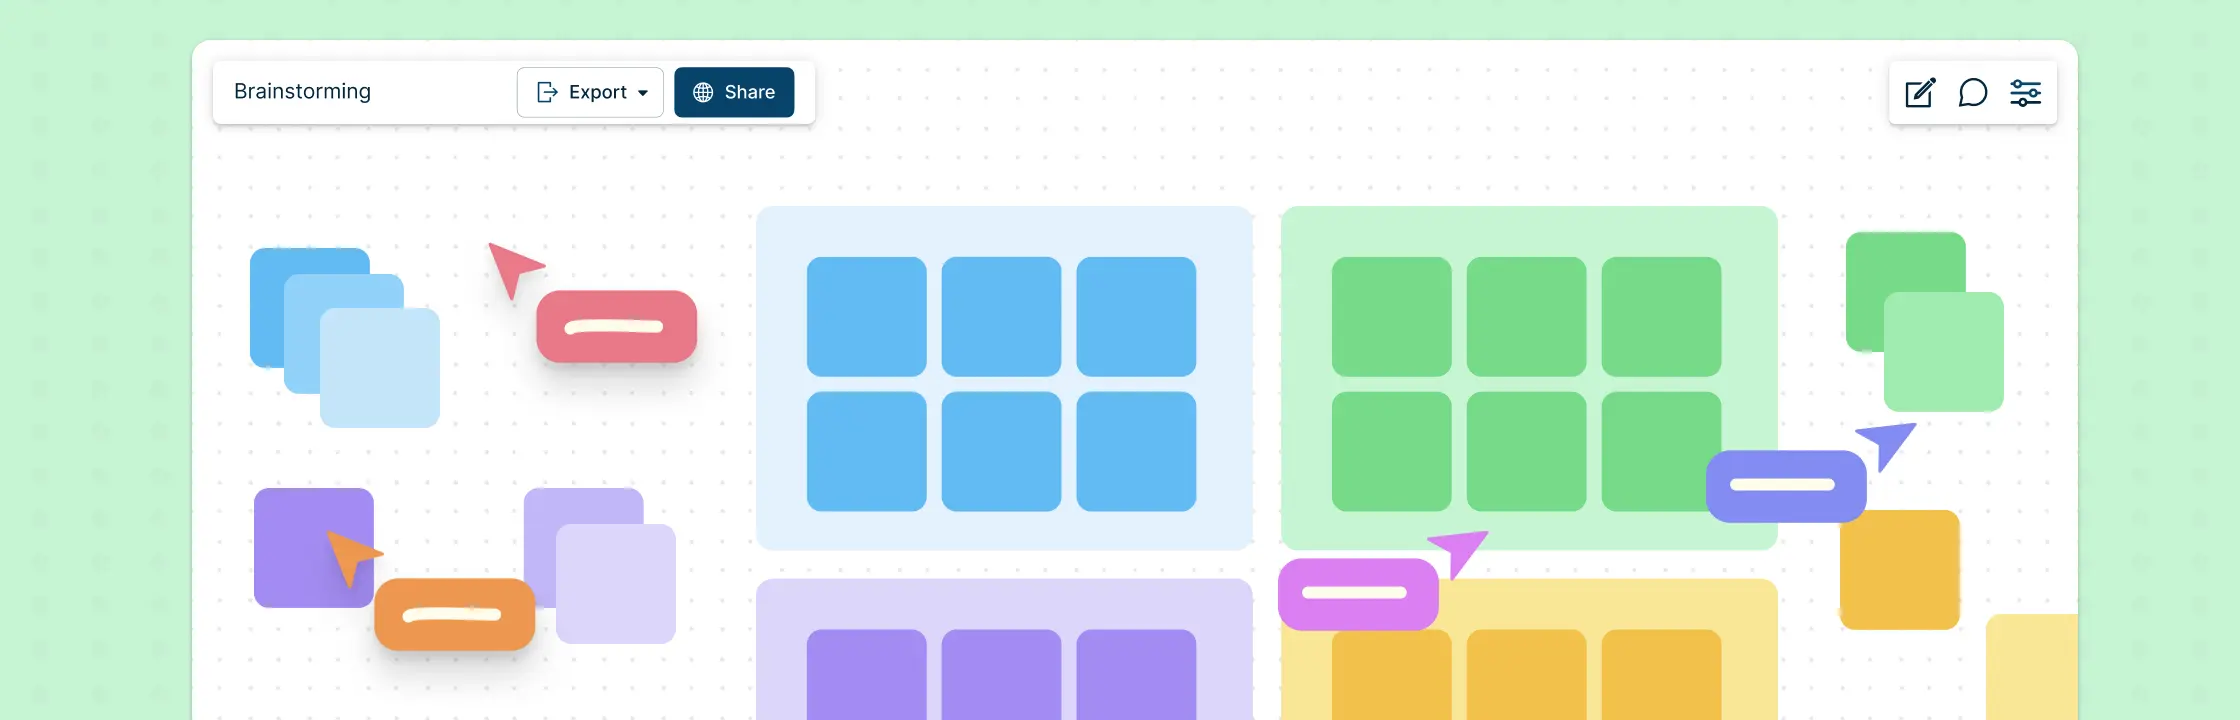
Brainstorming is a great way to come up with fresh ideas and solutions. You get into a room with your team, bounce ideas off each other and pick the best ones. Did you know that brainstorming is more effective when done virtually?
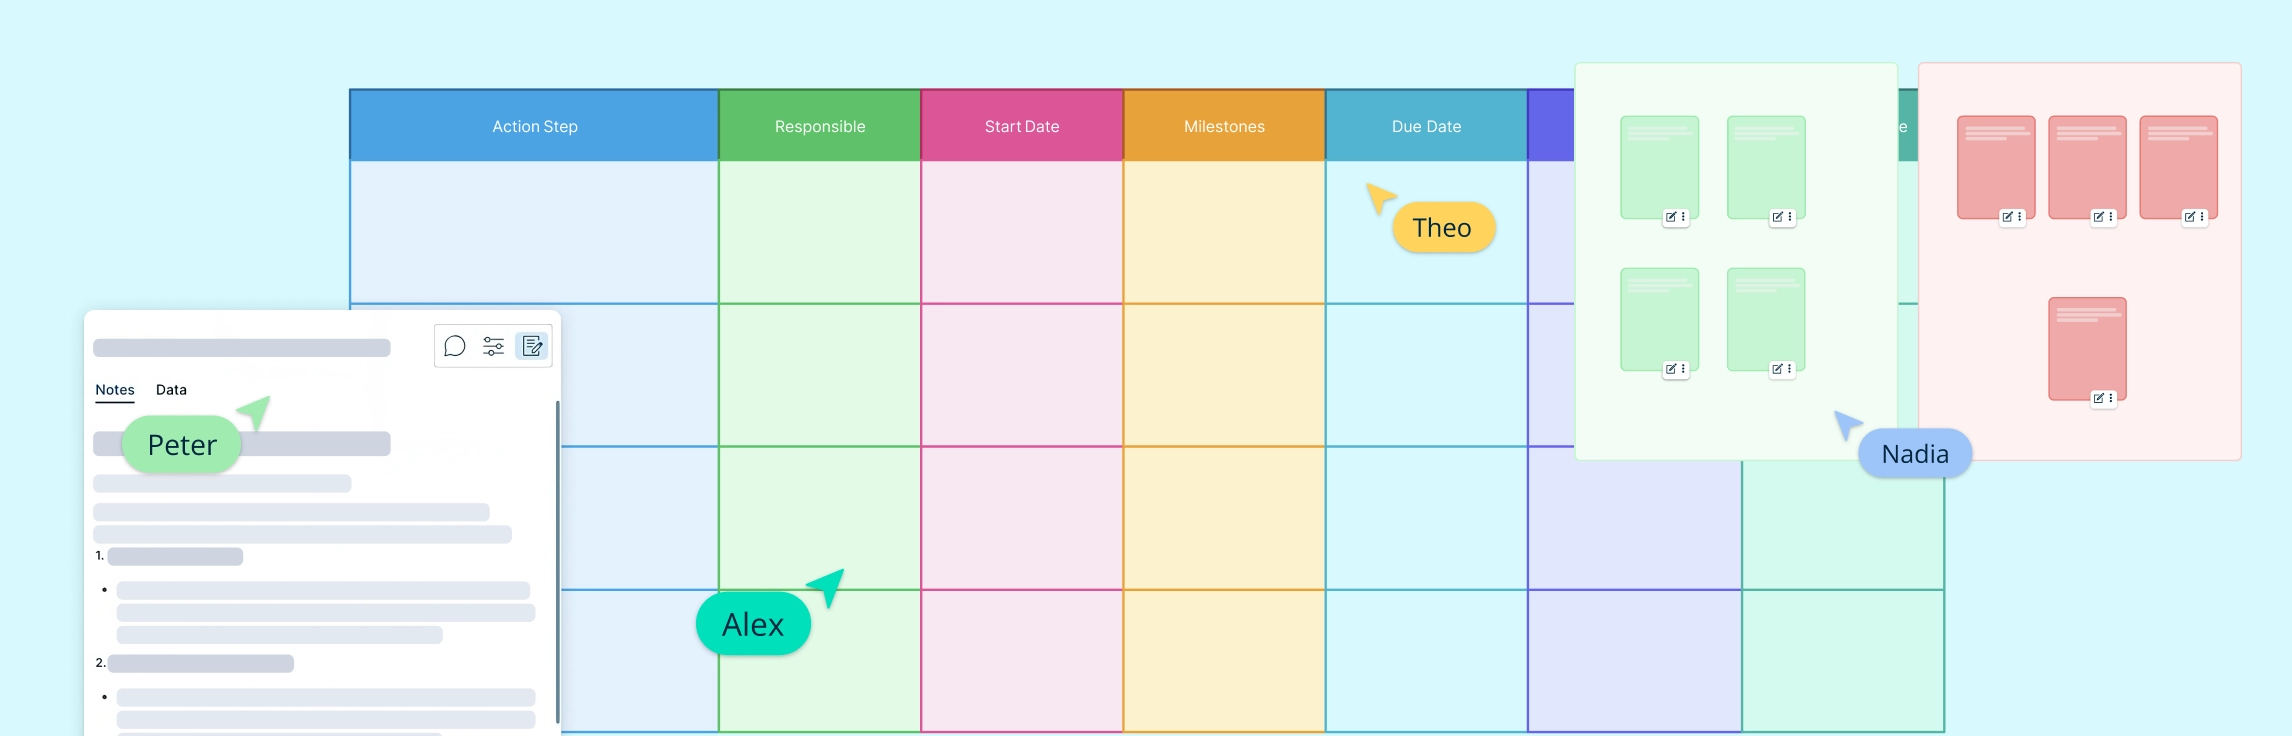
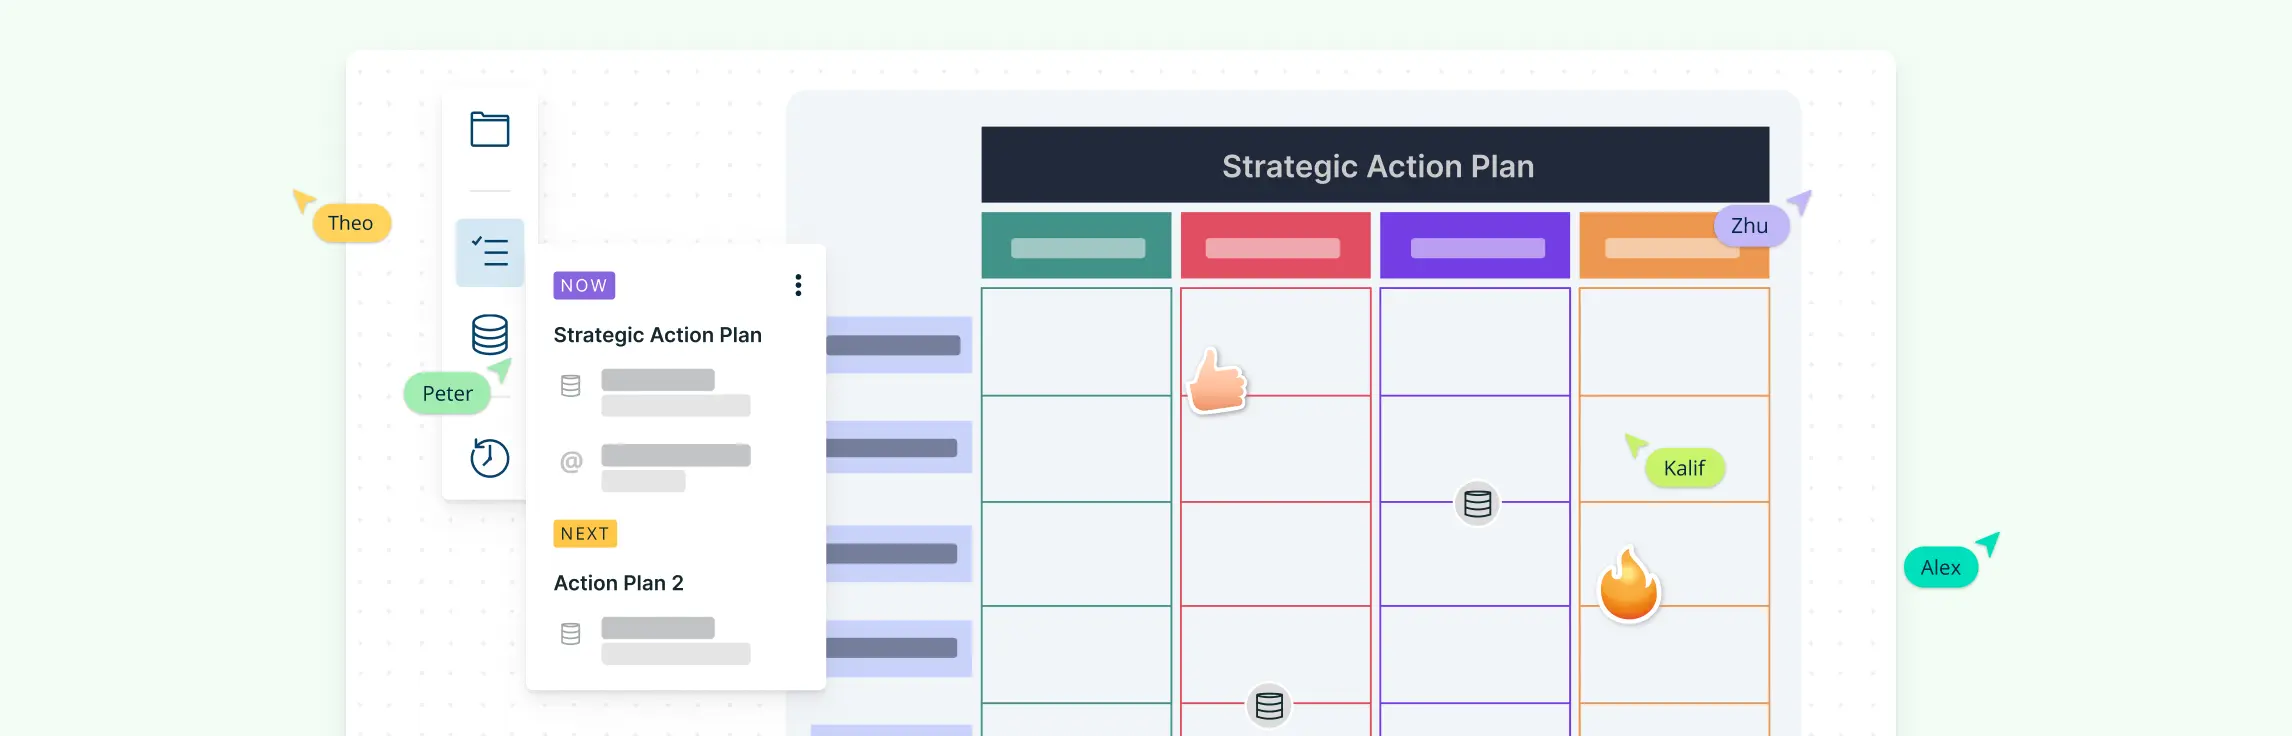
What Is an Action Plan? An action plan is a detailed outline that defines the actions needed to achieve a specific goal. It includes tasks, deadlines, assigned responsibilities, required resources, and milestones. Creating an action plan helps teams and individuals stay organized, focused, and accountable, whether in personal projects, business strategies, or academic endeavors.
This guide will explore what a concept map in nursing is, how to create one, and its role in nursing education. You’ll also find practical nursing concept map examples and templates tailored for different conditions.
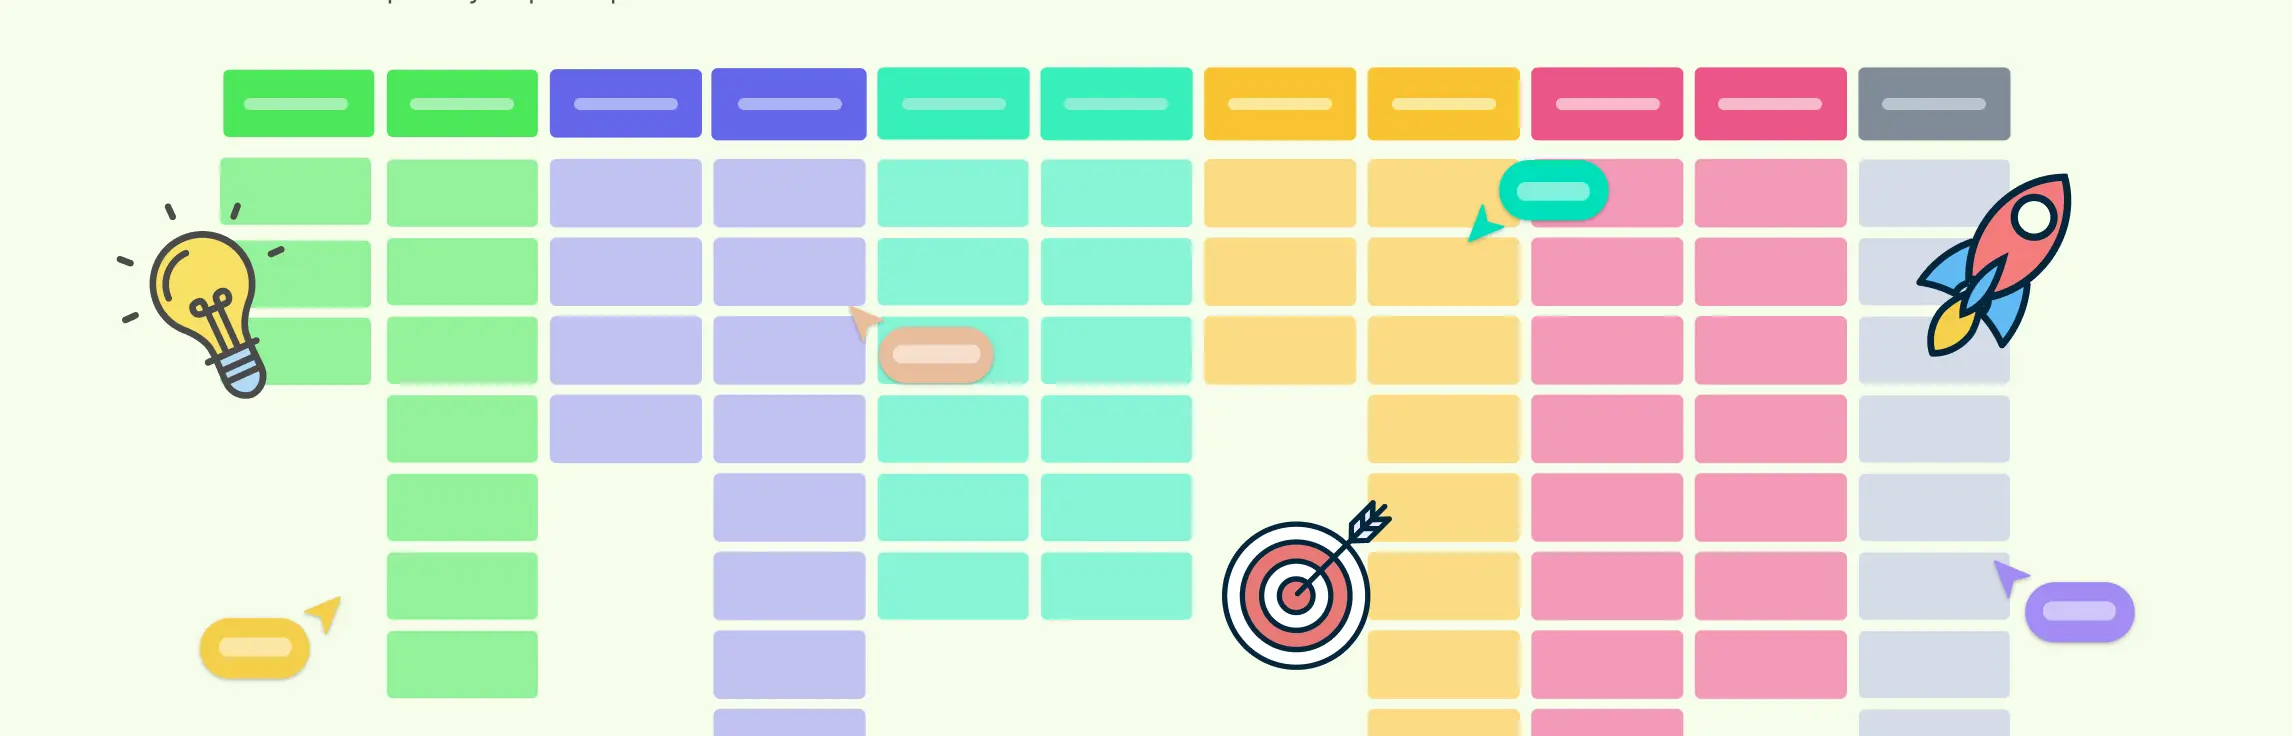
Graphic organizers combine text and visuals, making them a scientifically proven tool for effective teaching and learning. They are highly beneficial for teachers and students alike, helping to create more engaging lessons and enhancing comprehension. Below, we’ve outlined different types of graphic organizers that you can use in various scenarios—whether it’s reading, writing, conducting research, or preparing for exams. The types of graphic organizers below include a ready-to-use template to get you started instantly.