Mathematics can be a challenging subject for many students, and understanding complex concepts often requires a visual approach. Math graphic organizers are powerful tools that help simplify difficult topics, improve understanding, and make problem-solving more efficient. These organizers not only aid in organizing information but also provide a way for students to visualize mathematical relationships, patterns, and solutions. In this article, we will explore 8 essential math graphic organizers that can boost learning, comprehension, and problem-solving skills in mathematics.
1. Venn Diagrams for Mathematics
A Venn diagram is a type of graphic organizer used to illustrate the relationships between two or more sets of objects or concepts. It typically consists of overlapping circles, each representing a set. The overlapping areas show the similarities between the sets, while the non-overlapping areas show the differences. This type of visual organizer is essential for demonstrating how different mathematical concepts are related or distinct.
Venn diagrams are widely used to:
- Compare and contrast sets: For example, you can use Venn diagrams to compare the properties of even numbers versus odd numbers or prime numbers versus composite numbers.
- Set theory: They are ideal for introducing basic set operations such as unions, intersections, and complements.
- Geometric shapes: You can use Venn diagrams to compare different geometric shapes, such as squares and rectangles, to highlight their shared and unique properties.


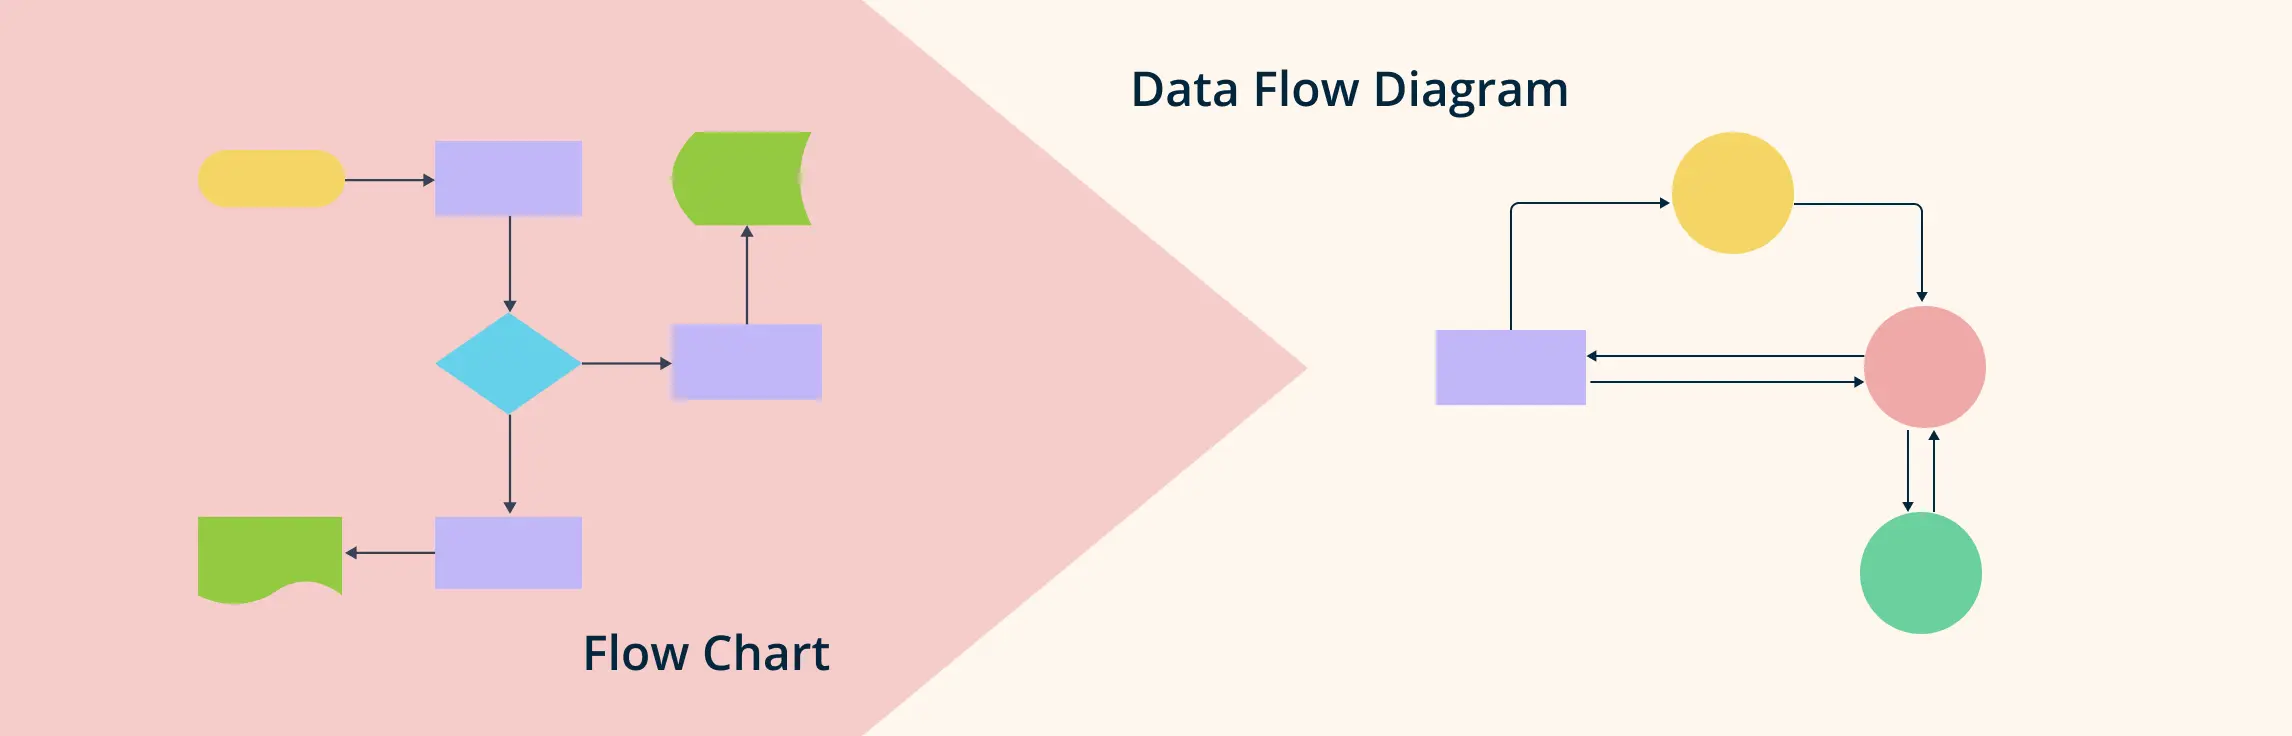
2. Flowcharts for Mathematics
A flowchart is a diagram that represents a process or sequence of steps in solving a problem or completing a task. Each step is represented by a specific shape, such as a rectangle for processes and a diamond for decision points. Arrows guide the flow from one step to the next. Flowcharts are especially effective for illustrating the order of operations or step-by-step procedures.
Flowcharts are particularly helpful for:
- Solving multi-step problems: They can guide students through solving complex algebraic equations or word problems by breaking down the process into manageable steps.
- Operations: Flowcharts can visually represent the order of operations (PEMDAS), helping students remember the correct sequence for solving expressions.
- Geometry: They are great for illustrating the steps required to solve geometric problems, such as finding the area or volume of shapes.


3. Mind Maps for Mathematics
Mind maps are graphical tools used for organizing information, where a central idea or concept is placed at the center and related ideas or subtopics branch out from it. These maps are ideal for exploring connections between different concepts and organizing knowledge in a non-linear format. Mind maps help in the creation of a visual representation of thoughts, making complex topics more digestible.
Mind maps are widely used to:
- Organize mathematical concepts: For example, you can create a mind map starting with algebra in the center and branching out to concepts such as linear equations, quadratic equations, and polynomials.
- Visualize connections: They are useful in showing how various mathematical topics are connected to each other (e.g., how algebra connects with geometry).
- Brainstorming and problem-solving: Mind maps also help in brainstorming strategies for solving math problems or finding multiple ways to solve a problem.


4. Number Lines for Mathematics
A number line is a simple, linear representation of numbers arranged in order, typically starting from 0 and extending in both positive and negative directions. It is a fundamental tool for illustrating the relative size and position of numbers. By marking intervals on the line, number lines help students visualize the relationships between numbers, such as magnitude, addition, subtraction, and fractions.
Number lines are essential for:
- Teaching arithmetic: They help students understand addition, subtraction, and other basic operations.
- Representing fractions and decimals: Number lines are particularly effective in visualizing fractions, decimals, and how they relate to whole numbers.
- Negative numbers: They also help in understanding how negative numbers relate to positive numbers and can be used for operations involving negative values.


5. T-Charts for Mathematics
A T-chart is a two-column graphic organizer used to compare two related sets of information. The name comes from its “T” shape, where the vertical line divides the chart into two sections. This organizer is effective for visually separating related but distinct ideas, making it easier to compare them side by side.
T-charts are often used for:
- Solving equations: In algebra, a T-chart can be used to organize information when solving systems of linear equations.
- Comparing properties: T-charts are ideal for comparing characteristics of numbers, such as prime versus composite numbers, or positive versus negative integers.
- Pattern identification: T-charts can also be used to identify patterns in sequences or tables of values.


6. Bar Graphs Mathematics
Bar graphs are visual representations of data where individual bars represent different categories or values. The length or height of each bar correlates with the value it represents. Bar graphs are particularly useful for comparing quantities across different groups or categories.
Bar graphs are used to:
- Represent and compare data: Bar graphs are ideal for statistical analysis, where they can compare the frequency of different categories or values.
- Analyze data trends: They help students analyze trends in data, such as the distribution of scores on a test or the number of students in different grade levels.
- Visualize categorical data: Bar graphs are particularly effective for displaying data that falls into distinct categories, such as sales figures, test scores, or survey results.
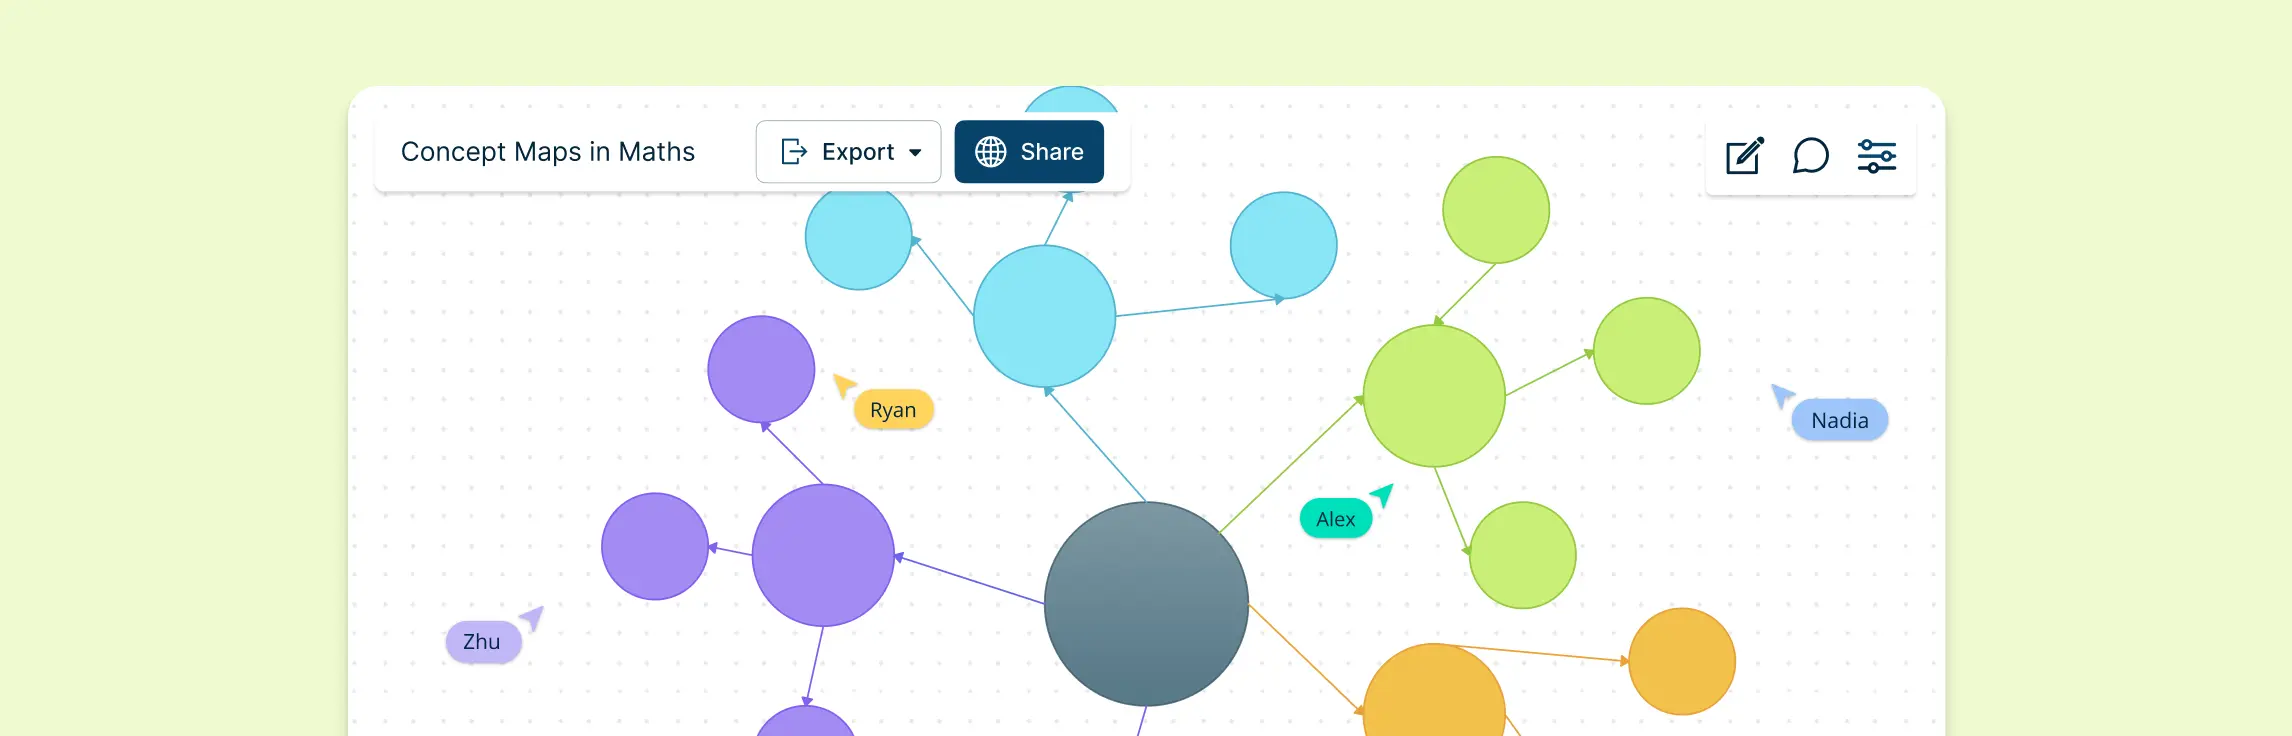
7. Concept Maps for Mathematics
Concept maps are diagrams that visually represent relationships between concepts. They start with a central idea at the top, and related concepts branch out underneath, showing how each concept is connected to others. Mathematics concept maps are a powerful way to organize knowledge and show how different topics relate to each other.
Concept maps are effective for:
- Organizing complex information: They help break down complex topics like algebra, geometry, or calculus into a hierarchy of interrelated concepts.
- Visualizing relationships: Concept maps are used to demonstrate how different mathematical ideas are connected, such as how algebraic functions relate to calculus.
- Reinforcing knowledge: By creating a visual structure, concept maps help students solidify their understanding of how different ideas in math fit together.


8. Tables for Mathematics
Tables are an essential tool for organizing data in rows and columns. They are particularly useful for sorting and comparing information systematically. In mathematics, tables are used to display numerical data, patterns, or relationships between variables.
Tables are used for:
- Solving equations: Organizing data points to solve for unknowns or make predictions.
- Pattern recognition: Identifying patterns in sequences, such as arithmetic or geometric progressions.
- Data analysis: Tables are commonly used in statistics to organize and analyze data.


Benefits of Using Math Graphic Organizers
Math graphic organizers are invaluable tools that provide numerous benefits for students, educators, and anyone looking to deepen their understanding of mathematical concepts. By simplifying complex ideas and presenting them visually, these organizers make abstract concepts more tangible and easier to grasp. Let’s explore the key advantages of incorporating graphic organizers into math learning:
1. Enhances Conceptual Understanding
Graphic organizers provide a clear, visual structure for students, helping them to break down and organize complex mathematical ideas. Whether it’s illustrating relationships between numbers or showing the steps in a mathematical procedure, these visual tools help students understand not just what to do, but why they do it. For example, concept maps can help students visualize how different mathematical concepts are interconnected, reinforcing their understanding of how algebra relates to geometry or calculus.
2. Supports Retention and Recall
Visual learning aids like graphic organizers have been shown to enhance memory retention. When students are able to see mathematical information represented in a structured, visual format, they are more likely to retain the information long-term. By organizing information into charts, graphs, and diagrams, these tools reinforce key concepts and make it easier for students to recall formulas, equations, and steps in a problem-solving process.
3. Improves Problem-Solving Skills
Math requires a logical approach, and graphic organizers help students follow clear steps when solving problems. For example, flowcharts guide students through multi-step problems, while T-charts allow them to compare values or solve equations step by step. By making the process of solving math problems more explicit and visual, these tools help improve critical thinking and problem-solving skills, making it easier for students to approach more complex questions with confidence.
4. Facilitates Active Learning
Using graphic organizers in math encourages students to actively engage with the material. Instead of passively reading through problems or concepts, students are encouraged to create or complete their own diagrams, charts, and maps. This active participation deepens their understanding and helps them process information in a way that enhances their ability to apply what they’ve learned in real-world situations.
5. Aids in Differentiated Learning
Math graphic organizers cater to diverse learning styles. Visual learners, in particular, benefit from seeing math concepts laid out graphically. However, these tools are also effective for auditory and kinesthetic learners when used as part of interactive activities. Teachers can easily tailor graphic organizers to suit the individual needs of students, whether they’re solving basic arithmetic problems, analyzing data, or exploring advanced mathematical concepts.
6. Boosts Confidence in Math
For many students, math can be intimidating, but graphic organizers provide an accessible way to approach problems in a less overwhelming manner. By breaking down concepts into digestible chunks and showing step-by-step procedures, these organizers help students feel more confident in their ability to solve problems. Whether it’s a number line for addition or a Venn diagram for comparing sets, graphic organizers provide clarity and structure that fosters self-assurance in tackling math tasks.
7. Encourages Collaboration and Discussion
Graphic organizers also serve as great tools for collaboration in the classroom. By using visual aids, students can work together to organize and compare their ideas, discussing various problem-solving methods and strategies. This collaborative process not only enhances their understanding of mathematical concepts but also encourages communication and teamwork, both of which are essential skills in mathematics and beyond.
8. Improves Data Visualization
For higher-level mathematics, such as statistics or algebra, graphic organizers like bar graphs and tables are excellent for organizing and analyzing data. These tools help students spot trends, identify patterns, and make informed decisions based on the data. In addition, they make abstract concepts, such as probability or functions, more concrete by allowing students to see them represented visually.
Conclusion
Math graphic organizers are essential tools that can significantly improve a student’s understanding of mathematical concepts. By using visual aids like Venn diagrams, flowcharts, mind maps, and others, students can break down complex problems and see the relationships between different concepts. Incorporating these graphic organizers into lessons and study sessions can make math more accessible and less intimidating. To get started with customizable templates, explore Creately’s collection of math graphic organizers to enhance your learning experience.
FAQs About Math Graphic Organizers
What are math graphic organizers and how do they help students?
How can teachers use math graphic organizers in the classroom?
Can math graphic organizers be used for all grade levels?
Resources:
Ives, B. and Hoy, C. (2003). Graphic Organizers Applied to Higher-Level Secondary Mathematics. Learning Disabilities Research and Practice, 18(1), pp.36–51. doi:https://doi.org/10.1111/1540-5826.00056.
Zollman, A. (2009a). Mathematical Graphic Organizers. Teaching Children Mathematics, 16(4), pp.222–229. doi:https://doi.org/10.5951/tcm.16.4.0222.
Zollman, A. (2009b). Students Use Graphic Organizers to Improve Mathematical Problem-Solving Communications. Middle School Journal, 41(2), pp.4–12. doi:https://doi.org/10.1080/00940771.2009.11461707.