A cross-functional flowchart is a simple but powerful tool that helps businesses and teams visualize their processes more clearly. Unlike a regular flowchart, it doesn’t just show the steps of a process—it also highlights who is responsible for each step. This makes it especially useful for teams that work across different departments, ensuring everyone understands their role in the bigger picture.
In this guide, we’ll break down what a cross functional flowchart is, why it’s important, and how to create one easily. Plus, we’ll provide free templates to help you get started right away.
What Is a Cross Functional Flowchart
A cross functional flowchart is a type of flowchart that shows how different people, teams, or departments work together in a process. It organizes tasks into “swimlanes,” which clearly show who is responsible for each step. This makes it easier to understand how work moves from one person or team to another.
Unlike a regular flowchart, which only focuses on the sequence of steps, a cross functional flowchart also highlights accountability. It helps businesses spot bottlenecks, reduce confusion, and improve teamwork by making responsibilities clear. Whether used in customer service, project management, or manufacturing, this type of flowchart brings structure to complex workflows and ensures smoother collaboration.
How to Create a Cross Functional Flowchart
Follow these steps to create a clear and effective cross functional flowchart that improves process understanding and efficiency within your organization.
Step 1. Define the process and objectives
Start by deciding which process you want to map. It could be anything from handling customer orders to managing employee onboarding. Once you’ve chosen the process, think about what you want to achieve with the flowchart. Are you trying to make tasks clearer, improve efficiency, or reduce delays? Having a clear goal will help you organize the flowchart in a way that makes sense and adds value.
Step 2. Gather detailed information
To make an accurate cross functional flowchart, talk to the people involved in the process. Ask them how tasks are completed, what decisions need to be made, and where delays might happen. Take notes on every step, including who is responsible for each task. The more detailed your information, the better your flowchart will be at showing how work gets done.
Step 3. Determine swimlanes
Swimlanes are what make a cross functional flowchart different. They separate responsibilities by team, department, or individual role. Before creating the cross functional flowchart, decide how you want to group these lanes. If multiple teams are involved, organizing them by department might be best. If the process is role-specific, grouping by job title can help make responsibilities clear.
Step 4. Choose the cross-functional flowchart orientation
Your cross functional flowchart can be laid out horizontally or vertically. A horizontal layout works well if different teams are involved throughout the process. A vertical layout is better for processes that follow a top-down structure, like approval workflows. Choose the format that makes it easiest to follow the flow of tasks.
Step 5. Select a diagramming tool
Using the right tool will make creating your cross functional flowchart much easier. Software like Creately offers templates that help you get started quickly. Look for features that allow for easy editing and collaboration so your team can contribute as needed.
Step 6. Construct the flowchart
Now, start building your cross functional flowchart. First, set up swimlanes for each role or department involved. Then, add each step of the process in the correct order within the swimlanes. Use standard flowchart symbols—rectangles for tasks, diamonds for decision points, and ovals for start and end points. If there are different paths based on decisions, make sure they are clearly shown. Keep the layout simple and easy to read.
Step 7. Connect the steps
Use arrows to show how each step connects to the next. Arrows should clearly indicate the direction of the process. Avoid crossing lines where possible, and use consistent spacing so the cross functional flowchart is easy to follow. If the process loops back or has multiple outcomes, make sure that’s clearly shown.
Step 8. Review and refine
Once your flowchart is complete, share it with the people who follow this process daily. They can help confirm if it’s accurate and point out any missing steps. If needed, make adjustments to improve clarity. A good cross functional flowchart should be simple enough for anyone to understand without extra explanation.
Step 9. Implement and update
Finally, share the cross functional flowchart with everyone who needs it. Whether it’s for training, process improvement, or troubleshooting, keeping it accessible ensures it stays useful. As workflows change, update the cross-functional flowchart to reflect new processes. A well-maintained cross functional flowchart helps teams stay organized and work more efficiently.
Cross Functional Flowchart Templates
You can use these sample cross functional flowcharts to get started right away.
Google Docs Cross-Functional Flowchart Template


Vertical Cross Functional Swimlane Flowchart Template

Support Process Swimlane Flowchart

Fast Food Order Cross Functional Flowchart

Business Process Flow Template

Types of Cross Functional Flowcharts
Each of these cross functional flowchart types serves a unique purpose, catering to different aspects of process analysis and improvement. Selecting the appropriate type depends on the specific objectives and challenges an organization aims to address.
Matrix flowcharts
Matrix cross functional flowcharts are designed to detail complex relationships, especially when processes involve multiple subprocesses that interact in intricate ways. They use a grid-like structure to represent various process steps and their interconnections, making it easier to visualize dependencies and interactions. This format is particularly useful for processes that require coordination across different teams or departments, as it highlights how each step relates to others within the broader workflow.

Deployment flowcharts
Deployment cross functional flowcharts, often referred to as swimlane diagrams, organize process steps into lanes that correspond to specific departments, teams, or individuals. This arrangement clarifies who is responsible for each action within the process, providing a clear visual representation of roles and responsibilities. By grouping related tasks together, deployment flowcharts help identify areas where processes may overlap or where handoffs occur, facilitating better coordination and communication among different functional units.

Opportunity flowcharts
An opportunity cross functional flowchart is a specialized version of a cross functional flowchart that focuses on identifying areas for improvement within a process. It typically differentiates between value-added (VA) steps, which contribute directly to the product or service, and non-value-added (NVA) steps, which do not add value to the end result. By visually separating these steps, opportunity flowcharts help organizations pinpoint inefficiencies, waste, or unnecessary steps that could be eliminated or improved. This makes them a valuable tool for process optimization, allowing businesses to prioritize areas that will lead to increased efficiency, cost savings, or enhanced quality.

How to Analyze a Cross Functional Flowchart
Analyzing a cross-functional flowchart helps you understand a process and identify areas for improvement. Here’s how to do it.
1. Understand the flowchart’s structure
Begin by familiarizing yourself with the crossfunctional flowchart’s layout. Cross functional flowcharts, organize process steps into lanes, each representing a specific department, team, or individual. This structure clarifies roles and responsibilities, making it easier to follow the process flow.
2. Identify the start and end points
Clearly define where the process begins and ends. This helps in understanding the scope of the process and ensures that all necessary steps are included. Discussing and deciding on the boundaries of your process is crucial to avoid ambiguity.
3. Review the steps in order
Examine each process step from start to finish. Ensure that the steps are in logical order and that each action leads naturally to the next. This sequential review helps in identifying any redundancies or gaps in the process.
4. Check role assignments
Look at how tasks are distributed across different lanes. Verify that responsibilities are appropriately assigned and that there is no ambiguity regarding who is responsible for each task. This assessment can reveal areas where role definitions may need clarification.
5. Examine decision points
Pay close attention to decision points, often represented by diamond shapes. Analyze the conditions leading to different branches to ensure that decision criteria are clear and that all possible outcomes are accounted for.
6. Spot bottlenecks and inefficiencies
Look for steps where delays or inefficiencies might occur. Cross functional flowcharts can help identify inefficiencies by visualizing the sequence of activities performed by different teams. Teams can collaboratively analyze the cross functional flowchart and identify unnecessary steps, duplicated efforts, or areas of potential improvement.
7. Ensure completeness and consistency
Make sure the cross functional flowchart includes all necessary steps and accurately represents the process. It should give a complete view of how the process works.
When to Use a Cross Functional Flowchart
Incorporating cross functional flowcharts into process analysis and design helps organizations achieve greater clarity, efficiency, and collaboration, ultimately leading to improved performance and productivity. Here are some scenarios where using a cross functional flowchart is particularly beneficial:
1. Mapping complex processes with multiple stakeholders
When a process involves various departments or teams, a cross functional flowchart can effectively depict how tasks flow between them. This visualization aids in understanding the sequence of activities and the interactions among different functions.
2. Clarifying roles and responsibilities
Assigning tasks and decisions to specific departments or individuals within a process can be challenging. Cross-functional flowcharts address this by clearly displaying who is responsible for each step, reducing confusion and enhancing accountability.
3. Identifying inefficiencies and bottlenecks
By illustrating the flow of activities across various functions, these cross functional flowcharts make it easier to spot delays or areas where processes slow down. Recognizing these issues allows for targeted improvements to enhance overall efficiency.
4. Enhancing communication and collaboration
Cross-functional flowcharts serve as effective communication tools, providing a shared understanding of processes among team members, departments, and stakeholders. This shared understanding fosters better collaboration and coordination.
5. Documenting and standardizing procedures
For organizations aiming to standardize processes, cross functional flowcharts offer a clear documentation method. They capture the current state of processes, which can be analyzed and optimized for consistency and best practices.
Benefits and Limitations of Cross Functional Flowcharts
Cross functional flowcharts offer several advantages but also come with certain limitations.
Benefits
1. Clarifies roles and responsibilities across departments
By visually mapping out processes, cross functional flowcharts clearly define who is responsible for each task. This clarity helps minimize confusion and ensures that all team members understand their specific duties, leading to more efficient collaboration.
2. Identifies inefficiencies and bottlenecks in processes
These flowcharts provide a comprehensive view of workflows, making it easier to spot areas where delays or inefficiencies occur. Identifying such bottlenecks allows teams to address issues proactively, streamline operations, and enhance overall productivity.
3. Enhances communication and collaboration among teams
By illustrating how different departments interact within a process, cross functional flowcharts promote better communication. They help teams understand each other’s roles and how their work interconnects, fostering a collaborative environment that drives successful outcomes.
4. Facilitates process optimization and continuous improvement
With a clear visual representation of processes, these flowcharts serve as a foundation for analyzing current workflows and identifying areas for improvement. They support continuous improvement efforts by highlighting opportunities to optimize processes, reduce waste, and enhance efficiency.
Limitations
1. Complexity in highly detailed processes
For processes with numerous steps and participants, cross functional flowcharts can become complex and challenging to interpret. Overly detailed diagrams may overwhelm users, making it difficult to extract actionable insights.
2. Potential for oversimplification
In an effort to make processes easy to understand, there’s a risk of oversimplifying complex workflows. This simplification might omit critical nuances, leading to misunderstandings or overlooking important process elements.
3. Maintenance challenges
As processes evolve, keeping cross functional flowcharts up to date can be time-consuming. Regular revisions are necessary to ensure the diagrams accurately reflect current workflows, requiring ongoing effort and resources.
4. Risk of misinterpretation
Without standardized symbols and clear legends, cross functional flowcharts can be misinterpreted by different users. It’s essential to ensure that all stakeholders understand the diagram’s conventions to prevent confusion.
Common Mistakes to Avoid When Creating a Cross Functional Flowchart
Avoid these common mistakes to create cross functional flowcharts that effectively communicate processes, enhance understanding, and support your process improvement plan.
1. Overcomplicating the flowchart
Including excessive detail in a cross-functional flowchart can make it cluttered and difficult to understand. Focus on the essential steps and decisions to maintain clarity.
2. Using inconsistent symbols and formatting
Mixing different symbols or formatting styles within a cross functional flowchart can lead to confusion. Use standardized symbols and maintain consistent formatting throughout to ensure the diagram is easy to follow.
3. Neglecting decision points
Omitting decision points can result in an incomplete representation of the process. Ensure that all decision steps are included to provide a full understanding of the workflow.
4. Failing to validate the flowchart
Not reviewing the cross-functional flowchart with stakeholders can lead to inaccuracies. Collaborate with team members familiar with the process to verify that the diagram accurately reflects the workflow.
5. Creating overly complex flow diagrams
Designing cross functional flowcharts that are too detailed or intricate can make them hard to read. Strive for simplicity and focus on the most critical elements of the process.
6. Ignoring process loops
Some processes involve feedback cycles or repeated tasks. Ensure that these loops are represented in the cross-functional flowchart to capture the full process accurately.
Tips to Make Better Cross Functional Flowcharts
Here are some effective tips to improve the clarity and effectiveness of your cross functional flowcharts:
1. Identify all process steps
Begin by thoroughly listing every step involved in the process. This comprehensive approach ensures that no critical actions are overlooked, providing a complete view of the workflow.
2. Define roles and responsibilities clearly
Assign each process step to the appropriate department or individual. Clearly labeling these assignments helps prevent confusion and clarifies accountability.
3. Use standardized symbols and consistent formatting
Employ universally recognized symbols and maintain consistent formatting throughout your flowchart. This practice enhances readability and ensures that the diagram is easily understood by all stakeholders.
4. Limit the flowchart’s scope
Avoid overloading your cross-functional flowchart with excessive detail. Focus on the main steps and interactions to keep the diagram clear and user-friendly.
5. Incorporate decision points effectively
Clearly depict decision points within the process, using appropriate symbols to represent choices and their possible outcomes. This inclusion provides a complete picture of the workflow’s dynamics.
6. Collaborate and gather feedback
Engage with team members and stakeholders to review the cross-functional flowchart. Their insights can help identify potential improvements and ensure that the diagram accurately reflects the process.
7. Utilize appropriate tools for creation
Use specialized diagramming software to create your cross-functional flowchart. These tools offer features like drag-and-drop interfaces and a variety of templates, streamlining the creation process and enhancing the diagram’s quality.
8. Keep the cross-functional flowchart updated
Regularly review and update your cross-functional flowchart to reflect any changes in the process. This practice ensures that the diagram remains a relevant and accurate resource for all users.
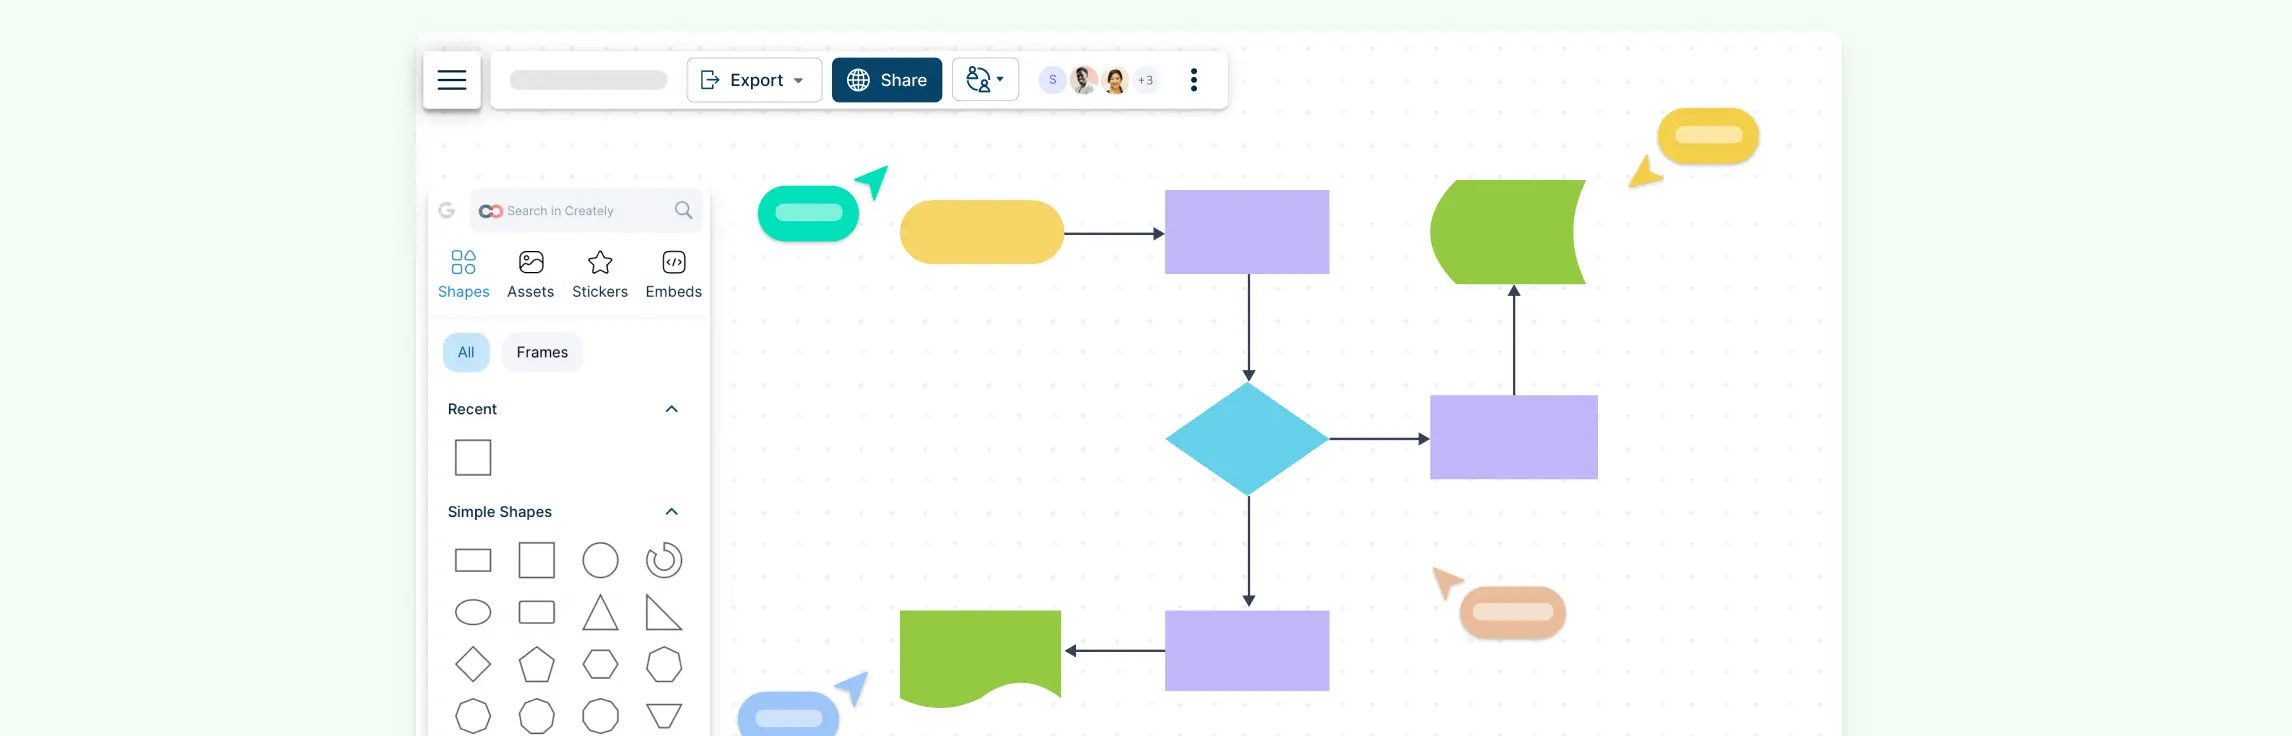
How to Make a Cross Functional Flowchart with Creately
Creately offers a variety of features that make it easy and efficient to create cross-functional flowcharts. Creately’s free flowchart software features are designed to streamline the diagramming process, boost collaboration, and improve the overall user experience.:
1. Swimlane customization
One of the core components of a cross-functional flowchart is the swimlane, which represents different teams, departments, or roles. Creately allows you to:
- Easily create and customize swimlanes: You can adjust the number of lanes based on your process requirements and label them according to the relevant roles or departments.
- Horizontal or vertical lanes: Creately lets you choose between horizontal or vertical swimlanes, providing flexibility in layout depending on the complexity of the process.
- Resize swimlanes: You can easily adjust the width and height of swimlanes to fit the content of your process steps.
2. Drag-and-drop interface
Creately’s drag-and-drop functionality makes it simple to place and organize shapes and symbols within your flowchart. With a wide range of pre-built shapes for processes, decision points, connectors, and more, you can create a clear and structured diagram without any hassle. The user-friendly interface ensures a smooth diagramming experience, even for beginners.
3. Pre-built templates and symbols
Creately provides a selection of pre-designed flowchart templates and an extensive library of industry standard flowchart symbols for cross-functional flowcharts. These templates help speed up the creation process by giving you a solid foundation to start from. You can customize these templates to fit your organization’s specific processes and requirements.
4. Real-time collaboration
Creately excels in team collaboration. Its real-time collaboration feature allows multiple users to work on the same flowchart simultaneously. This means you and your colleagues can collaborate on designing the flowchart, make real-time edits, and leave comments for feedback, improving communication and streamlining the process.
5. Customizable shapes and styles
Creately offers a wide range of shapes, symbols, and styles that can be tailored to suit your needs. You can:
- Change colors: Use colors to differentiate between different teams, roles, or process stages.
- Apply text formatting: Add detailed descriptions, annotations, and labels to make the flowchart more informative.
- Adjust line styles: Customize the thickness, shape, and color of connecting lines to highlight specific parts of the process.
6. Export and sharing options
Once your cross-functional diagram is complete, Creately makes it easy to share and export your diagram:
- Sharing: You can generate a shareable link and provide access to stakeholders, collaborators, or team members.
- Export formats: Creately allows you to export your flowchart in a variety of formats, such as PDF, PNG, JPEG, or SVG. This makes it easy to include your flowchart in reports, presentations, or other documentation.
7. AI-assistance with Creately VIZ
Creately VIZ, the AI-powered flowcharting tool, enhances the flowchart creation process by offering automatic suggestions, process insights, and smart diagramming features. It quickly converts text-based descriptions into visual diagrams, suggesting logical flow and appropriate symbols. Creately VIZ also identifies inefficiencies and bottlenecks in processes, offering data-driven suggestions for optimization. With smart diagramming tools, it auto-aligns elements for a cleaner, more professional look, ensuring consistency and readability while speeding up the creation of cross-functional flowcharts.
Conclusion: What Is a Cross Functional Flowchart
Cross-functional flowcharts are valuable tools for visualizing complex processes and improving collaboration across different teams or departments. They help clarify roles, identify inefficiencies, and streamline workflows, making it easier to understand and optimize how tasks are completed.
By following the right steps—defining the process, gathering information, creating swimlanes, and continuously refining your diagram—you can create an effective cross-functional flowchart that enhances communication and drives process improvement. Whether you’re working on a simple project or a large-scale initiative, these flowcharts can play a key role in organizing and improving your processes.
References
Reflan Nuari (2014). SWIM LANE (or CROSS-FUNCTIONAL) DIAGRAMS. Academia.edu. [online] doi:https://doi.org/10239973/5293318/6049990/s200_reflan.
Nabeel Allawi (2020). What is the FlowChart. [online] ResearchGate. Available at: https://www.researchgate.net/publication/342572223_What_is_the_FlowChart.
FAQs About Cross Functional Flowcharts
What are the cross-functional flowchart symbols?
What is the difference between a cross-functional flowchart and a regular flowchart?
How do I represent a task performed by multiple roles in a cross-functional diagram?
How can cross-functional flowcharts aid in problem-solving?
Can cross-functional flowcharts be used for process improvement?
Is there a better alternative to creating a cross-functional chart in Visio?