When a problem arises, finding its root cause can feel like searching for a needle in a haystack. That’s where a fishbone diagram (also called an Ishikawa diagram or cause-and-effect diagram) comes in handy. It’s a simple yet powerful tool that helps teams break down problems into different contributing factors, making it easier to pinpoint the real issue.
But did you know there are different types of fishbone diagrams? Each one is designed to fit specific situations, industries, and problem-solving needs. Whether you’re troubleshooting manufacturing defects, improving business processes, or refining marketing strategies, choosing the right type can make all the difference.
In this guide, we’ll walk through the most common types of fishbone diagrams, explain how they work, and provide real-world examples to help you apply them effectively.
What Is a Fishbone Diagram
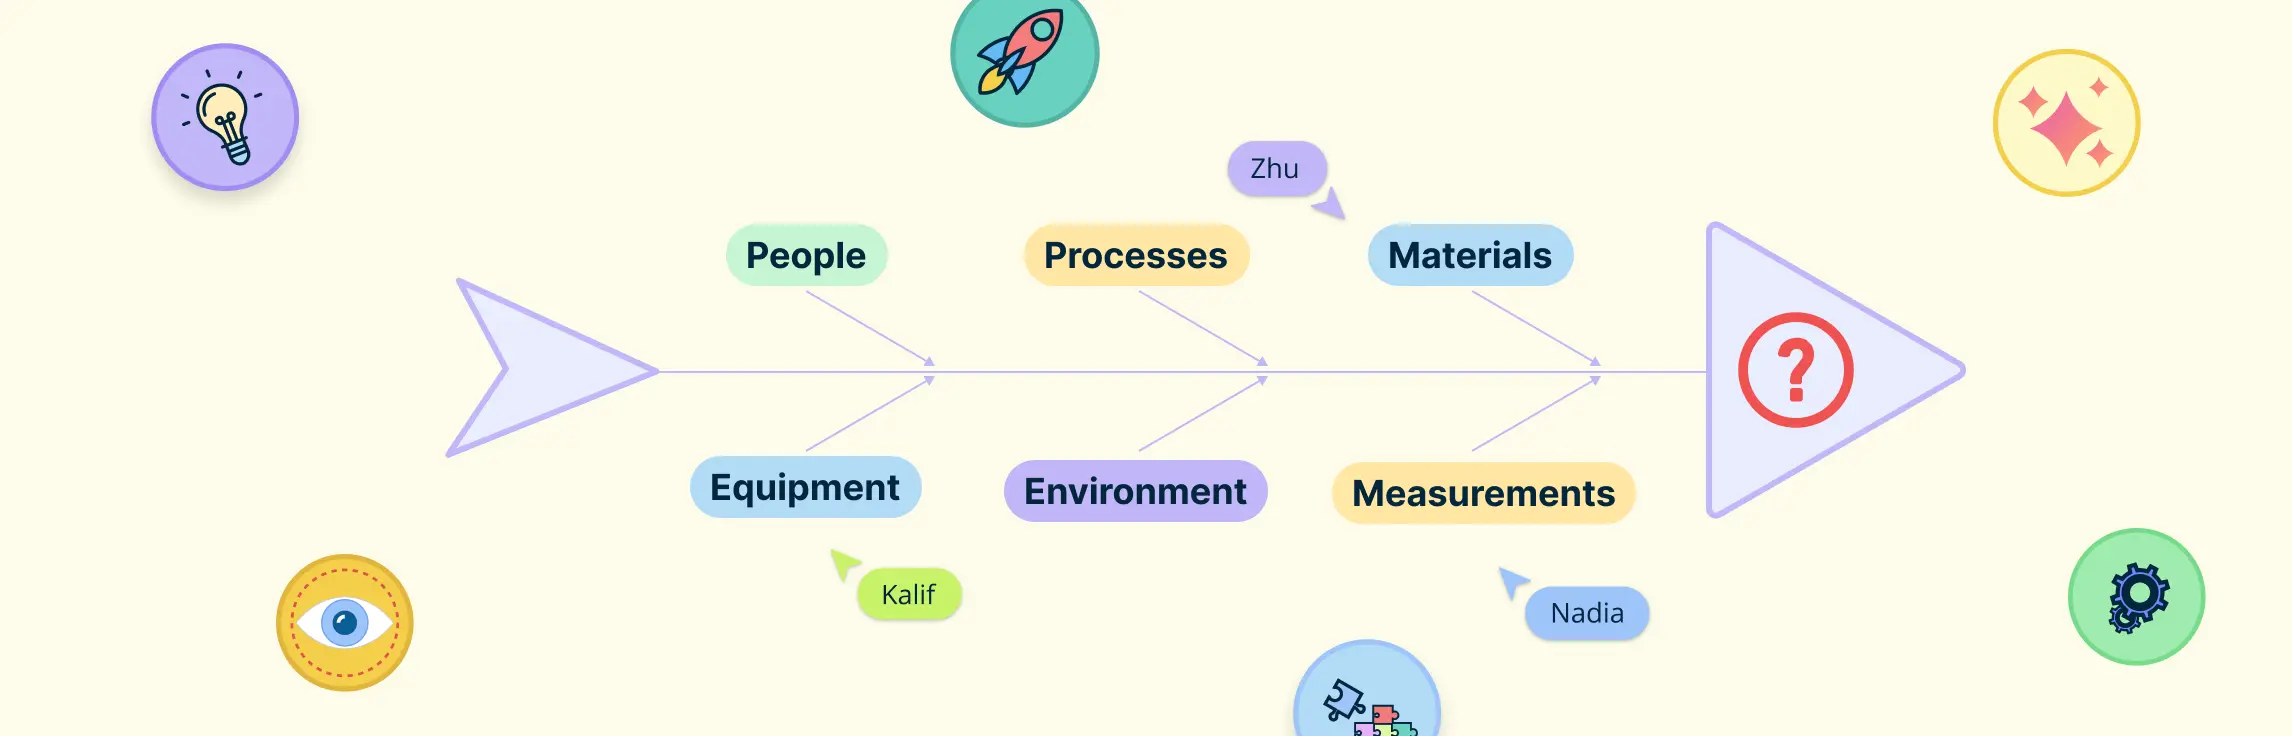
A Fishbone Diagram, also known as an Ishikawa or Cause-and-Effect Diagram, helps identify the root cause of a problem. Shaped like a fish skeleton, the “head” represents the problem, while the “bones” show possible causes.
It organizes factors into categories, making it easier to spot patterns and find real issues. Used in business, healthcare, and education, Fishbone Diagrams help teams focus on solutions rather than just symptoms.


Different Types of Fishbone Diagrams
Fishbone diagrams come in different types, each designed for specific problems and industries. Choosing the right one helps you get to the root cause faster and more effectively. Here are some of the most common types of fishbone diagrams and when to use them:
Type 1: The Simple Fishbone Diagram
The standard fishbone diagram is the most basic and widely used version of this problem-solving tool. It helps teams break down a problem into clear categories, making it easier for the root cause analysis. Since it’s simple and flexible, businesses, healthcare professionals, educators, and engineers all use it to tackle issues in their fields.

How it works
The diagram is shaped like a fish skeleton:
- The head represents the main problem or effect you’re trying to analyze.
- The bones branching out from the spine represent different categories of possible causes.
- Each category can be further broken down into more specific causes until patterns start to emerge.
Common cause categories
The standard fishbone diagram doesn’t have fixed categories, but common ones include:
- People – Are there human errors, skill gaps, or miscommunications?
- Processes – Are workflows inefficient or outdated?
- Materials – Are the resources or supplies faulty or low quality?
- Equipment – Are tools, machines, or software causing the issue?
- Environment – Are external factors like weather, regulations, or culture playing a role?
Type 2: The 4S Fishbone Diagram
The 4S Fishbone Diagram is a streamlined version of the traditional fishbone diagram, mainly used in service industries, business operations, and process improvement. It focuses on four key categories that commonly impact performance: Surroundings, Suppliers, Systems, and Skills.
When to use it: This method is particularly helpful in non-manufacturing settings like healthcare, retail, hospitality, and customer service, where the causes of issues are often related to people, processes, or external factors rather than machinery or raw materials.

Breaking down the 4S categories
Each “S” represents a critical area that can contribute to a problem. By analyzing these categories, teams can uncover root causes and develop effective solutions.
1. Surroundings
This is the environment where the service happens, like the store’s cleanliness, layout, or atmosphere. Problems here might be things like poor lighting or uncomfortable seating.
- Is the workplace safe and organized?
- Are environmental factors (lighting, noise, temperature) affecting performance?
- Are external influences like competition or regulations causing problems?
2. Suppliers
Supplies are the materials or tools needed to provide the service. If there are shortages, damaged items, or broken equipment, it can disrupt the service.
- Are vendors providing reliable services or products?
- Are delays or inconsistencies from suppliers causing issues?
- Are supplier contracts and expectations clearly defined?
3. Systems
Systems are the processes used to deliver the service. If these processes are slow or disorganized, it can lead to delays or mistakes.
- Are internal processes efficient and well-documented?
- Are there bottlenecks in workflow?
- Are outdated systems or software slowing things down?
4. Skills
Skills refer to how well the staff is trained or their abilities. If employees don’t have the right skills, it can affect the quality of the service.
- Do employees have the necessary skills for their tasks?
- Is training adequate and up to date?
- Are communication or teamwork issues affecting performance?
Type 3: The 8P Fishbone Diagram
The 8P fishbone diagram, also known as the marketing fishbone diagram, is widely used in service industries, business operations, and process improvement. It builds upon the traditional fishbone diagram by categorizing potential causes into eight key areas: product, price, place, promotion, people, process, physical evidence, and performance. This structured approach makes it especially useful in marketing, retail, and customer service, where multiple factors influence business success. By analyzing these categories, organizations can pinpoint challenges related to branding, customer experience, and operational efficiency, leading to more effective problem-solving and strategy development.

When to use it: This method is especially useful in marketing, retail, customer service, and business strategy, where problems often stem from a mix of internal and external factors rather than just production issues.
Breaking Down the 8P Categories
Each “P” represents a key area that could be contributing to a problem. By analyzing these categories, businesses can pinpoint root causes and improve their strategies.
1. Product
Product is what the business offers, such as goods or services. It’s important that the product is high quality and meets customer needs. Problems can arise if the product doesn’t live up to expectations.
- Is the product meeting customer needs?
- Are there quality or design issues?
- Is there enough variety or customization?
2. Price
Price is what customers pay for the product or service. The price should reflect the value of the product while being competitive. If the price is too high or low, it can impact sales and customer satisfaction.
- Is the pricing competitive?
- Are customers finding it too expensive or too cheap?
- Are there hidden costs or unclear pricing structures?
3. Place
Place is how the product gets to customers. This includes both physical locations and online channels. The product must be easy to access, and distribution issues can cause delays or lost sales.
- Are products/services easy to find and purchase?
- Are there supply chain issues causing delays?
- Is the location or online presence effective?
4. Promotion
Promotion involves how the business markets and advertises its products. This can include ads, promotions, and public relations. If promotional efforts aren’t reaching the right audience, the business may not attract enough customers.
- Is the marketing strategy effective?
- Is the message clear and reaching the right audience?
- Are there issues with ad placement or branding?
5. People
People refer to the staff and customers. It includes customer service, training, and engagement. If employees aren’t well-trained or customer service isn’t up to par, customers may not be happy.
- Are employees well-trained and engaged?
- Is customer service efficient?
- Are there staffing shortages affecting service?
6. Process
Process is about how the business operates and delivers its products or services. If processes are slow or inefficient, it can lead to delays and a poor customer experience.
- Are workflows smooth and efficient?
- Are there bottlenecks slowing down service?
- Is there a lack of standardization?
7. Physical evidence
Physical evidence includes the things customers see and interact with, such as store design, packaging, and online presence. Everything should reflect the brand’s image and create a positive experience.
- Does the business create a strong brand image?
- Is the store, website, or packaging appealing and professional?
- Are customer reviews and testimonials positive?
8. Performance
Performance is about tracking the business’s results, like sales or customer satisfaction. By measuring performance, businesses can see if they are meeting their goals and find areas that need improvement.
- Are key business goals being met?
- Is revenue or customer satisfaction declining?
- Are there recurring quality or service issues?
Note: Some variations of the 8P Fishbone Diagram include an additional factor like Policies, which focuses on the internal rules and guidelines governing a business’s operations. This category could cover issues related to how company policies affect service delivery, customer satisfaction, or employee performance.
Type 4: 6M Fishbone Diagram
The 6M Fishbone Diagram is one of the most widely used types of fishbone diagrams, especially in manufacturing, production, and quality control. It helps teams identify the root causes of problems by organizing them into six key categories: Manpower, Method, Machine, Material, Measurement, and Mother Nature (Environment).

When to use it: This structured approach makes it easier to analyze issues, spot patterns, and find solutions, rather than relying on guesswork. It’s particularly useful for companies that want to improve efficiency, reduce defects, and maintain high-quality standards.
Breaking down the 6M categories
Each “M” represents a different area where problems can arise. By investigating each category, teams can uncover hidden causes and address them effectively.
1. Manpower
This refers to the people involved in the process. It includes their skills, training, and performance. Problems here could include workers being under-trained, lacking experience, or not following procedures properly.
- Are employees properly trained?
- Is there a communication gap between teams?
- Are workers following the correct procedures?
- Is there a staffing shortage affecting productivity?
2. Method
This focuses on the processes or procedures used to do the work. Problems might arise if the method is inefficient, outdated, or not followed consistently, leading to mistakes or delays.
- Are procedures outdated or inefficient?
- Are steps being skipped in the workflow?
- Are there unnecessary delays in the process?
- Is there a lack of standardization in how tasks are done?
3. Machine
This category is about the equipment, tools, and machines used in production. Issues can occur if the machines are broken, outdated, poorly maintained, or not suitable for the task at hand.
- Are machines or tools breaking down frequently?
- Is the equipment outdated or in need of maintenance?
- Are there calibration issues affecting precision?
- Are the wrong tools being used for the job?
4. Material
This involves the raw materials or components used in production. Problems can happen if the materials are of poor quality, damaged, or not available in the right quantities, which can affect the final product.
- Are materials of poor quality or defective?
- Are there supply chain delays affecting production?
- Are the right materials being used for the job?
- Are there inconsistencies in material quality?
5. Measurement
This refers to the data or measurements used in the process, such as quality checks or production counts. Issues can arise if the measurements are inaccurate, inconsistent, or not properly recorded.
- Is the data being recorded accurately?
- Are measurement tools properly calibrated?
- Are quality control standards being followed?
- Are incorrect assumptions affecting decisions?
6. Mother nature
This category looks at external factors that could affect the process, such as weather, temperature, or the location of the production facility. Environmental conditions can impact product quality or the efficiency of the process.
- Is weather affecting production or deliveries?
- Are temperature or humidity levels impacting materials?
- Are workplace conditions affecting employee performance?
- Are external regulations causing delays?
Choosing the Right Types of Fishbone Diagrams
When selecting the right type of Fishbone Diagram for your problem, it’s important to consider the nature of the issue you’re addressing and the industry you’re in. Different types of Fishbone Diagrams are better suited to specific types of problems, so understanding these factors will help you make a more effective decision.
Here are some key things to consider:
Problem type
Think about the nature of the issue you’re facing. Are you solving a quality control problem in a manufacturing process? Or are you addressing issues in a service-oriented business like marketing or customer service? Different Fishbone Diagrams are designed to explore different categories of potential causes.

Industry
Certain industries have unique challenges. For example, the 6M Fishbone Diagram is a common choice in manufacturing, whereas the 8P Fishbone Diagram is ideal for service industries and business strategy problems. Consider what categories will help you most in identifying the causes.
Scope of the problem
If you are looking for a general overview of causes, a Standard Fishbone Diagram may be sufficient. For a more specific problem, like quality issues, the 6M Fishbone Diagram might be the better option.
Complexity of the problem
If the problem has multiple contributing factors, a more detailed diagram like the 8P or 4S model may be necessary. Simpler issues may only require a standard fishbone diagram.
Data availability
If you have extensive data on potential causes, choosing a fishbone diagram that allows for deeper categorization (such as the 6M model) can help structure and analyze the data effectively.
Team involvement
Consider how many people are involved in the problem-solving process. A more structured diagram, like the 6M, can help facilitate discussions in large teams, while a simpler diagram may work better for smaller groups.
By matching the problem with the right diagram, you can more easily identify the root causes and take action.
Create Your Fishbone Diagram with Creately
Creating a Fishbone Diagram doesn’t have to be complicated. With Creately’s Fishbone diagram maker, you can easily design and customize your diagram to identify the root cause of any problem. Whether you’re working on a quality control issue, a marketing challenge, or a business strategy improvement, Creately provides all the tools you need to visualize causes and solutions clearly.
Pre-made templates
Get a head start with professionally designed fishbone diagram templates for different types of fishbone diagrams, including 6M, 8P, and more. Instead of starting from scratch, choose a template that fits your needs and customize it to match your specific problem.
Drag-and-drop interface
Easily build and organize your fishbone diagram with a simple drag-and-drop feature. You can add causes, sub-causes, and categories effortlessly, allowing you to focus on problem-solving rather than struggling with formatting.
Collaboration in real-time
Work with your team instantly, no matter where they are. Multiple users can edit the diagram at the same time, making it easy to brainstorm, share insights, and refine ideas together. This ensures that everyone’s input is included, leading to a more thorough root cause analysis.
Customizable shapes and text
Personalize your fishbone diagrams by adjusting shapes, colors, fonts, and text styles. Whether you need a professional-looking diagram for a presentation or a more visual layout for internal discussions, Creately gives you full control over the design.
Sticky notes for brainstorming
Capture ideas and insights before finalizing your diagram by using sticky notes. These digital notes help teams jot down possible causes, refine ideas, and organize information before committing to a final structure.
Extensive shape libraries
Access a wide variety of industry-standard shapes and symbols to create fishbone diagrams that suit different fields, from manufacturing to marketing. This flexibility ensures that your diagram is clear and relevant to your industry.
Easy sharing
Share your fishbone diagrams effortlessly with team members, clients, or stakeholders. You can send a simple link for online access or export your diagram in multiple formats like PNG, PDF, or SVG for presentations, reports, or documentation.
Comments and annotations
Improve communication within your team by adding comments and notes directly on the diagram. This feature allows you to provide explanations, highlight key points, or give feedback without cluttering the main diagram.
Interactive presentation mode
Make your diagrams more engaging by presenting them interactively. Instead of using static images, you can zoom in, highlight sections, and navigate through different parts of your fishbone diagram smoothly during meetings or brainstorming sessions.
Conclusion: Types of Fishbone Diagrams
Understanding the Types of Fishbone Diagrams is a valuable tool for identifying the root causes of problems in any industry. Whether you’re solving production issues, improving customer service, or refining business strategies, there’s a fishbone diagram that can help guide your problem-solving process. By choosing the right type of diagram—whether it’s the Standard Fishbone, 6M Fishbone, 8P Fishbone, or another variation—you can focus your efforts on the areas that need the most attention.
Each type of fishbone diagram is designed to address specific challenges, so it’s important to consider your problem’s scope, the industry you’re in, and the key categories that influence your results. A well-chosen diagram can help you uncover insights and make smarter, more effective decisions for improvement.
In the end, the goal is to get to the root cause of the problem, and with the right type of fishbone diagram, you’ll be equipped to identify solutions that lead to meaningful progress.
References
ResearchGate. (n.d.). (PDF) Application Of Fishbone Diagram To Determine The Risk Of An Event With Multiple Causes. [online] Available at: https://www.researchgate.net/publication/46567642_Application_Of_Fishbone_Diagram_To_Determine_The_Risk_Of_An_Event_With_Multiple_Causes.
Sakdiyah, S.H., Eltivia, N. and Afandi, A. (2022). Root Cause Analysis Using Fishbone Diagram: Company Management Decision Making. Journal of Applied Business, Taxation and Economics Research, 1(6), pp.566–576. doi:https://doi.org/10.54408/jabter.v1i6.103.
Kumah, A., Nwogu, C.N., Issah, A.-R., Obot, E., Kanamitie, D.T., Sifa, J.S. and Aidoo, L.A. (2024). Cause-and-Effect (Fishbone) Diagram: a Tool for Generating and Organizing Quality Improvement Ideas. Innovations Journals, [online] 7(2). doi:https://doi.org/10.36401/jqsh-23-42.
FAQs about the Types of Fishbone Diagrams
What is the purpose of a Fishbone Diagram?
What are the common types of Fishbone Diagrams?
How do I know which Fishbone Diagram to use?
Can a Fishbone Diagram be used for quality improvement?
What are the key categories in the 6M Fishbone Diagram?
Is the 8P Fishbone Diagram useful for businesses outside of marketing?
How do you use a fishbone diagram for root cause analysis?