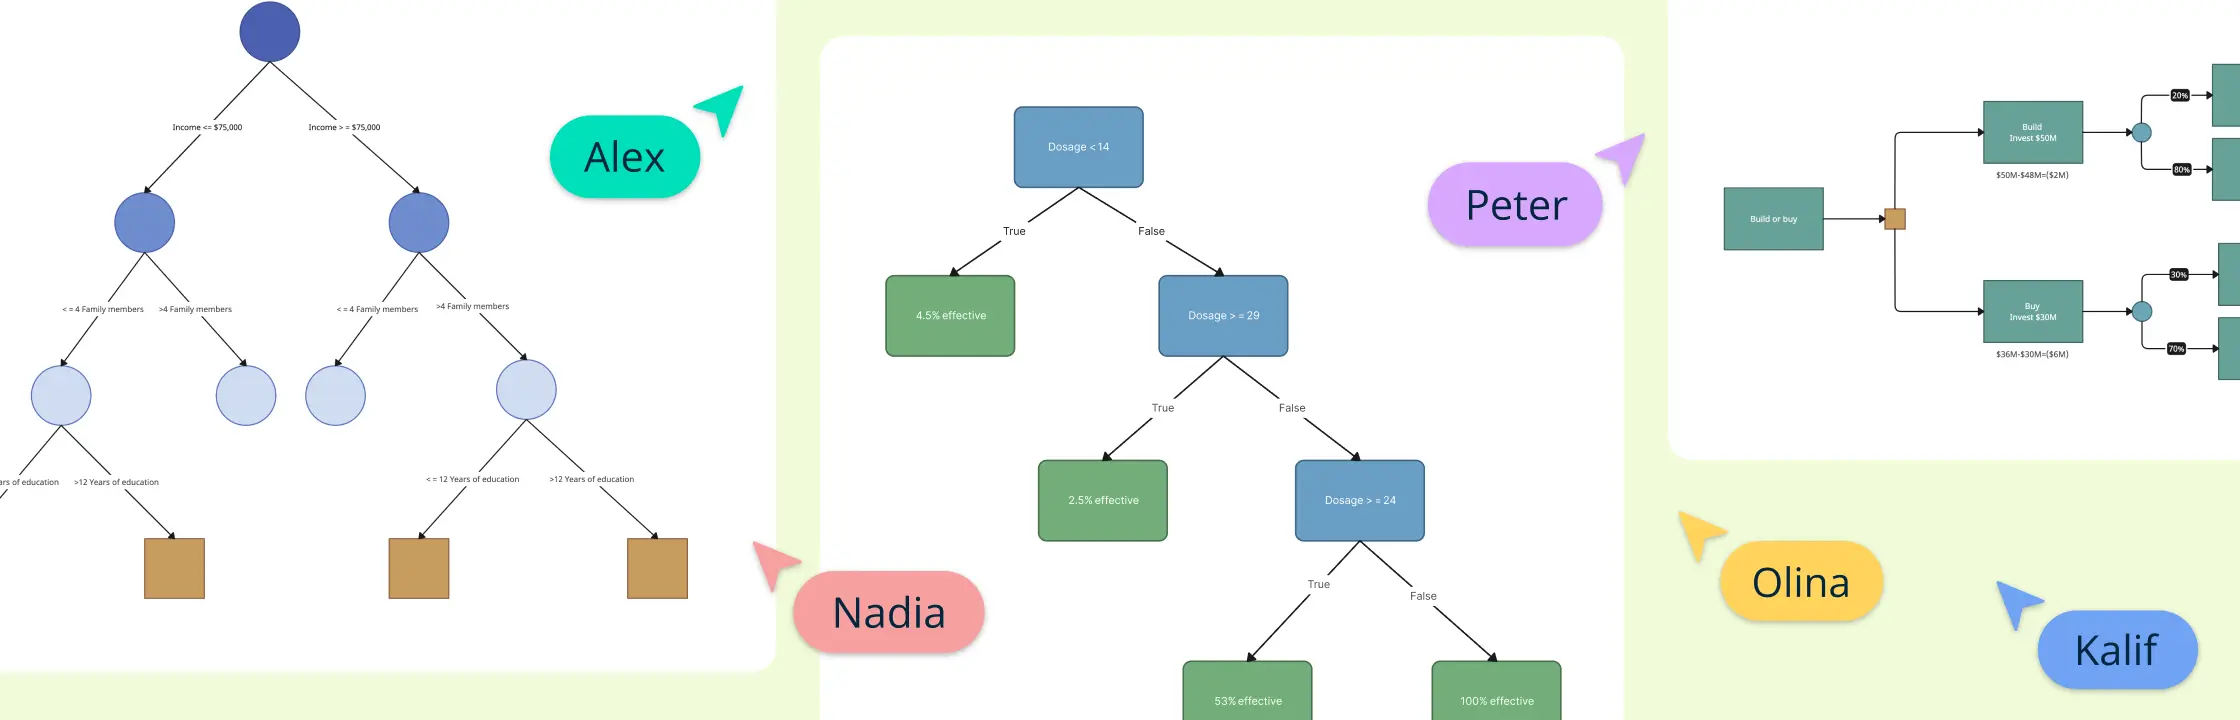
Decision trees are a visual and structured representation of data-driven decisions, resembling a flowchart that begins at a root node and branches into possible outcomes. These tools are widely used in machine learning for tasks like classification and regression, enabling analysts to understand complex input-output relationships by segmenting data into manageable parts.
Why Use Decision Trees?
Decision trees are highly interpretable, intuitive, and easy to explain, making them accessible compared to other machine learning models. They handle non-linear relationships effectively without requiring feature scaling or normalization, making them a reliable tool for predictions and data-driven decision-making.
2 Main Types of Decision Trees
Decision trees can be classified into two main types based on their purpose:
Classification Trees: Binary Decisions
Classification trees categorize outcomes into specific groups by making a series of binary decisions to split the dataset into subsets with similar attributes. Each decision is represented as a node, with branches leading to further conditions and leaf nodes indicating the final class labels.


CART (Classification and Regression Trees) is a key algorithm for building types of decision trees. It identifies the feature that maximizes information gain at each node, creating more homogeneous subsets. This process improves classification accuracy and ensures decision points lead to distinct, meaningful categories.
Types of decision trees, like classification trees, are used in practical applications such as medical diagnostics to identify diseases from patient data, and customer segmentation for personalized marketing. Their simplicity, effectiveness, and ability to provide clear decision rules make them an invaluable tool for predictive tasks and actionable insights.

Regression Trees: Predicting Continuous Values
Regression trees predict continuous numerical outcomes, making them essential for predictive modeling. Unlike classification trees, which handle categorical data, regression trees forecast values like future sales or property prices by analyzing historical datasets and identifying key patterns for accurate predictions.

CHAID (Chi-squared Automatic Interaction Detector) enhances regression trees by performing multiple splits to refine predictions for continuous values. The Reduction in Variance algorithm further improves accuracy by focusing on key nodes.
Choosing the right type of decision tree—classification for categories and regression for continuous data—boosts prediction effectiveness. Creately simplifies this with interactive tools to visualize and build complex models, helping businesses improve decisions and strategic planning with a clear, data-driven framework.

Both types of decision trees are crucial in machine learning for solving diverse data problems, from identifying customer segments to forecasting sales trends.
11 Types of Decision Tree Algorithms
1. Decision Tree Algorithms for Classification
Decision tree algorithms are widely used in classification tasks, providing a clear and intuitive way to make data-driven decisions by splitting data into hierarchical branches based on feature values.
1.1. ID3 (Iterative Dichotomiser 3)
- Purpose: Classification.
- Splitting Criterion: Information Gain (based on entropy).
- Features:
- Works well with categorical data.
- Less efficient for continuous data.
1.2. C4.5
- Purpose: Classification.
- Splitting Criterion: Gain Ratio (an enhancement of Information Gain).
- Features:
- Handles both categorical and continuous data.
- Includes pruning techniques to prevent overfitting.
- Manages missing data effectively.
1.3. CART (Classification and Regression Trees)
- Purpose: Classification and regression.
- Splitting Criterion: Gini Impurity for classification.
- Features:
- Binary splits only.
- Straightforward yet highly effective for most use cases.
1.4. CHAID (Chi-squared Automatic Interaction Detector)
- Purpose: Classification.
- Splitting Criterion: Chi-squared statistical significance test.
- Features:
- Allows multi-way splits.
- Commonly used for market research and segmentation.
1.5. QUEST (Quick, Unbiased, Efficient Statistical Tree)
- Purpose: Classification.
- Splitting Criterion: Statistical tests to ensure unbiased splits.
- Features:
- Reduces computational time.
- Effective for unbiased decision-making.
2. Decision Tree Algorithms for Regression
Decision tree algorithms for regression predict continuous outcomes by partitioning data into segments and fitting simple models, such as averages, within each region of the tree.
2.1. CART (Classification and Regression Trees)
- Purpose: Regression and classification.
- Splitting Criterion: Mean Squared Error (MSE) for regression.
- Features:
- Binary splits at each node.
- Handles both tasks efficiently.
2.2. MARS (Multivariate Adaptive Regression Splines)
- Purpose: Regression.
- Features:
- Uses hinge functions to model non-linearity.
- A flexible extension of regression trees.
3. Ensemble and Advanced Decision Tree Algorithms
Ensemble and advanced decision tree algorithms combine multiple decision trees or enhance traditional methods to improve prediction accuracy and handle complex datasets effectively.
3.1. Random Forest
- Purpose: Classification and regression.
- Features:
- Combines multiple decision trees for better accuracy.
- Reduces overfitting by aggregating results.
3.2. XGBoost (eXtreme Gradient Boosting)
- Purpose: Classification and regression.
- Features:
- Ensemble of gradient-boosted decision trees.
- Highly scalable and efficient.
- Built-in regularization to prevent overfitting.
3.3. LightGBM (Light Gradient Boosted Machine)
- Purpose: Classification and regression.
- Features:
- Faster and more memory-efficient than XGBoost.
- Uses histogram-based splitting techniques.
3.4. H2O GBM
- Purpose: Classification and regression.
- Features:
- Distributed and scalable for large datasets.
- High-speed implementation of gradient-boosted trees.
Types of Decision Trees: Strengths and Limitations
Here’s a table summarizing the types of decision trees, along with their strengths and limitations:
| Type of Decision Tree | Strengths | Limitations |
|---|---|---|
| Classification Tree | - Excellent for categorizing data into predefined classes. | - Can overfit with complex datasets. |
| - Easy to interpret results. | - Struggles with continuous target variables. | |
| - Handles both categorical and numerical data. | ||
| Regression Tree | - Ideal for predicting numerical or continuous outputs. | - Sensitive to small changes in data. |
| - Handles non-linear relationships effectively. | - May require pruning to avoid overfitting. | |
| CART (Classification and Regression Tree) | - Combines classification and regression capabilities. | - May produce biased splits if not properly tuned. |
| - Supports binary splitting for better decision-making. | - Computationally expensive for large datasets. | |
| ID3 (Iterative Dichotomiser 3) | - Uses information gain for accurate feature selection. | - Cannot handle numerical data directly. |
| - Suitable for small datasets with categorical variables. | - Prone to overfitting with noise in the data. | |
| Random Forests | - Reduces overfitting by averaging multiple decision trees. | - Difficult to interpret individual trees. |
| - Works well with large datasets. | - Requires significant computational power. | |
| - Handles missing values effectively. | ||
| C4.5 | - Improves upon ID3 by handling both categorical and continuous data. | - Computationally intensive for large datasets. |
| - Prunes trees to avoid overfitting. | - Less accurate on highly noisy data. | |
| CHAID (Chi-squared Automatic Interaction Detector) | - Great for market segmentation and statistical analysis. | - Not ideal for small datasets. |
| - Handles multi-way splits, improving interpretability. | - Assumes linear relationships. | |
| Decision Stump | - Simple and fast for one-level decision-making. | - Limited predictive accuracy. |
| - Works well as a weak learner in ensemble models. | - Overly simplistic for complex datasets. |
Decision trees are a foundational tool in machine learning and data analysis, offering unique strengths and some limitations. A clear understanding of these aspects is essential for making informed decisions about their application.
Advantages of Decision Trees
- Simplicity and Interpretability Decision trees are highly intuitive, presenting data in a visual, straightforward format. Their transparency allows even non-technical stakeholders to easily interpret the results without delving into complex algorithms.
- Versatility Decision trees can handle a wide range of tasks, including classification and regression problems. They are equally effective with both numerical and categorical data, making them applicable across various domains.
- No Need for Feature Scaling Unlike many machine learning models, decision trees do not require feature scaling or normalization. They can process raw, unprocessed data directly, saving time and effort in preprocessing.
Disadvantages of Decision Trees
- Overfitting: Decision trees are prone to overfitting, especially when they become too complex. This can result in capturing noise instead of actual data patterns, reducing performance on new, unseen data.
- Bias Towards Multi-level Features: Trees may favor features with multiple levels or categories, potentially skewing predictions and reducing model accuracy.
- Instability: Decision trees are highly sensitive to small changes in the dataset. Even minor variations can lead to significant changes in the tree structure, making them less robust in dynamic data environments.
Comparing Types of Decision Trees with Other Algorithms
Compared to other machine learning models, decision trees excel in their interpretability and accessibility. While more complex algorithms like neural networks may perform better on intricate, non-linear relationships, they lack the transparency of decision trees. For example:
- Decision Trees: Ideal for scenarios requiring explainability, such as regulatory compliance.
- Neural Networks: Better suited for complex problems but operate as black-box models with less interpretability.

Here’s a comparative table between decision trees and neural networks:
| Aspect | Decision Trees | Neural Networks |
| Interpretability | High – Easy to understand and visualize | Low – Operates as a black-box model |
| Complexity Handling | Effective for simpler, linear to moderately complex problems | Excels at handling complex, non-linear relationships |
| Feature Requirements | No feature scaling needed | Requires feature scaling and normalization |
| Training Time | Faster to train, especially with smaller datasets | Slower to train, particularly with large datasets |
| Overfitting | Prone to overfitting, especially with deep trees | Less prone to overfitting, but can occur with improper tuning |
| Robustness | Sensitive to small changes in data (instability) | More stable in handling noise and large datasets |
| Use Cases | Ideal for applications requiring clear explanation (e.g., regulatory compliance) | Suited for complex prediction tasks (e.g., image recognition, speech processing) |
| Performance | Adequate for simpler tasks, may underperform with high-dimensional data | High performance on complex, high-dimensional data |
| Deployment | Easier to implement and maintain | Requires more resources and infrastructure for deployment |
Practical Applications of Types of Decision Trees
Decision trees are particularly valuable in situations where explainability is crucial. For instance, in regulatory compliance, they outperform black-box methods like deep learning by providing clear, interpretable decision-making structures.
While decision trees have some limitations, their ease of use, interpretability, and adaptability make them indispensable in many analytical toolkits. Exploring algorithm comparisons and understanding specific use cases can help maximize their potential in solving data-driven problems.
Healthcare and Diagnostic Tools
In healthcare, decision trees are essential for improving diagnostic accuracy and personalizing treatment. By analyzing variables like patient history, symptoms, and lab results, decision trees help in predicting diseases and tailoring treatment paths. This enhances diagnostic precision, optimizes resource allocation, and supports healthcare systems like health informatics and electronic health records. Tools like Creately’s Decision Tree Example help healthcare professionals visualize and compare treatment options, promoting collaboration for integrated care.

Financial Modeling and Risk Assessment
Decision trees are vital in finance for risk management and decision-making, especially in credit scoring, investment decisions, and asset pricing. They break down complex financial scenarios into manageable components, helping analysts assess risks and returns. In credit scoring, decision trees forecast default probabilities, aiding informed lending decisions. Financial institutions use them for portfolio optimization and regulatory compliance. Tools like Creately’s Decision Tree Analysis Template assist in financial modeling with interactive dashboards, streamlining strategy development.

Marketing and Customer Segmentation
In marketing, decision trees help businesses analyze customer behavior, segment audiences, and tailor marketing campaigns. By examining purchasing habits, demographics, and preferences, decision trees predict customer responses to products and services. This allows marketers to optimize engagement strategies and target advertising for maximum impact. Creately’s visual workspace aids marketers in constructing and interpreting decision paths, aligning initiatives with business objectives.

Creately as a Decision-Making Tool
Creately is a highly versatile visual collaboration tool that can be effectively utilized as a decision tree diagram maker in various scenarios. Its flexibility and robust features make it ideal for creating and analyzing different types of decision trees and other decision-support visuals. Here’s how Creately supports decision-making processes:
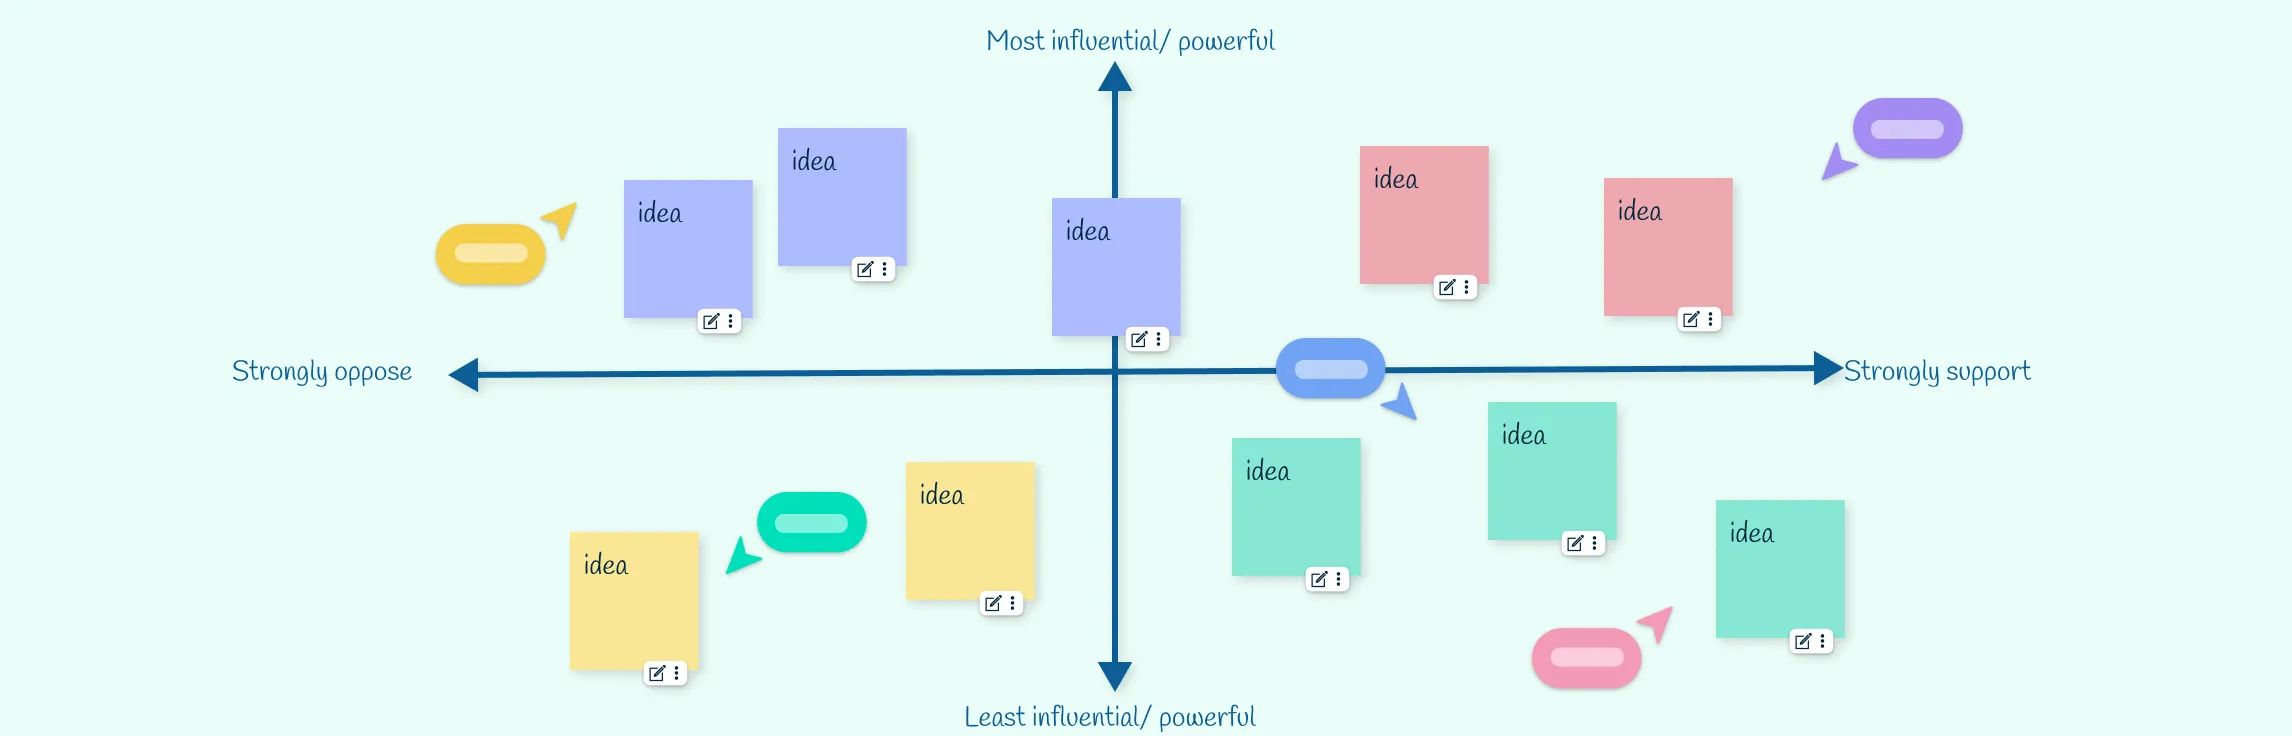
1. Collaborative Environment for Brainstorming
- Creately’s real-time collaboration features make it easier for teams to:
- Brainstorm ideas using mind maps or affinity diagrams.
- Discuss and refine options visually with comments, reactions, or live updates.

- This fosters collective input, ensuring all perspectives are considered before making decisions.
2. Customizable AI-Enhanced Decision Tree Templates
- Access a library of AI-enhanced templates tailored for decision tree creation in areas like business processes and project management workflows.
- Quickly start with pre-built templates that are fully customizable, ensuring visually appealing and logically structured decision trees for any scenario.
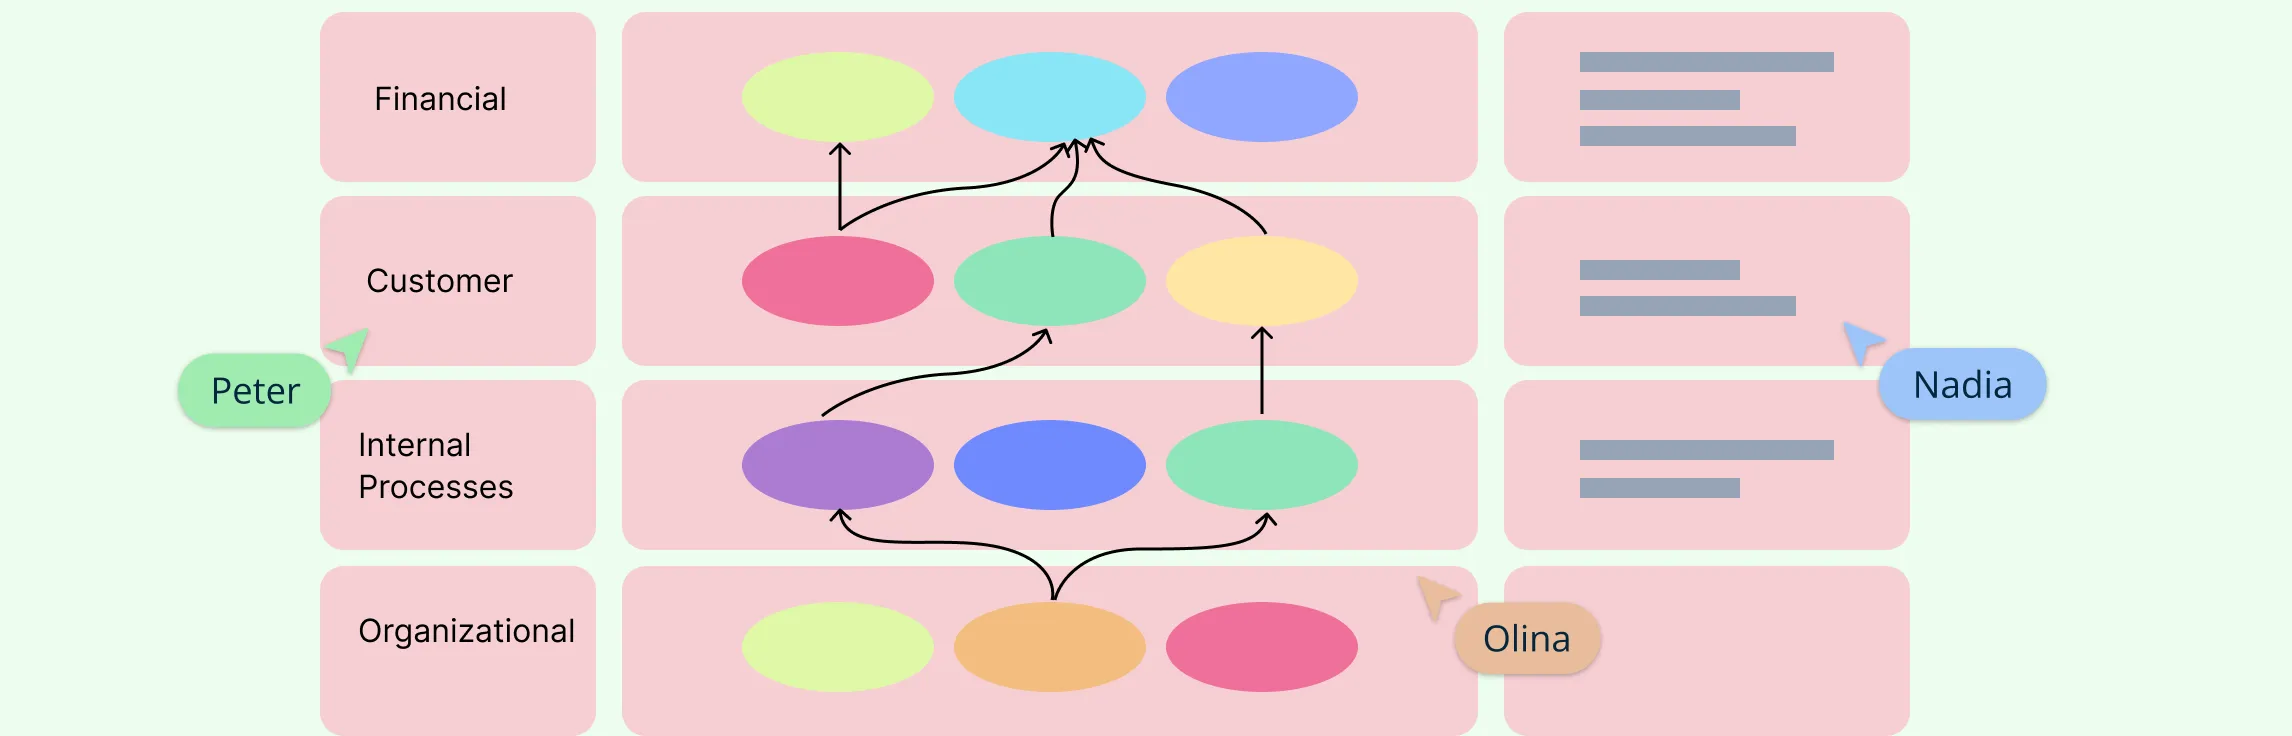
3. Visual Representation of Complex Data
- Creately offers features to create different types of decision trees, flowcharts, or diagrams, allowing teams to visually explore various options and outcomes.
- By mapping out processes, alternatives, or dependencies, decision-makers can clearly identify the pros and cons of each choice.
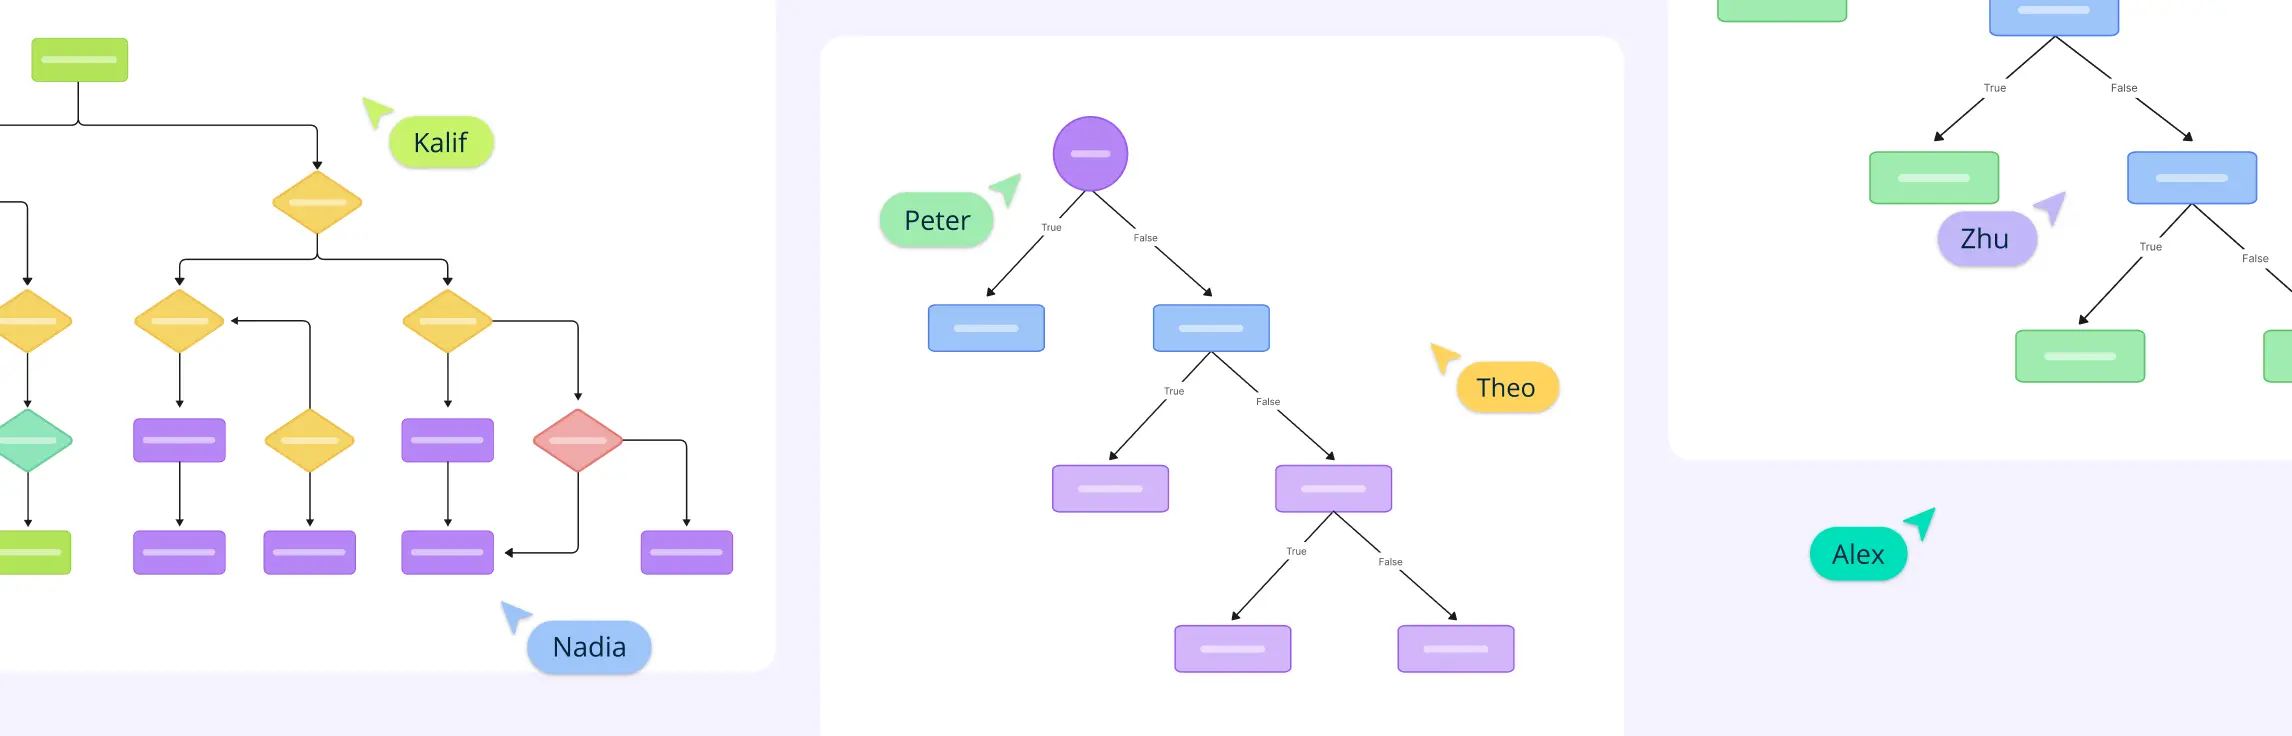
4. Scenario Planning with Diagrams
- Decision trees in Creately are perfect for scenario planning, enabling users to:
- Break down complex decisions into branches of possible outcomes.
- Compare scenarios across various types of decision trees to anticipate the impact of different paths, helping to choose the most favorable scenario.
5. Tracking Progress and Outcomes
- By using Kanban boards, Gantt charts, or workflow diagrams, decision-makers can monitor the implementation and outcomes of decisions.

- Visual status updates help stakeholders stay aligned, ensuring smoother execution of chosen strategies.
6. Problem-Solving with Root Cause Analysis
- Tools like Fishbone Diagrams (Ishikawa) or 5 Whys Templates help teams identify root causes of issues and make informed decisions to address them effectively.

- By using these tools alongside specific types of decision trees, teams can enhance problem-solving processes and drive better results.
Use Cases
- Business Strategy Development: Map out strategic options using SWOT or scenario diagrams, including various types of decision trees.
- Project Management: Visualize decision milestones using workflows or Gantt charts.
- Process Optimization: Use flowcharts to evaluate bottlenecks and decide on process improvements.
- Risk Assessment: Leverage decision trees to analyze potential risks and mitigation strategies, comparing different types of decision trees for the best approach.
Creately stands out because it combines visual clarity, collaborative capabilities, and ease of use, making it an excellent choice for teams and individuals making informed decisions. Whether you’re analyzing complex processes or comparing types of decision trees, Creately ensures a seamless decision-making experience.
Conclusion
Decision trees provide a simple yet powerful approach to machine learning and decision-making. Their strengths in interpretability, versatility, and ease of use make them an essential tool in fields like healthcare, finance, and marketing. Despite some limitations, such as overfitting and instability, decision trees remain invaluable for clear, data-driven decision-making. Platforms like Creately enhance their value by providing interactive tools to visualize and optimize decision trees, supporting better collaboration and strategic planning across industries.
Resources
Breiman, L., Friedman, J., Olshen, R., and Stone, C. (1984) Classification and Regression Trees. Belmont, California: Wadsworth International Group. Available at: https://link.springer.com/book/10.1007/978-1-4899-3618-2
Hastie, T., Tibshirani, R., and Friedman, J. (2009) The Elements of Statistical Learning: Data Mining, Inference, and Prediction. 2nd edn. New York: Springer. Available at: https://web.stanford.edu/~hastie/ElemStatLearn/
Safavian, S.R. and Landgrebe, D. (1991) ‘A survey of decision tree classifier methodology’, IEEE Transactions on Systems, Man, and Cybernetics, 21(3), pp. 660–674. Available at: https://ieeexplore.ieee.org/document/97458
FAQs on Types of Decision Trees
What is the purpose of a decision tree?
How does pruning improve a decision tree?
What industries use decision trees?