Knowing how consumers really see your brand is essential, but it’s not always the same as how you see yourself. That’s where a perceptual map helps. It visually shows where your brand sits in the market compared to competitors, revealing gaps, strengths, and opportunities you may not notice on your own. In this guide, you’ll learn what is a perceptual map, why it matters, and the different types you can use to sharpen your marketing strategy and align better with what your audience actually wants.
Perceptual Map Definition
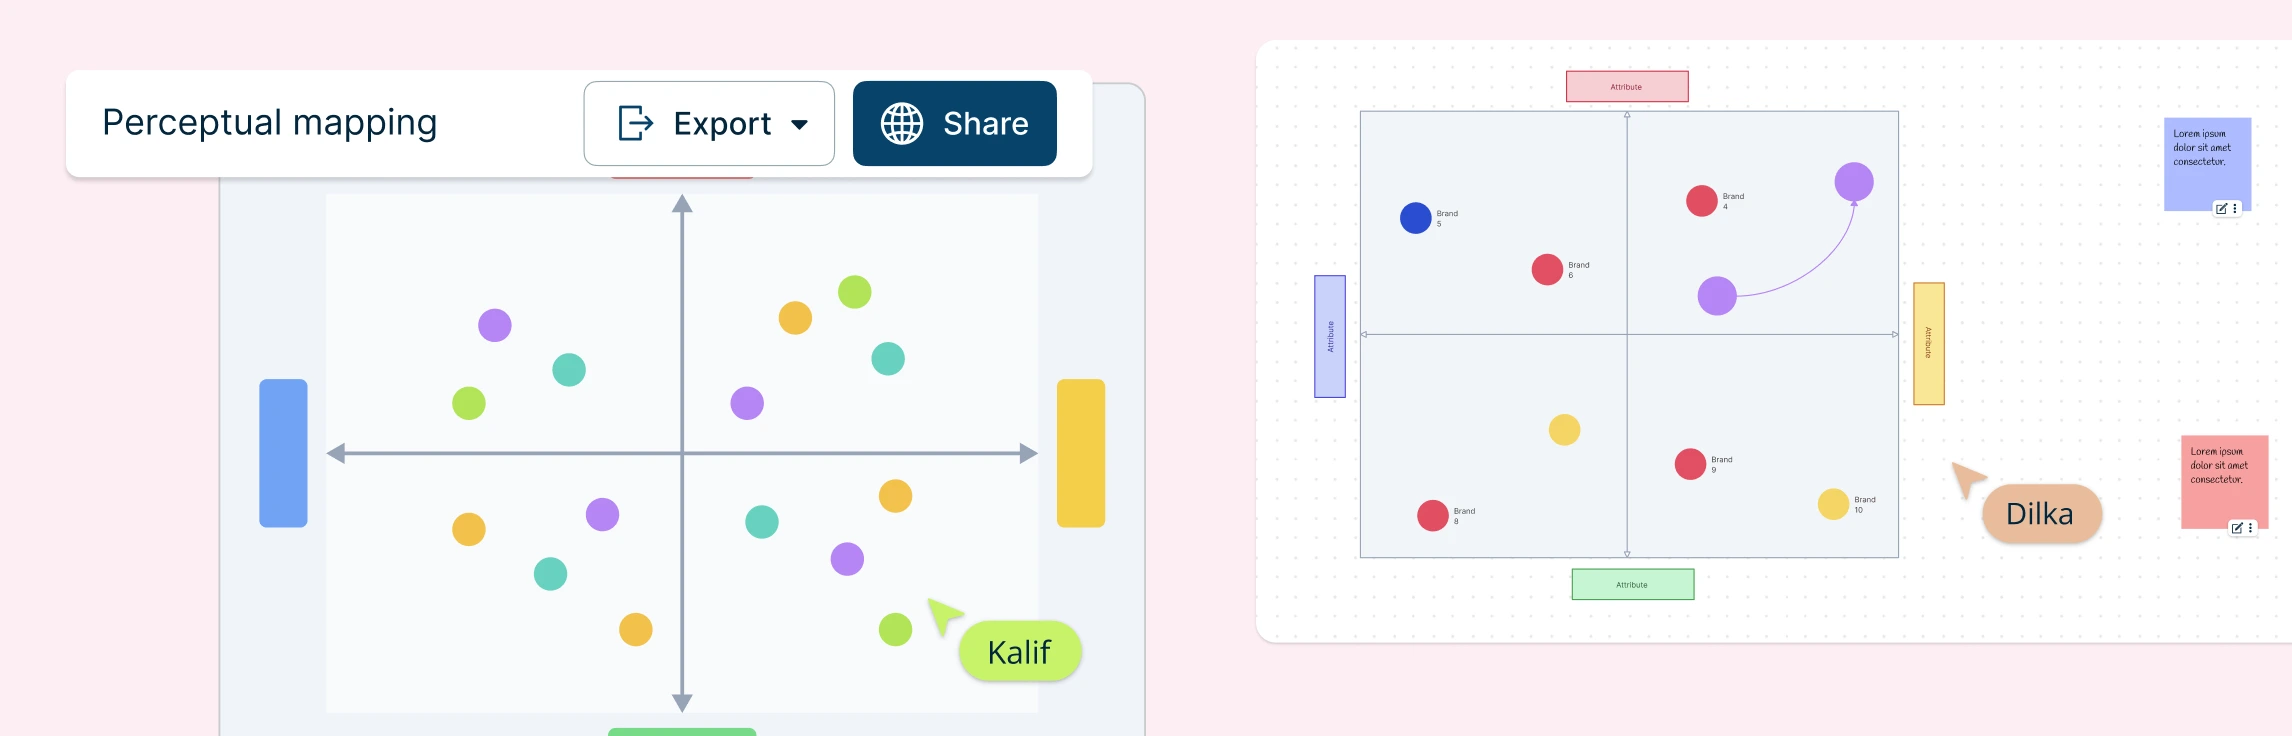
A perceptual map, also known as a perceptual positioning map is a visual representation that helps businesses understand how their products or services are perceived by customers relative to competitors. By plotting various attributes on a two-dimensional grid, companies can gain insights into customer opinions, preferences, and market positioning.
This tool is essential for identifying market gaps, enhancing marketing strategies, and improving product development. Perceptual maps are particularly valuable in marketing and product management as they provide a clear visual of customer perceptions. This allows teams to make data-driven decisions to better align their offerings with market demands.
Importance of a Perceptual Map
A perceptual map gives marketers and product teams a clear, visual way to understand how customers see their brand. They turn customer perceptions into insights you can act on. Here’s why they matter:
Identify Market Gaps: They reveal where your brand sits compared to others, helping you spot unmet needs, new opportunities, or areas where your product can improve.
Measure Campaign Impact: By comparing perceptions before and after a campaign, you can see what actually changed, and use those insights to fine-tune future marketing.
Track Shifts in Consumer Perception: Customer opinions evolve. A perceptual positioning map helps you monitor these changes over time so your strategy stays aligned with what people value.
Stay Ahead of Competitors: They make it easy to see how competing brands are positioned, allowing you to adjust your messaging or product strategy accordingly.
Understand What Consumers Care About: A perceptual map highlights which attributes matter most to your audience, guiding everything from product development to brand messaging.
Want to spot gaps faster, track perception shifts, and stay ahead of competitors? Use Creately’s perceptual map maker to visualize how customers see your brand, compare yourself against competitors, and uncover opportunities.
Types of Perceptual Maps
Perceptual maps come in various forms, each serving unique purposes and offering different insights. Understanding these types can help teams choose the most appropriate map for their needs.
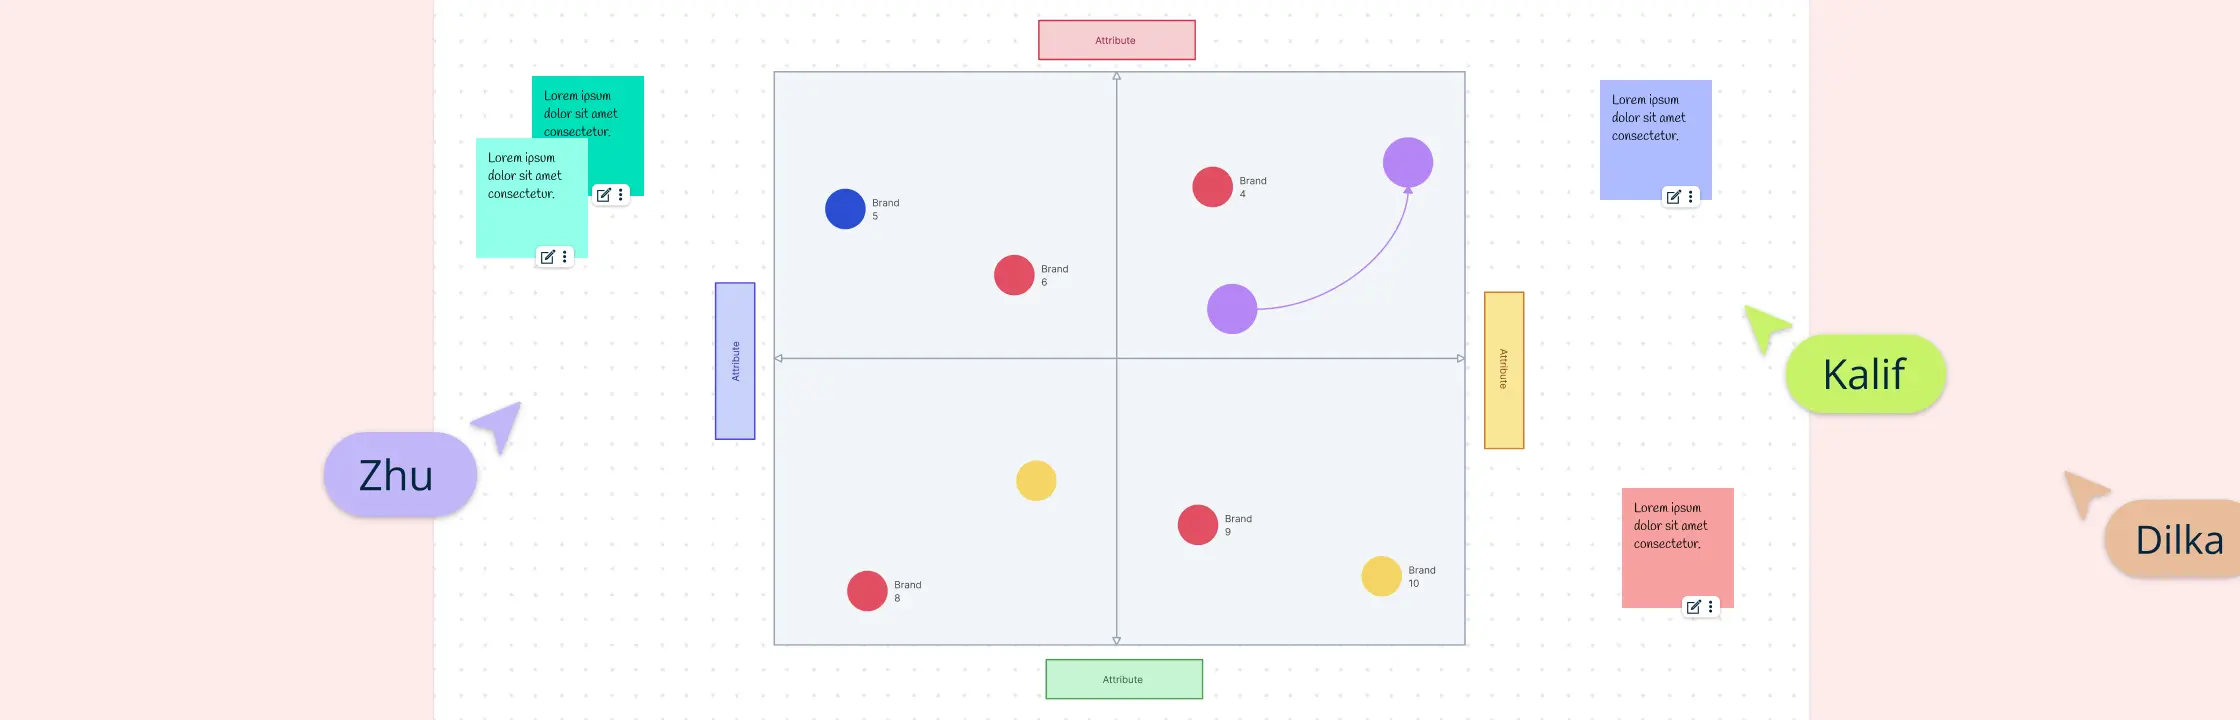
Standard Perceptual Maps
Standard perceptual maps are the most common type. They typically use two dimensions to plot products or brands based on customer perceptions. These maps are straightforward and easy to interpret, making them ideal for quick comparisons and identifying market gaps. For example, a standard perceptual map might plot price on one axis and quality on the other, allowing marketers to see how their brand compares to competitors in terms of these two key attributes.


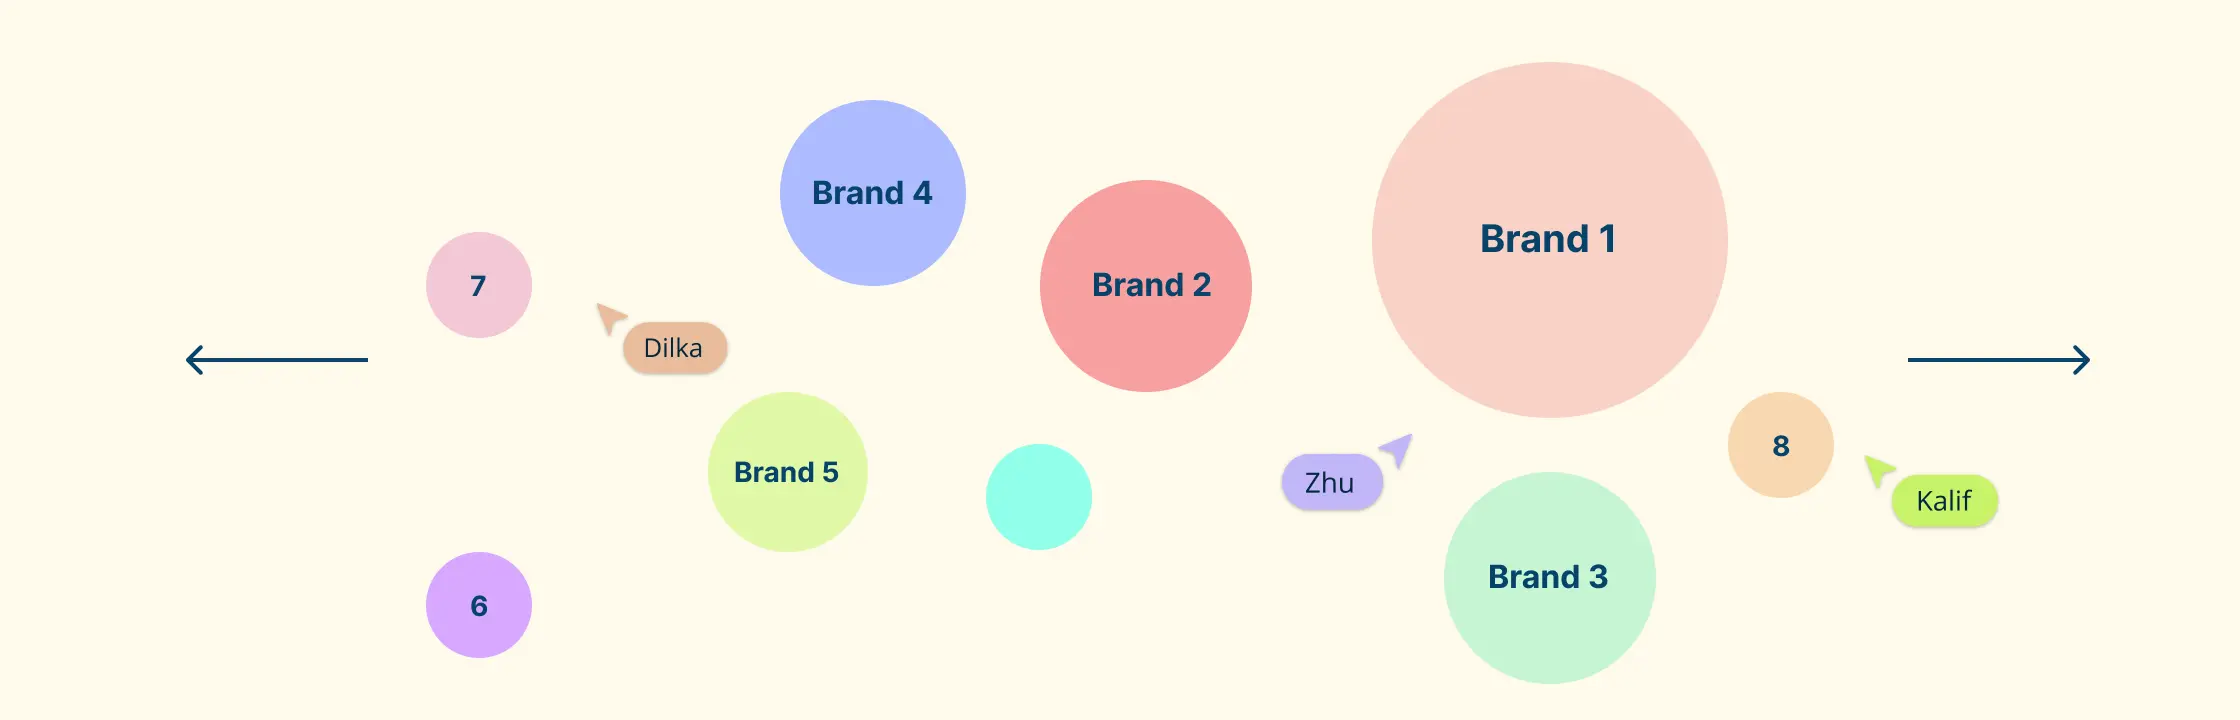
Multidimensional Scaled Perceptual Maps
Multidimensional scaled perceptual maps go beyond the basic two-dimensional approach. They incorporate multiple attributes, providing a more comprehensive view of how products or brands are perceived. This type of map is particularly useful for complex markets where multiple factors influence customer decisions. For instance, a multi-dimensional map might consider factors such as durability, aesthetics, and customer service, offering a richer, more detailed analysis of market positioning.

Want to build one of these maps yourself? Check out our step-by-step guide on how to create a perceptual map to learn how to choose the right map type, plot your data accurately, interpret insights and perceptual mapping tips to improve your market positioning.
When to use Perceptual Maps in Marketing
A perceptual positioning map is an invaluable tool for businesses looking to gain a competitive edge. Here are some key scenarios where they can be beneficial:
New Product Launches: Use perceptual maps to understand where your new product fits among competitors, helping you position it clearly and confidently before going to market.
Marketing Campaigns: Map perception changes before and after a campaign to see what actually shifted, allowing you to refine messaging and strategy for stronger results.
Improving Customer Engagement: Visualize what customers value most so you can tailor experiences, content, and communication that genuinely boost engagement.
Determining Brand Identity: Identify how your brand is currently perceived and use those insights to shape a more aligned and compelling brand identity.
Identifying Market Gaps: Spot open spaces and unmet needs in the market, guiding smarter decisions around new product ideas, differentiation, and positioning.
Free Perceptual Map Templates


How Creately Helps You Visualize Perceptual Maps
Perceptual mapping becomes faster, clearer, and far more collaborative with the right tools. Here’s how Creately supports every step of the process.
Turn Data into Clear Visuals: Easily convert your raw inputs into perceptual maps that are simple to read, compare, and share with your team.
Ready-Made Mapping Frameworks: Start faster with templates that help you structure your perceptual positioning map layout, compare competitors, and analyze key attributes.
Plot Everything on an Interactive Canvas: Use an intuitive drag-and-drop workspace with infinite room to map attributes, explore brand positions, and refine ideas together.
Drag-and-Drop Repositioning: Instantly move brands or attributes around the map as insights change with no manual redrawing required.
Keep Everyone Aligned: Store your perceptual maps in a shared workspace so updates, revisions, and feedback happen in one place without version chaos.
Data-Linked Elements: Attach notes, links, product details, or research findings directly to items on the map for richer context and easier analysis.
Version History: Track how your perceptual positioning map evolves as market perception changes or campaigns roll out, and revert to previous versions anytime.
From Mapping to Strategy: Use Creately’s task and workflow tools to turn insights from your perceptual map into clear next steps, from repositioning ideas to product improvements.
FAQs about Perceptual Maps
How accurate are perceptual maps?
Can perceptual maps have more than two dimensions?
What are the limitations of perceptual maps?
Resources
Kohli, Chiranjeev S., and Lance Leuthesser. “Product Positioning: A Comparison of Perceptual Mapping Techniques.” Journal of Product & Brand Management, vol. 2, no. 4, Apr. 1993, pp. 10–19, https://doi.org/10.1108/10610429310047660.
Lee, Anthony J.T., et al. “Mining Perceptual Maps from Consumer Reviews.” Decision Support Systems, vol. 82, Feb. 2016, pp. 12–25, https://doi.org/10.1016/j.dss.2015.11.002.