Concept maps widely used for brainstorming, planning projects, learning complex subjects, and strategizing in business. While many users try to leverage Microsoft Excel for creating concept maps, Excel despite its strengths in data management—has inherent limitations when it comes to visual diagramming.
How to Create a Concept Map in Microsoft Excel
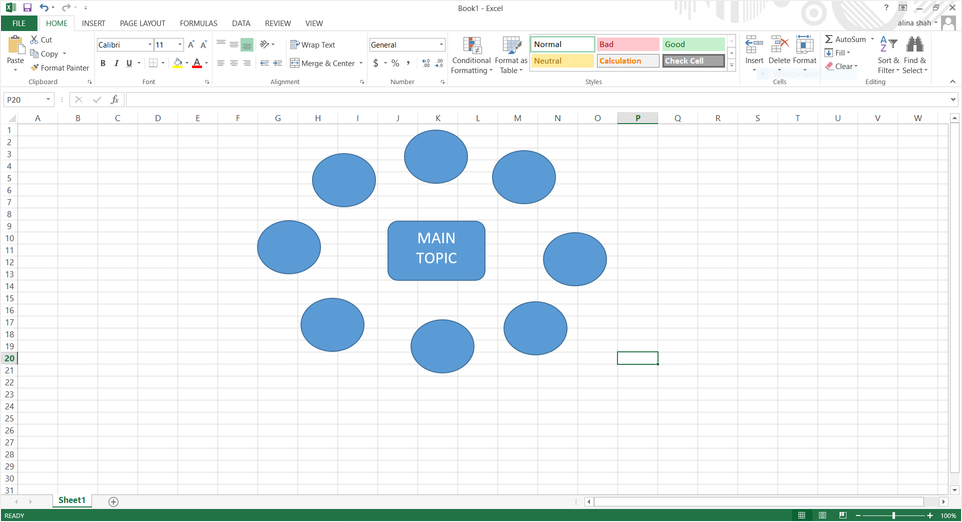
Setting Up Your Excel Workspace
- Open a New Workbook: Start with a clean slate.
- Display Gridlines: Ensure gridlines are visible by checking the View options to help with alignment.
- Access Drawing Tools: Familiarize yourself with Excel’s Shapes tool, which will be essential for creating your map.
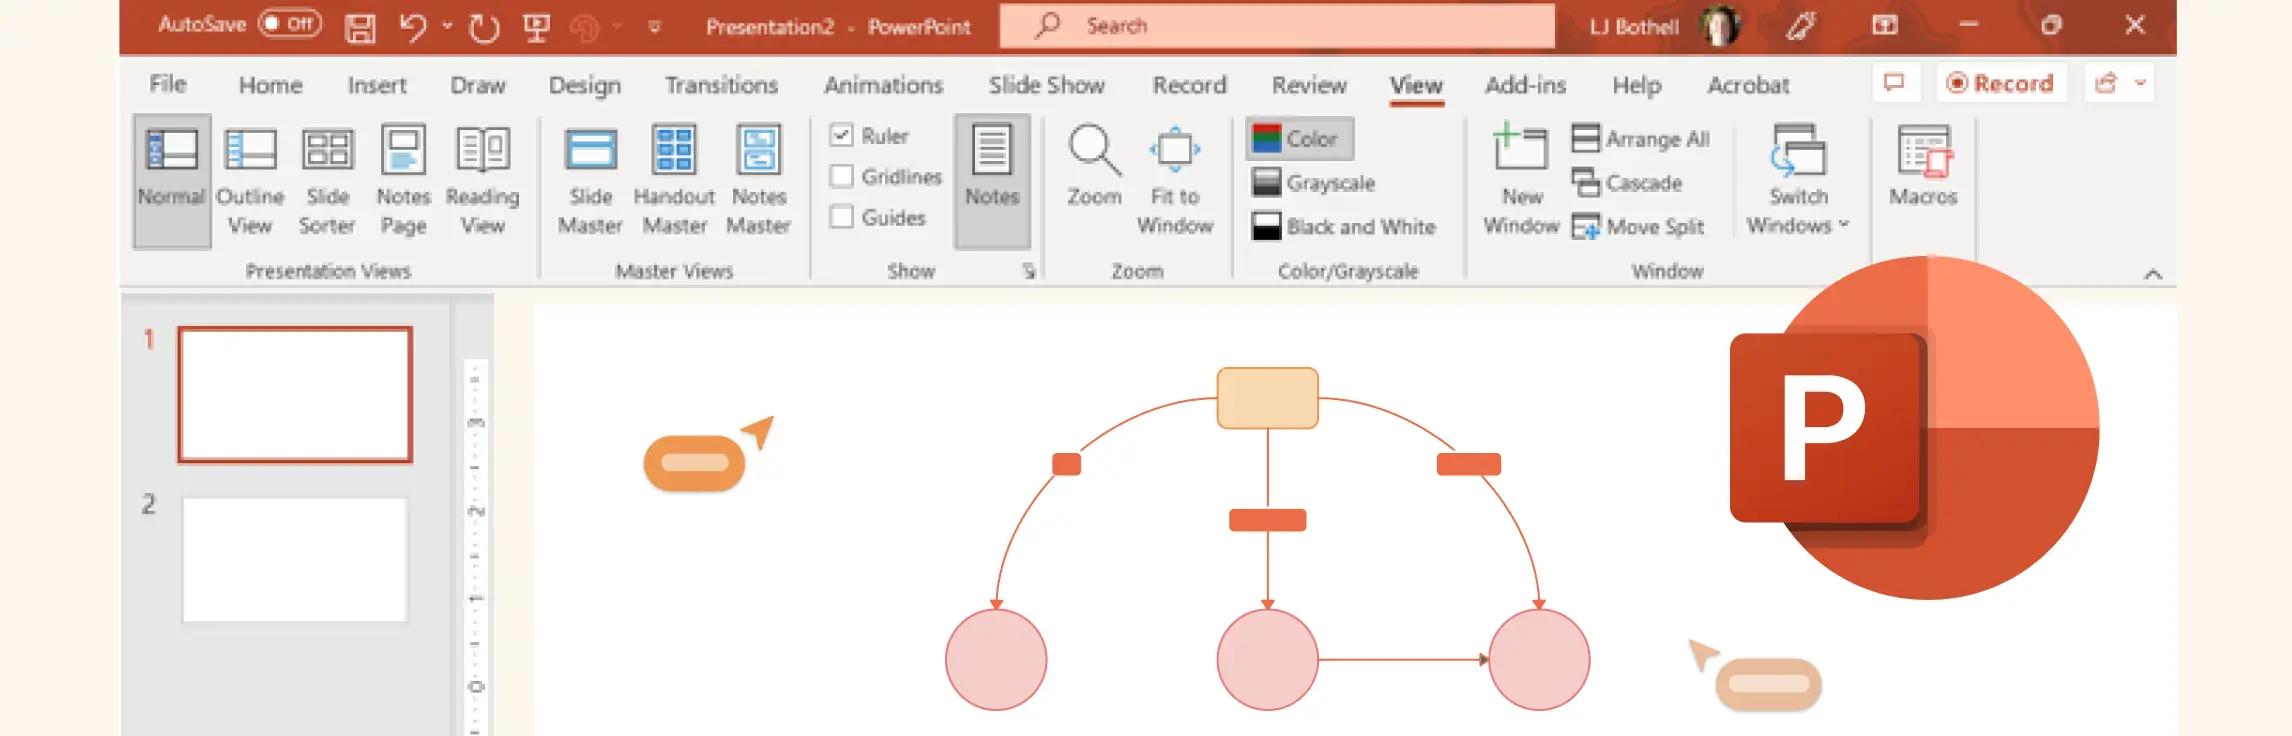
Method 1: Using Basic Shapes
- Insert Shapes for Ideas: Navigate to Insert > Shapes and choose a shape (e.g., rectangle, oval) for each concept. Click and drag on the sheet to create the shape and add text inside it.
- Connect the Concepts: Select lines or arrows from Insert > Shapes to draw connectors between the shapes, illustrating the relationships between your ideas.
- Format Your Map: Use the formatting options to adjust colors, border styles, and text alignment. This helps to maintain clarity and visual consistency.
Method 2: Leveraging Excel’s Drawing Features
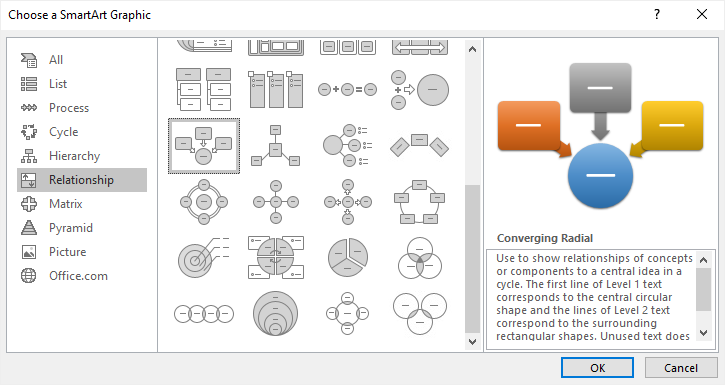
- SmartArt: Build a mind map using the SmartArt feature found under the Insert tab. Simply click the SmartArt icon, wait for the dialog box, select the “Relationship” category, scroll to “Converging Radial,” and click OK to insert the graphic into your worksheet.
- Create Text Boxes: Insert text boxes to add extra details or annotations near your shapes. This can help to further explain relationships or highlight key points.
- Use Alignment Tools: Utilize Excel’s grid and alignment features to ensure that your shapes and connectors are evenly spaced and neatly organized.
Enhancing Your Concept Map in Excel
To make your concept map more impactful:
- Apply Consistent Formatting: Use a uniform color palette, fonts, and shape styles to improve readability.
- Maintain Proper Alignment: Align your elements using Excel’s built-in alignment and spacing tools to avoid a cluttered appearance.
- Incorporate Visual Elements: Add icons or images to represent concepts visually, thereby enhancing the overall appeal and clarity of your map.
Saving and Sharing Your Concept Map
- Save Your Work: Save your concept map as an Excel workbook (.xlsx) for future editing, or export it as a PDF to share with others.
- Export Options: Some users also choose to capture a screenshot for quick sharing, though dedicated diagramming tools offer more versatile export formats.
When Should You Apply Concept Maps?
Business Applications:
- Strategic Visualization: Structure and enhance business plans.
- Project Coordination: Map out tasks, deadlines, and key milestones.
- Innovative Ideation: Organize and develop creative ideas.
- Workflow Optimization: Detects inefficiencies and streamline processes.
- Effective Communication: Break down complex concepts for stakeholders.


Education Applications:
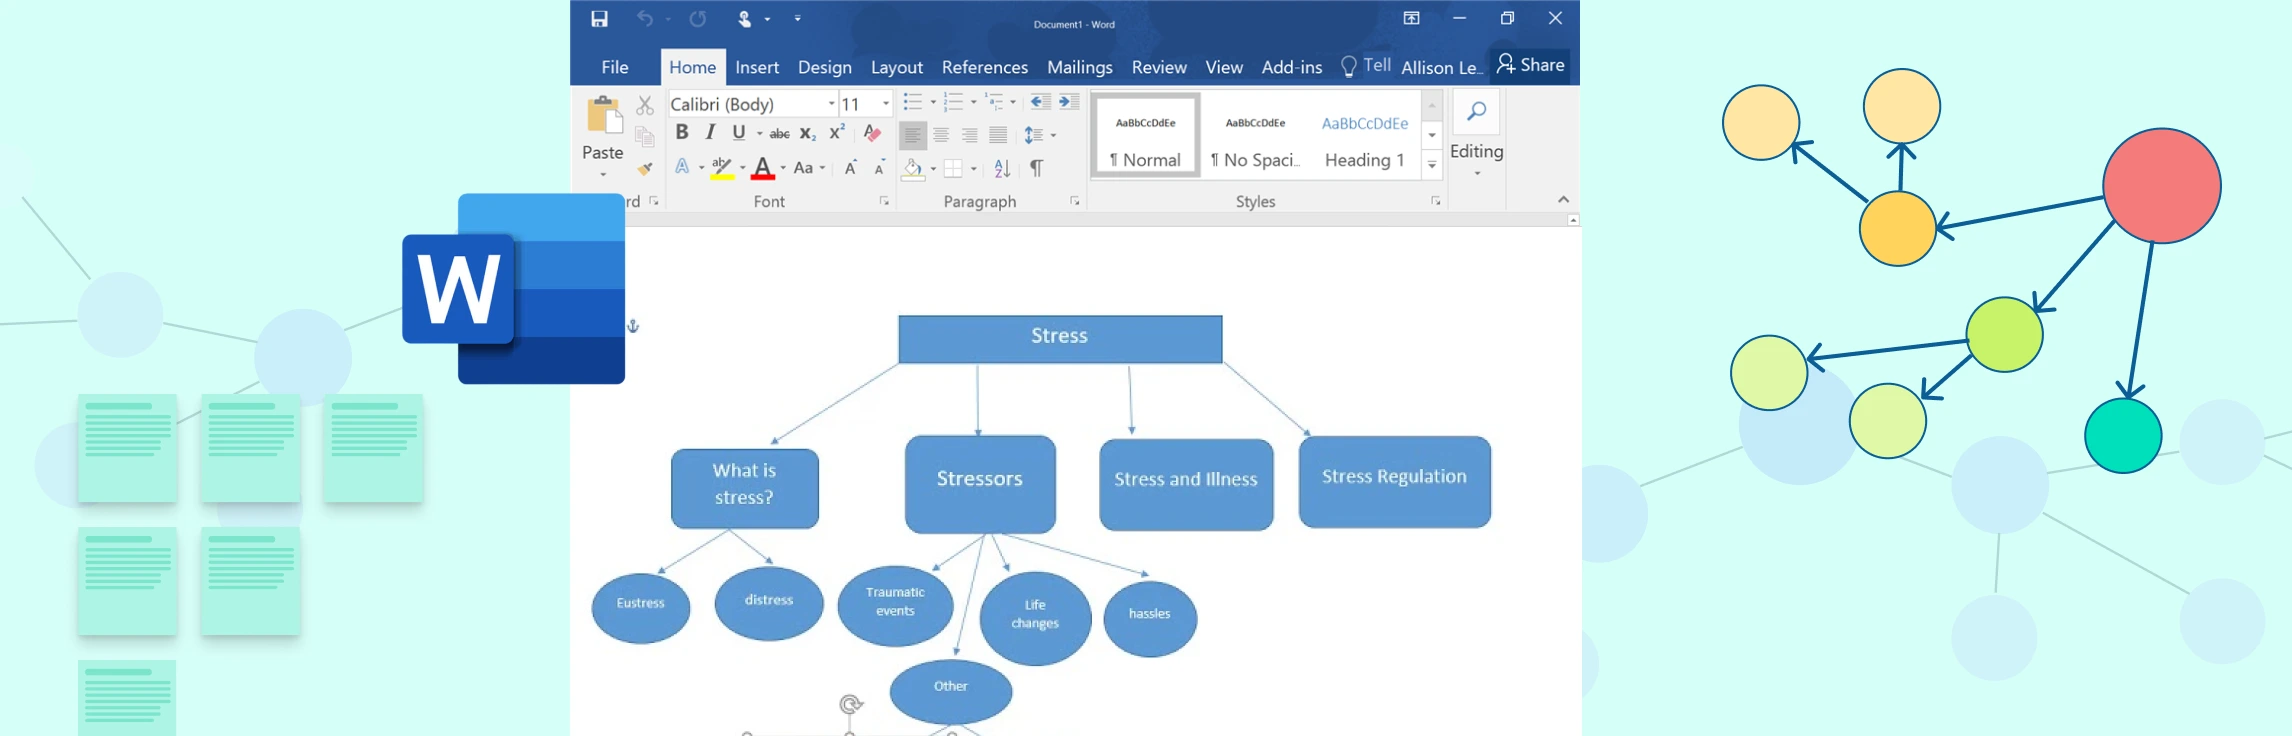
- Simplified Learning: Use concept maps in education to break down complex topics into easily understandable sections.
- Interactive Study: Promote hands-on, visual learning experiences.
- Collaborative Engagement: Facilitate group discussions and teamwork.
- Review Tools: Utilize concept maps for efficient study and revision.

Personal Projects:
- Organizing Ideas: Arrange personal goals and creative concepts.
- Quick Brainstorming: Develop and connect new ideas efficiently.
- Task Management: Break projects into actionable steps.
- Problem Solving: Map out concept map ideas to identify challenges and explore possible solutions.

Additional Applications:
- Healthcare: Visualize symptoms, diagnoses, and treatment plans.
- Technology & IT: Illustrate system architectures and data processes.
- Research & Policy: Concept maps for research studies and analyzing socio-economic trends.

Best Practices to Follow When Creating Concept Maps in Excel
Plan Your Concept Map
- Set Clear Objectives: Define what you want to achieve with your map.
- Brainstorm and Organize: Jot down your ideas and plan a logical, hierarchical structure.
- Decide on a Layout: Choose a design that best fits your purpose, whether hierarchical or network-style.
Utilize Excel’s Drawing Tools
- Shapes and Connectors: Use Excel’s Shapes to represent concepts and lines to connect them.
- Text Boxes: Add text boxes for additional descriptions without overcrowding your diagram.
Maintain a Consistent and Clean Design
- Uniform Style: Stick to consistent colors, fonts, and border styles.
- Neat Alignment: Utilize gridlines and alignment tools to keep everything in order.
- Concise Text: Avoid lengthy sentences—use brief keywords or phrases.
Enhance Clarity and Readability
- Label Connections: Clearly mark the connectors to explain the relationships between concepts.
- Differentiate Key Ideas: Use size, color, or placement to distinguish primary concepts from secondary ones.
- Group Similar Ideas: Visually cluster related concepts to help the viewer navigate your map.
Iterate and Refine
- Gather Feedback: Share your initial map with colleagues or peers and incorporate their suggestions.
- Revise and Improve: Don’t hesitate to rearrange elements for better clarity.
- Version Control: Save multiple iterations to track improvements over time.
Limitations of Creating Concept Maps in Excel
While Excel is a powerful tool for data analysis and calculations, it has several notable drawbacks when it comes to creating visually engaging concept maps:
Limited Flexibility:
Excel’s grid-based structure works well for spreadsheets but isn’t designed for free-form visual diagramming. The rigid cell layout can restrict your ability to position and resize shapes freely, making it challenging to craft a clear, intuitive concept map.Manual Effort:
Creating a concept map in Excel involves manually placing each shape and drawing connectors between them. This process is not only time-consuming but also increases the risk of misaligned or overlapping elements, which can detract from the map’s overall clarity.Lack of Auto-Adjust Features:
In dedicated diagramming tools, connectors dynamically adjust as you reposition elements, maintaining a clean and organized layout. Excel does not offer this functionality, meaning that every adjustment requires manual repositioning of connectors—a process that can quickly become tedious.Collaboration Challenges:
Although Excel supports basic collaboration, it lacks the robust, real-time collaborative features found in specialized diagramming platforms. This can lead to difficulties when multiple team members need to work on the same concept map simultaneously, potentially causing version conflicts and reducing overall efficiency.
Helpful Resources
Learn how to create a concept map with ease using Creately.
Explore creative concept map ideas to help you organize and visualize your thoughts.
Discover creative concept map examples to enhance creativity and comprehension.
Why Creately is the Best Tool for Concept Mapping
Creately is designed specifically for efficient and intuitive concept mapping. Its Free Concept Map Maker empowers users to create visually dynamic maps that go far beyond the basic capabilities of Excel.
- Drag-and-Drop Simplicity: Easily add, modify, and arrange elements with an intuitive interface, eliminating tedious manual adjustments.
- Smart Connectors: Auto-adjusting connectors keep your map organized, even when elements are moved or reconfigured.
- Real-Time Collaboration: Work simultaneously with team members, making it ideal for brainstorming sessions and collaborative projects.
- Customizable Templates: Access a wide range of professionally designed, customizable concept map templates to jumpstart your concept mapping process.
- Integrations with Popular Tools: Seamlessly connect Creately with platforms like Google Drive, Confluence, Slack, and Jira to streamline your workflow.
- Export and Share Options: Export your concept maps in multiple formats (PDF, PNG, SVG) without any loss in quality.
- AI-Powered Features: Leverage artificial intelligence for suggestions and enhancements, ensuring your map remains comprehensive and well-organized.
Free Concept Map Templates by Creately
One of Creately’s standout features is its extensive library of pre-designed templates. These ready-made templates help you quickly visualize and organize your ideas:
Beginners Concept Map Template

Simple Concept Map Template

Organize Your Thoughts Template

Marketing Concept Map Template

Opportunity Solution Tree Template

Nursing Concept Map Template

Versatile Concept Map Template

Blank Concept Map Template

Business Outcome Concept Map Template

Science Concept Map Template