Understanding processes is key to making tasks more efficient and effective, whether you’re managing a project, improving workflows, or solving problems. Two useful tools for visualizing and analyzing processes are flowcharts and process maps. Though they may look similar, each one serves a distinct purpose and works better in different scenarios.
In this guide, we’ll explore the main differences when it comes to flowchart vs process map, how each can be used, and when you should choose one over the other.
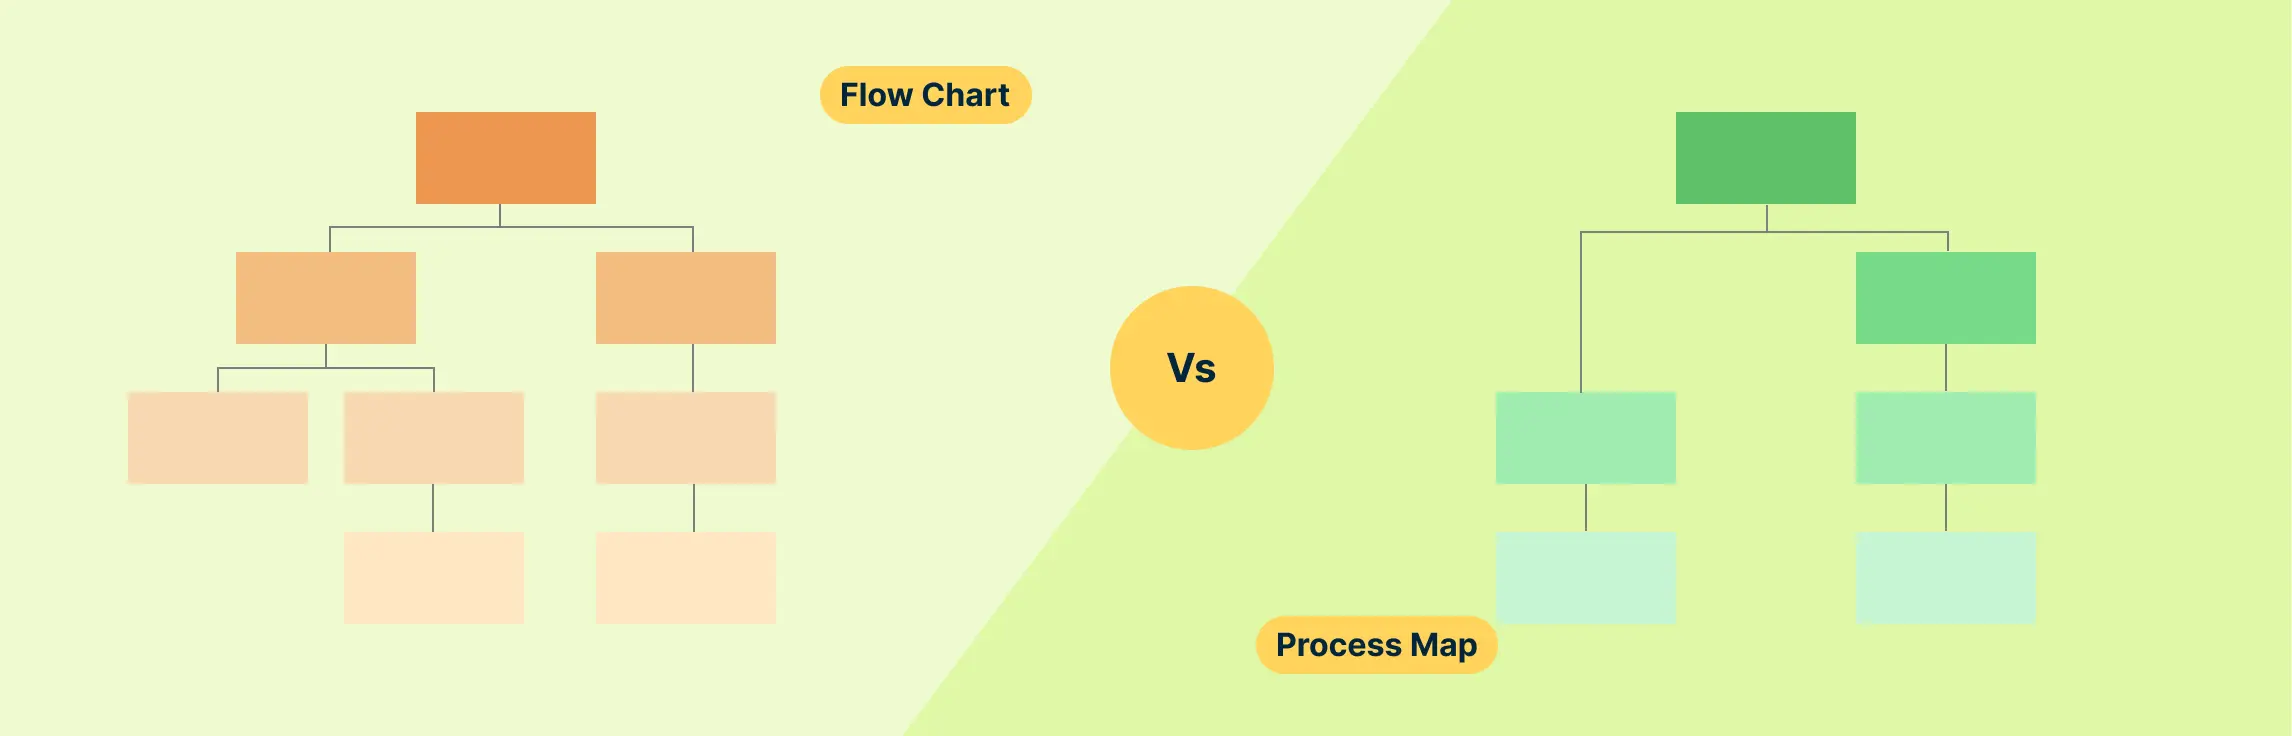
Flowchart vs Process Map: A Quick Overview
Here’s a quick overview of the key differences between flowcharts vs process maps:
| Aspect | Flowchart | Process Map |
| Purpose | Used to show the sequence of steps in a process. | Focuses on the entire process, including inputs, outputs, and detailed steps. |
| Detail Level | Simple, often showing just the main steps. | More detailed, showing every step, decision point, and flow. |
| Complexity | Generally simple and easy to follow. | Can be complex, capturing intricate process details. |
| Symbols | Uses standard symbols like ovals, rectangles, and diamonds. | May use varied symbols and more detailed diagrams depending on the type of process maps used. |
| Best for | Showing step-by-step actions or decisions. | Analyzing entire processes, identifying inefficiencies, and process improvement. |
| Use Cases | Decision-making, troubleshooting, and simple workflows. | Process analysis, quality control, and operational improvements. |
| Focus | Focuses on actions and decisions. | Focuses on process flow, inputs, and outputs. |
| Standardization | Has a more standard set of symbols. | Can vary depending on the type of process map and the complexity of the process. |
What Are the Key Differences Between a Flowchart and Process Map
Flowcharts and process maps are both tools used to visualize and analyze processes, but they are designed for different purposes and vary in detail. Here’s a deeper look into the key differences:
1. Purpose and scope
- Flowchart: A flowchart shows a sequence of steps in a process. It focuses on the flow of actions and decisions, typically in a simple, linear fashion. Flowcharts are ideal for illustrating how something works step by step, and they are widely used for decision-making and problem-solving.


- Process map: A process map provides a more comprehensive view of a process. It illustrates the entire process, showing not only the steps but also inputs, outputs, and interactions between different parts of the process. Process maps are useful for understanding complex workflows and identifying inefficiencies or areas for improvement.
2. Level of detail
- Flowchart: Flowcharts are relatively simple and provide a high-level view of a process. They often contain just the basic steps and decision points. They are great for showing how decisions lead to specific outcomes or how tasks are carried out in sequence.

- Process map: Process maps can go into much greater detail, including information about resources, timing, roles, and more. They are often used to map out the entire workflow, capturing both high-level and minute details to give a complete picture of a process.

3. Complexity
- Flowchart: Flowcharts are typically simpler to create and understand. They use a limited set of symbols, such as ovals for start/end, rectangles for steps, and diamonds for decisions. This makes them accessible to people with little to no technical background.
- Process map: Process maps are usually more complex and can incorporate a variety of symbols and notations. They often include additional elements like timelines or resource allocation, and they might use multiple types of diagrams (like flowcharts) depending on the mapping style.
4. Symbols and standardization
- Flowchart: Flowcharts follow a standard set of flowchart symbols. These symbols are well-defined and easy to interpret, which helps ensure that anyone familiar with flowcharting can understand the diagram without much explanation.
- Process map: Process maps can use a broader range of process mapping symbols, though they are less standardized than flowcharts. The exact symbols used may depend on the mapping method and the goals of the mapping effort (e.g., showing customer satisfaction, resource flow, or identifying bottlenecks).
5. Best use cases
- Flowchart: Flowcharts are best suited for situations where you need to map out sequences of actions or decision-making paths. They are often used in:
- Simple workflows
- Process documentation
- Troubleshooting and problem-solving
- Creating decision trees
- Process map: Process maps are ideal for more detailed process analysis, particularly in situations that require a holistic view of a process. They are used for:
- Identifying inefficiencies and bottlenecks
- Optimizing complex workflows
- Process improvement initiatives
- Training and onboarding employees on a larger scale
Flowchart vs Process Map: What Are the Similarities
Process maps and flowcharts are both tools used to visualize processes, helping teams understand workflows and identify areas for improvement. Despite their differences, they share several key similarities:
1. Visual representation of processes
Both process maps and flowcharts provide a visual breakdown of processes. This makes complex workflows easier to understand, helping teams quickly identify the flow of actions and connections between steps.
2. Identification of process steps
Both tools focus on breaking down processes into clear steps, allowing teams to understand each part of the workflow and how they connect, making it easier to allocate resources and assign tasks.
3. Decision points highlighting
Both flowcharts and process maps highlight decision points where a process might branch out based on specific conditions. This helps identify where choices impact the outcome and how they influence the process flow.
4. Process analysis and improvement
Both tools are used for analyzing processes, helping teams identify inefficiencies and areas for improvement by visualizing where the process could be streamlined or optimized.
5. Enhanced communication
By providing a clear visual representation, both flowcharts and process maps enhance communication among team members and stakeholders, ensuring everyone understands the process in the same way.
Flowcharts: Definition, Uses, and Benefits
A flowchart is a diagram that visually represents a process, workflow, or algorithm, illustrating the sequence of steps and decisions involved. By using standardized symbols—such as rectangles for processes and diamonds for decisions—flowcharts provide a clear and straightforward depiction of complex procedures, making them easier to understand and analyze.

Use cases of flowcharts
1. Documenting simple processes
Flowcharts are great for showing clear, step-by-step workflows, making them ideal for documenting basic processes.
2. Decision-making
Decision flowcharts are used to map out decision points, helping individuals or teams understand different options and outcomes in a process.
3. Troubleshooting
They help identify where issues are occurring in a process, making it easier to diagnose and resolve problems quickly.
4. Process visualization
They provide a simple visual representation of a process, helping teams easily understand how tasks flow from one step to the next.
5. Training new employees
They are helpful for explaining basic processes to new team members, providing them with a clear understanding of their tasks and responsibilities.
6. Creating standard operating procedures
They are used to define standard procedures for performing tasks, ensuring consistency across teams and departments.
7. Workflow optimization
They are used to examine a process and identify areas where steps can be streamlined or improved for greater efficiency.
8. Project planning
They help visualize the steps involved in a project, from initiation to completion, making it easier to plan and track progress.
9. Compliance and documentation
They are used to document processes that need to adhere to regulatory standards, ensuring all required steps are followed.
10. Communication
They make it easier to communicate complex processes to different stakeholders by providing a simple, visual overview.
Benefits of flowcharts
1. Enhanced communication
The visual nature of flowcharts transcends language barriers and technical jargon, making them accessible to individuals with varying levels of expertise and fostering better communication among team members.
2. Process improvement
By providing a clear view of each step in a process, flowcharts enable teams to pinpoint areas for improvement, streamline workflows, and eliminate unnecessary steps, leading to increased efficiency.
3. Standardization
Flowcharts help establish standardized procedures within organizations, ensuring consistency and quality in task execution, which is crucial for maintaining operational excellence.
4. Training and onboarding
New employees can quickly grasp the intricacies of organizational processes through flowcharts, accelerating their learning curve and integration into the team.
Process Maps: Definition, Uses, and Benefits
A process map is a visual representation that outlines the steps, activities, and decision points within a business process. By illustrating how tasks flow and interconnect, process maps help organizations understand, analyze, and improve their operations.

Use cases of process maps
1. Documenting processes
Process maps help create clear records of workflows, making it easier to train new employees and keep processes consistent.
2. Finding inefficiencies
They help spot bottlenecks or unnecessary steps in a workflow, allowing teams to improve efficiency.
3. Improving customer service
By mapping out customer service steps, process maps help speed up response times and reduce mistakes.
4. Ensuring compliance
They help businesses in regulated industries follow necessary steps to meet legal requirements and maintain quality standards.
5. Optimizing supply chains
They show how goods and materials flow, helping businesses cut costs and speed up the process.
6. Training new employees
They provide a simple guide to help new employees understand how tasks are done.
7. Managing teamwork
They show how different teams work together, improving coordination and identifying areas to improve.
8. Project management
They break down complex projects into smaller tasks, making it easier to manage and track progress.
9. Redesigning processes
When businesses want to improve a process, process maps show the current workflow, helping to plan improvements.
10. Better communication
They help teams understand the process, ensuring everyone is on the same page and improving collaboration.
Benefits of process maps
1. Improved efficiency
By visualizing processes, organizations can streamline workflows, eliminate unnecessary steps, and optimize resource allocation, leading to increased productivity.
2. Enhanced compliance
Process maps help ensure that procedures adhere to industry regulations and standards by clearly outlining required steps and controls.
3. Effective training
New employees can quickly grasp process workflows through visual maps, reducing training time and minimizing errors.
When to Use Flowcharts vs Process Maps
Flowcharts and process maps are both valuable tools for visualizing processes, but they serve different purposes and are best suited for specific situations. Understanding when to use each can enhance clarity and effectiveness in process analysis and communication.
When to use flowcharts
Documenting simple processes: Flowcharts are ideal for outlining straightforward procedures with a clear sequence of steps.
Identifying decision points: Use flowcharts to highlight decision-making stages within a process, clarifying the criteria and possible outcomes.
Facilitating troubleshooting: When diagnosing issues in a process, flowcharts help trace the flow and pinpoint where problems may occur.
When to use process maps
Analyzing complex processes: Process maps provide a comprehensive view of intricate workflows, detailing inputs, outputs, and interactions among various components.
Improving process efficiency: Utilize process maps to identify inefficiencies, redundancies, or bottlenecks, enabling targeted improvements.
Ensuring compliance and standardization: Process maps help document processes in alignment with regulatory standards, ensuring consistency and adherence to required protocols.
In summary, choose flowcharts for straightforward, step-by-step representations and to emphasize decision points. Opt for process maps when dealing with complex workflows that require a detailed understanding of interactions and components. Selecting the appropriate tool based on the process’s complexity and objectives will enhance understanding and drive effective process management.
Conclusion: Flowchart vs Process Map
In conclusion, both flowcharts and process maps are essential tools for visualizing and understanding processes, but they serve different purposes. Flowcharts are perfect for simplifying simple processes, illustrating step-by-step actions, and highlighting decision points. On the other hand, process maps provide a more detailed and comprehensive view of complex workflows, helping identify inefficiencies, improve processes, and ensure compliance.
By understanding the key differences between flowchart vs process map and knowing when to use each tool, you can choose the right one based on your needs, whether you’re troubleshooting a process, analyzing efficiency, or training a new team member. Using these tools effectively can lead to clearer communication, more streamlined workflows, and continuous improvement across your organization.
References
Nabeel Allawi (2020). What is the FlowChart. [online] ResearchGate. Available at: https://www.researchgate.net/publication/342572223_What_is_the_FlowChart.
Flores, E. and Ortiz, D.A. (2023). Process mapping as a tool for improvement. [online] doi:https://doi.org/10.13140/RG.2.2.10805.14566.
FAQs: Flowchart vs Process Map
What is the main difference between a flowchart vs process map?
Can a process map include flowchart elements?
Can flowcharts and process maps be used together?
How detailed should a process map be compared to a flowchart?
Which tool is better for process improvement—flowchart vs process map?