Data architecture diagrams play a pivotal role in data management. They help structure complex data systems efficiently, thereby facilitating informed decision-making.
What is a Data Architecture Diagram?
A data architecture diagram is a visual representation of the framework and policies governing data flow and management within an organization. It outlines how data is processed, stored, and utilized, ensuring all components are aligned with the business objectives.
These diagrams provide a structured approach to data management, illustrating the relationships between different data entities and the processes that transform raw data into valuable insights. By breaking down complex data flows into comprehensible visual representations, these diagrams make it easier for stakeholders to understand and engage with the data architecture.
Unlike other technical diagrams that might focus solely on physical infrastructure or specific aspects of IT systems, Data Architecture Diagrams encompass a broader view of how data moves and is governed across the organization.
These diagrams are crucial in strategic planning, providing a clear vision of how data underpins business strategies and decision-making processes.


Exploring Types of Data Architecture Diagrams
Data architecture diagrams come in various forms, each tailored to specific aspects of data visualization and system design.
Conceptual Data Diagrams
Conceptual data diagrams provide a high-level view of the system, focusing on the major entities and their relationships without delving into details. They are crucial during the initial phases of project planning and help in outlining the scope and vision of the project.

Logical Data Diagrams
These diagrams bridge the gap between conceptual frameworks and detailed physical data models. They define the structure of the data elements and set the relationships between them, which is essential for further refinement and physical implementation.

Physical Data Diagrams
Focused on the actual implementation of the data architecture, these diagrams detail the specific technical means through which data is stored, retrieved, and managed within hardware and software systems.

Choosing the right type of data architecture diagram depends on your project’s needs and the stage of the development process. For instance, during the conceptual phase, a conceptual diagram is most effective, while physical diagrams are more suited for the final stages of system implementation.
The impact of selecting the appropriate diagram type is profound. It ensures that all stakeholders have a clear understanding of the system’s architecture, which facilitates better communication and efficient project execution. Utilizing tools like block diagram maker can aid in creating accurate and visually appealing diagrams that cater to your specific requirements.
Components of Data Architecture
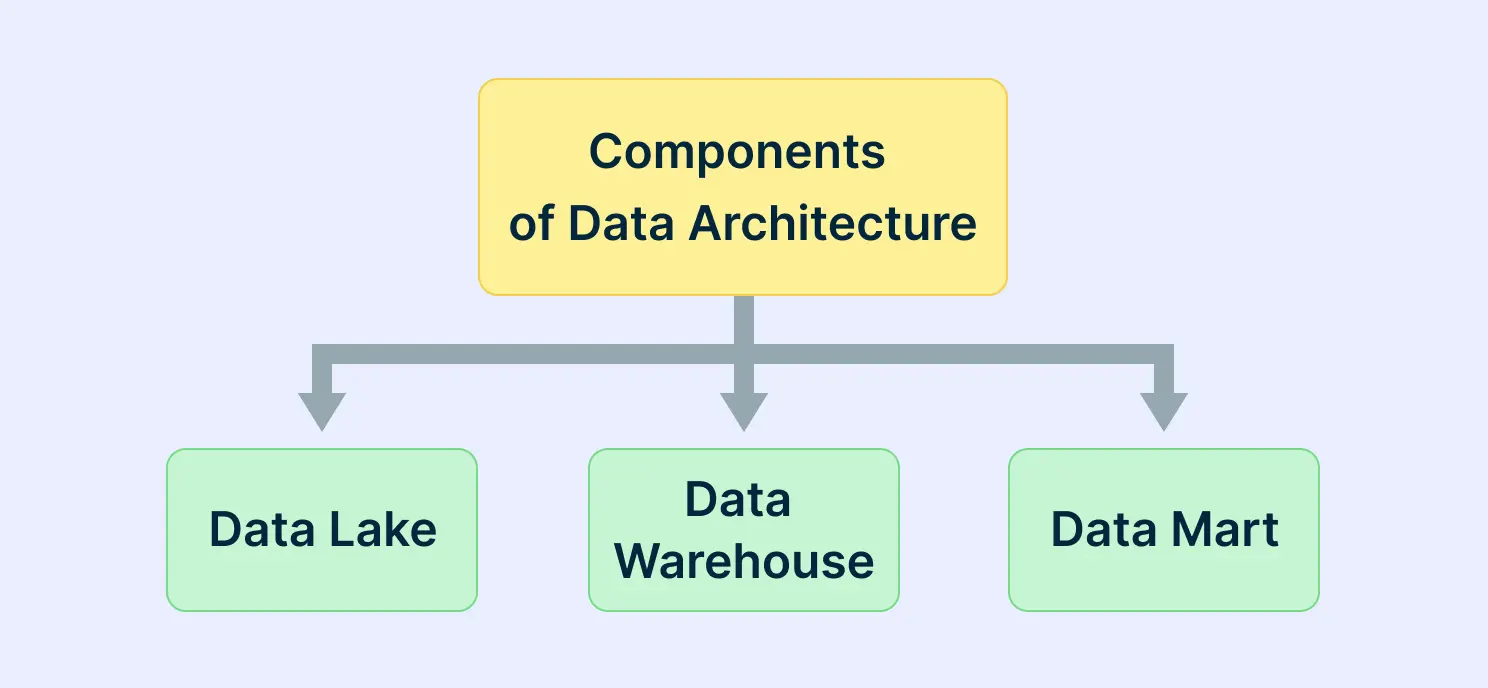
Data Lake
A data lake is a repository where data is stored in its unprocessed, raw state. It’s a critical stage in a company’s data lifecycle, as this is where data is initially collected before any processing occurs. Industry specialists and regulatory agencies recommend processing only the necessary data to avoid complications during management and privacy concerns.
Data Warehouse
A data warehouse is where data is organized and stored in a structured, modeled manner. Typically, the data here is arranged in tables and is primed for its ultimate, practical application.
Data Mart
A data mart is the juncture where data is in a state ready for utilization, distribution, or commercialization. After undergoing numerous processing stages, the data reaches this point in a format suitable for business intelligence. This is also where it undergoes compliance with various regulatory standards before the intelligence is disseminated.
Key Elements of an Effective Data Architecture Diagram
Creating an effective data architecture diagram requires a keen understanding of its components and the role they play in conveying complex data structures clearly and accurately. Here are the essential elements that should be included in your diagram:
Annotations
Adding annotations to your diagram can significantly enhance understanding. These should include descriptions of data flows, sources, and processes, making it easier for stakeholders to follow the logic and purpose of the data architecture.
Color Coding and Symbols
Utilize color coding and standardized symbols to differentiate between various types of data and interactions. This not only improves readability but also helps in quick identification of key elements.
How to Create a Data Architecture Diagram
Creating a data architecture diagram can streamline the process of understanding and managing the flow of data within an organization. Here’s how to create one in six steps:
1. Define the Purpose
Start by clarifying the purpose of the diagram. Determine what you want to communicate and to whom. Is it for technical stakeholders or business users? This will guide the level of detail and complexity needed.
2. Identify Components
List out all the components that will be part of the diagram. This includes databases, external data sources, data warehouses, ETL tools, data marts, and any other elements involved in the data flow.
3. Establish Relationships
Determine how these components interact with each other. Define the data flow direction, and make note of any transformations that occur as data moves from one component to another.
4. Choose a Tool
Select a diagramming tool that suits your needs. It could be a simple drawing tool like Lucidchart or a more advanced one like Creately or Microsoft Visio. Ensure that it supports the symbols and notations you plan to use.
5. Draft the Diagram
Begin by placing the core components on the canvas, then draw connections to represent the data flow. Use standardized symbols and notations, like the ones from the Unified Modeling Language (UML), to maintain clarity.
6. Review and Iterate
Share the draft with stakeholders for feedback. Use their insights to refine the diagram. Ensure that it’s accurate, easy to understand, and serves its intended purpose.
Best Practices for Drawing Data Architecture Diagrams
Understand Your Audience
Tailor the complexity and detail of your diagram to the knowledge level and needs of your audience. Whether they are stakeholders or technical team members, ensuring the diagram communicates effectively is key.
Clarity and Accuracy
The primary goal of a data architecture diagram is to simplify the understanding of data flows and structures. Ensuring that every component is represented accurately prevents misinterpretations and errors in data handling.
Maintain Consistency
Use consistent symbols, notations, and colors throughout your diagram. This consistency helps in reducing confusion and enhances the diagram’s professionalism. Tools like UML diagram tool can be instrumental in maintaining these standards.
Regular Updates
Data architectures evolve, and so should your diagrams. Regularly update your diagrams to reflect changes, ensuring that everyone involved has the most current information.
Balance Detail and Readability
While detail is important, too much can overwhelm the viewer. Strive for a balance where enough detail is provided for understanding without cluttering the diagram.
Scalability and Flexibility
Design your diagrams with scalability in mind. As businesses grow, their data architecture needs to adapt. Incorporating elements that allow for easy updates and modifications can save significant time and resources in the future.
Leverage Software Features
Utilize features offered by diagramming tools like Creately to enhance your diagrams. Features such as drag-and-drop interfaces, preset objects, and collaborative tools can streamline the creation process and foster better team collaboration.
Benefits of Using Data Architecture Diagrams
Data architecture diagrams are not just tools for visualization; they are essential instruments that enhance organizational efficiency and decision-making. By implementing these diagrams, companies can reap multiple benefits that significantly impact various aspects of their operations.
Improving Communication Across Different Teams
Data architecture diagrams provide a clear and concise framework that helps in bridging the communication gap between technical and non-technical teams. This clarity is crucial for ensuring that everyone is on the same page, thereby enhancing project outcomes. For more insights, see why team communication is key to team success.
Supporting Business Intelligence and Data-Driven Decisions
With a well-structured data architecture diagram, organizations can streamline their data analysis processes, leading to more informed decision-making and enhanced business intelligence capabilities.
Encouraging Collaboration Within and Between Departments
These diagrams foster an environment of collaboration by providing a common reference point for discussions, which is essential for the integration of efforts across departments.
Providing a Clear Vision for Future Growth and Scalability
Data architecture diagrams help in planning for future expansions and scalability by clearly outlining the data flows and processes, thereby supporting strategic planning and growth initiatives.
Wrapping Up
Data architecture diagrams are essential for modern businesses aiming to streamline data management and enhance decision-making processes. These diagrams not only facilitate a better understanding of complex data structures but also foster improved communication and collaboration across teams.
By leveraging platforms like Creately, businesses can take full advantage of visual tools to not only depict but also manipulate and understand their data landscapes more effectively. As we move forward, the integration of AI-powered features and collaborative tools will only enhance the utility and accuracy of data architecture diagrams, making them an even more essential part of strategic planning and operational efficiency.