Free Sociogram Maker
Visualize and Map Social Relationships
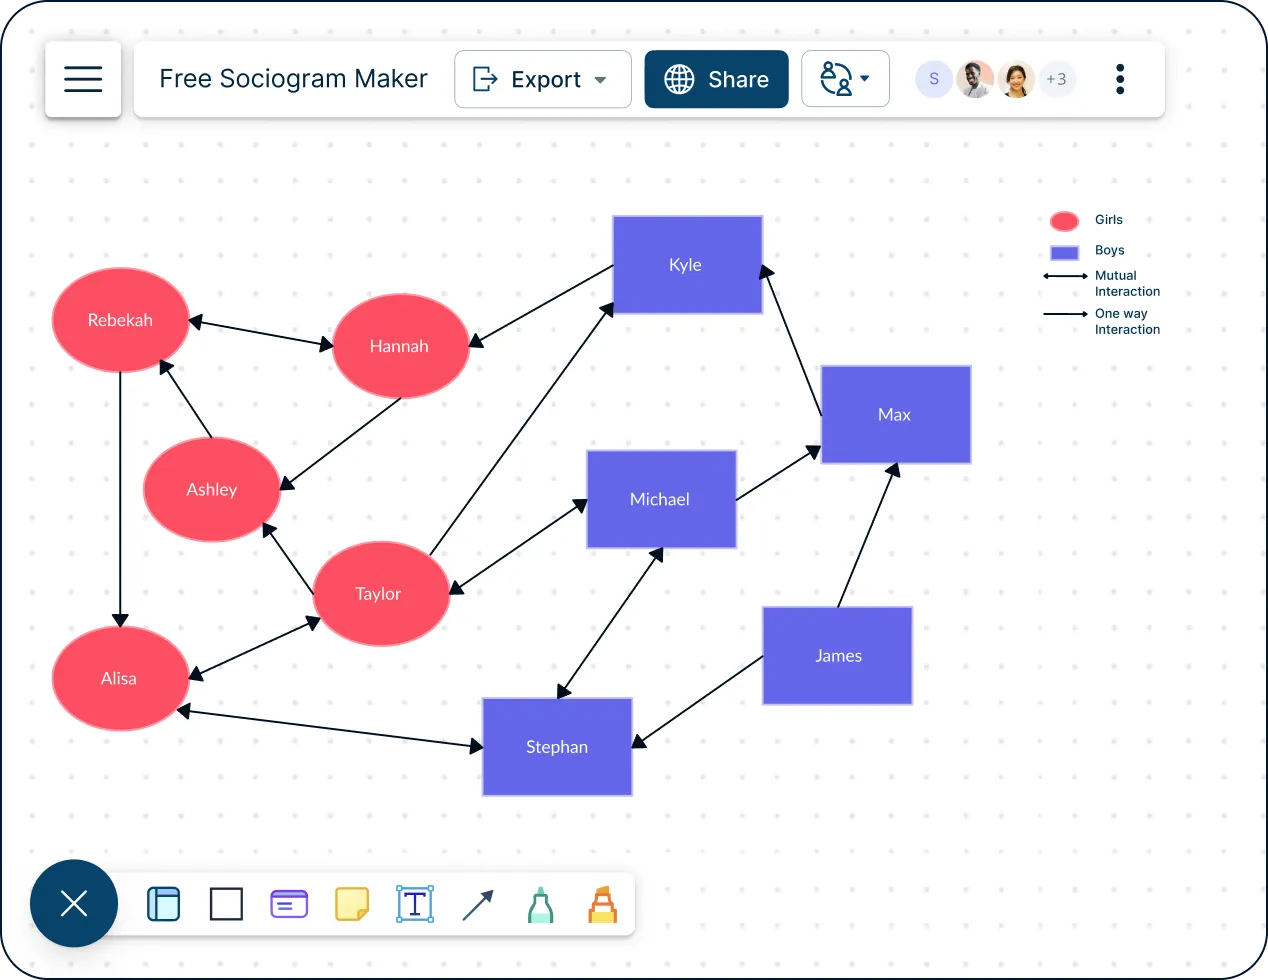
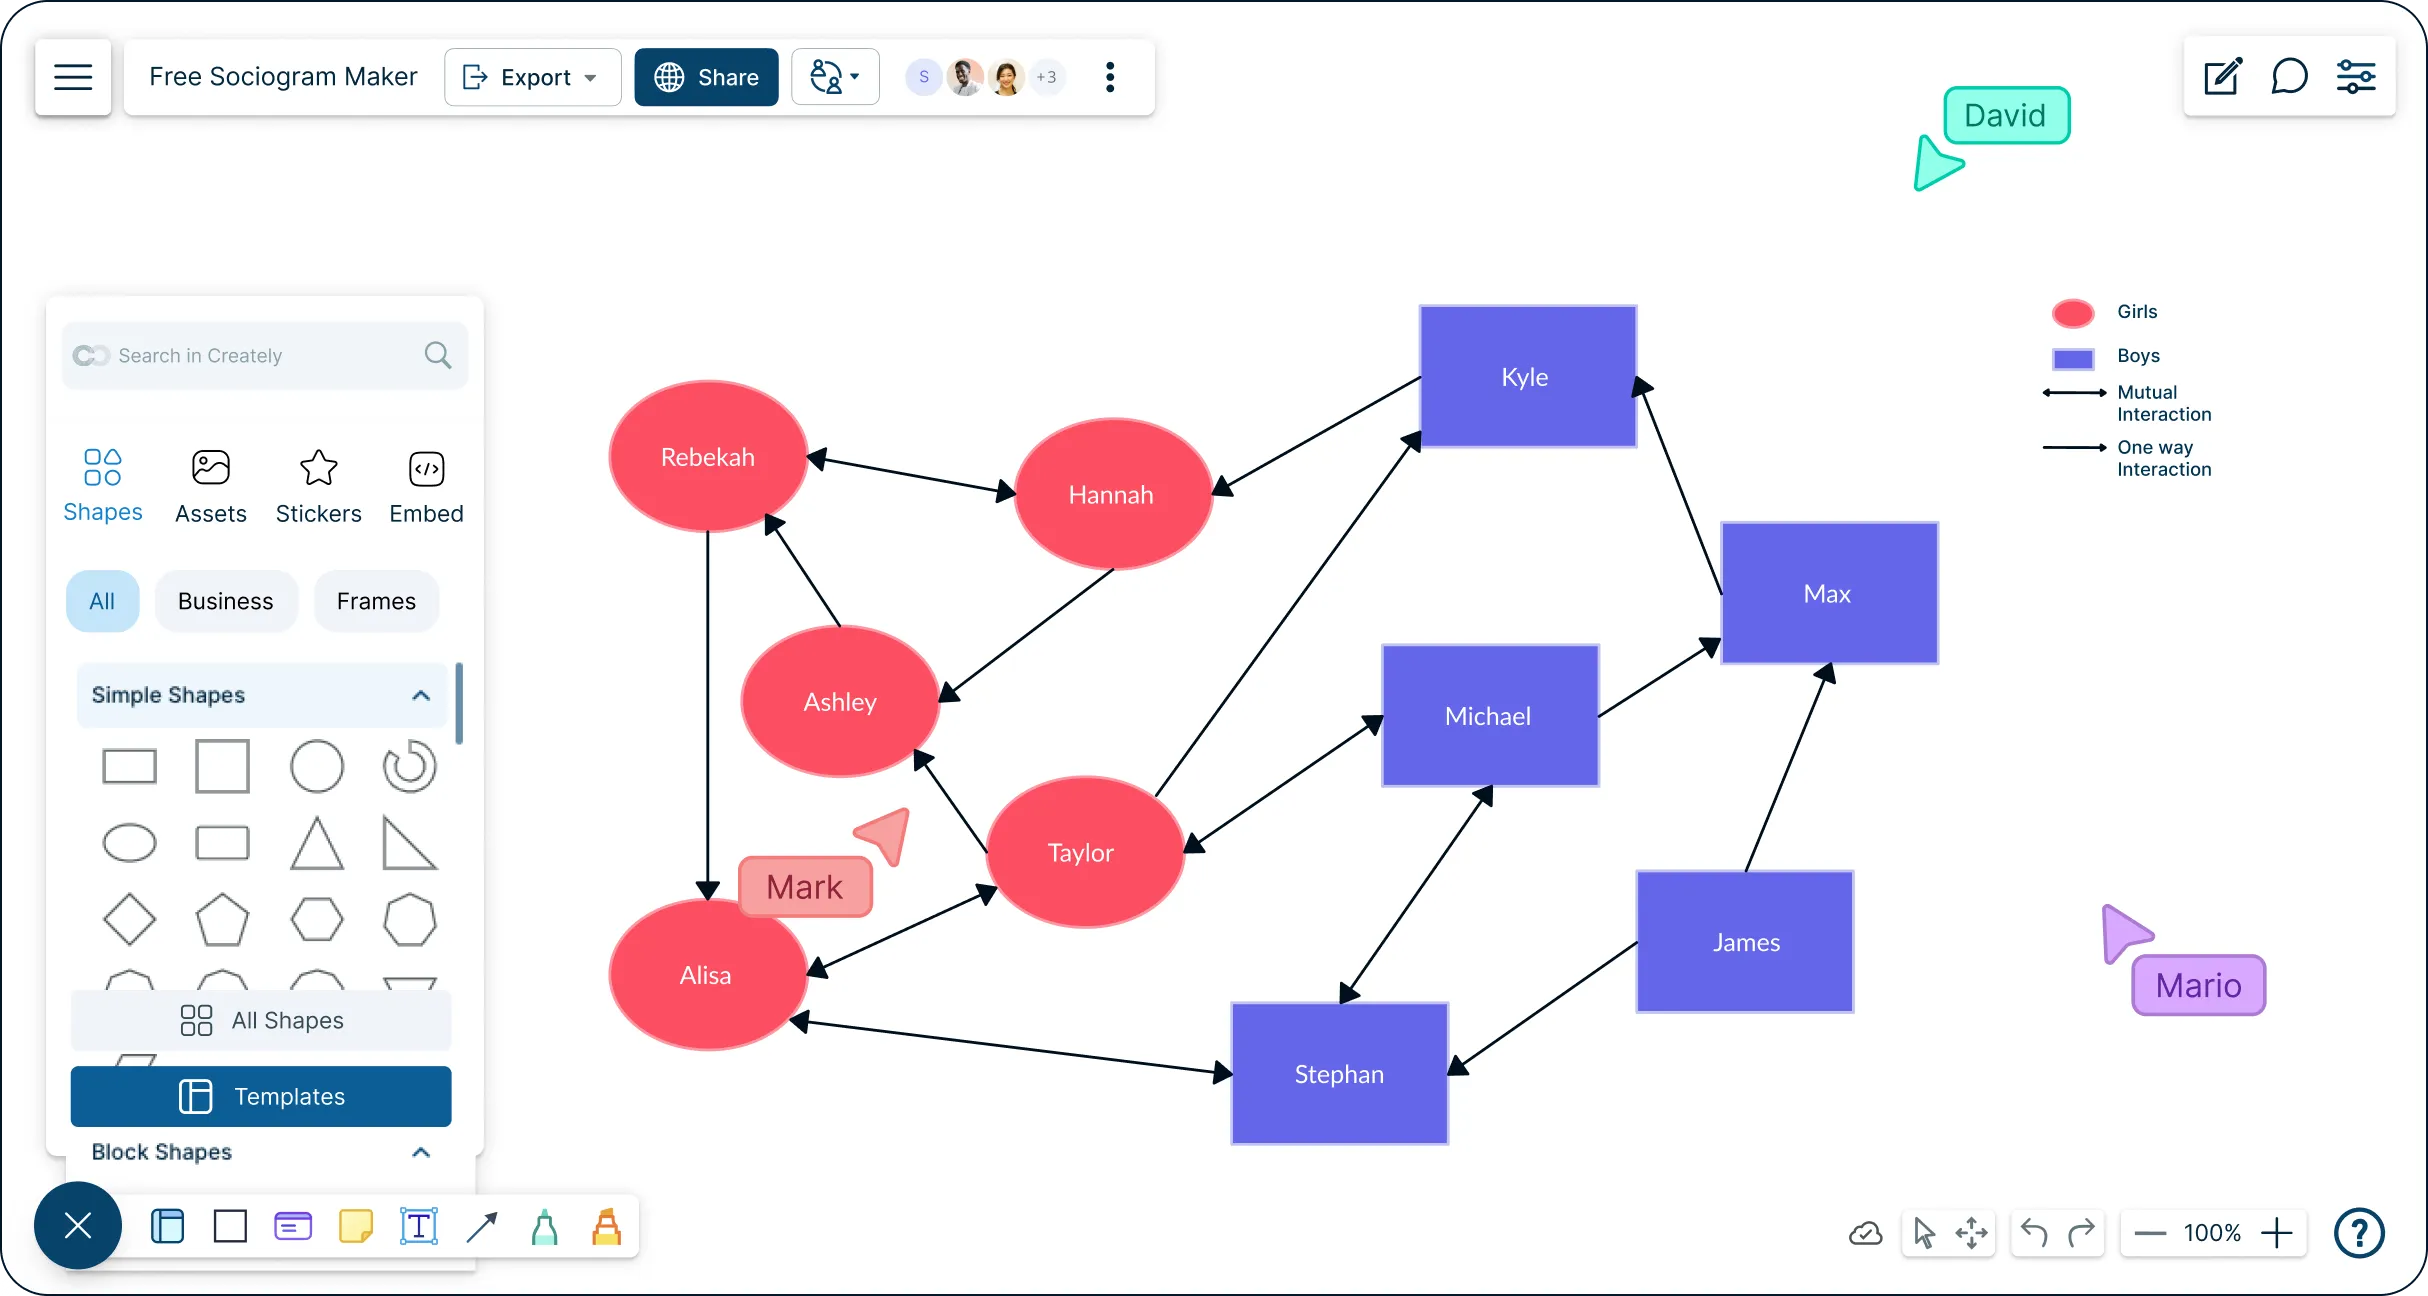
Easily create, customize, and share sociograms for education, research, or behavioral analysis. Understand and analyze social interactions with sociogram maker.
- Drag-and-drop shapes and automatic connectors for faster social mapping
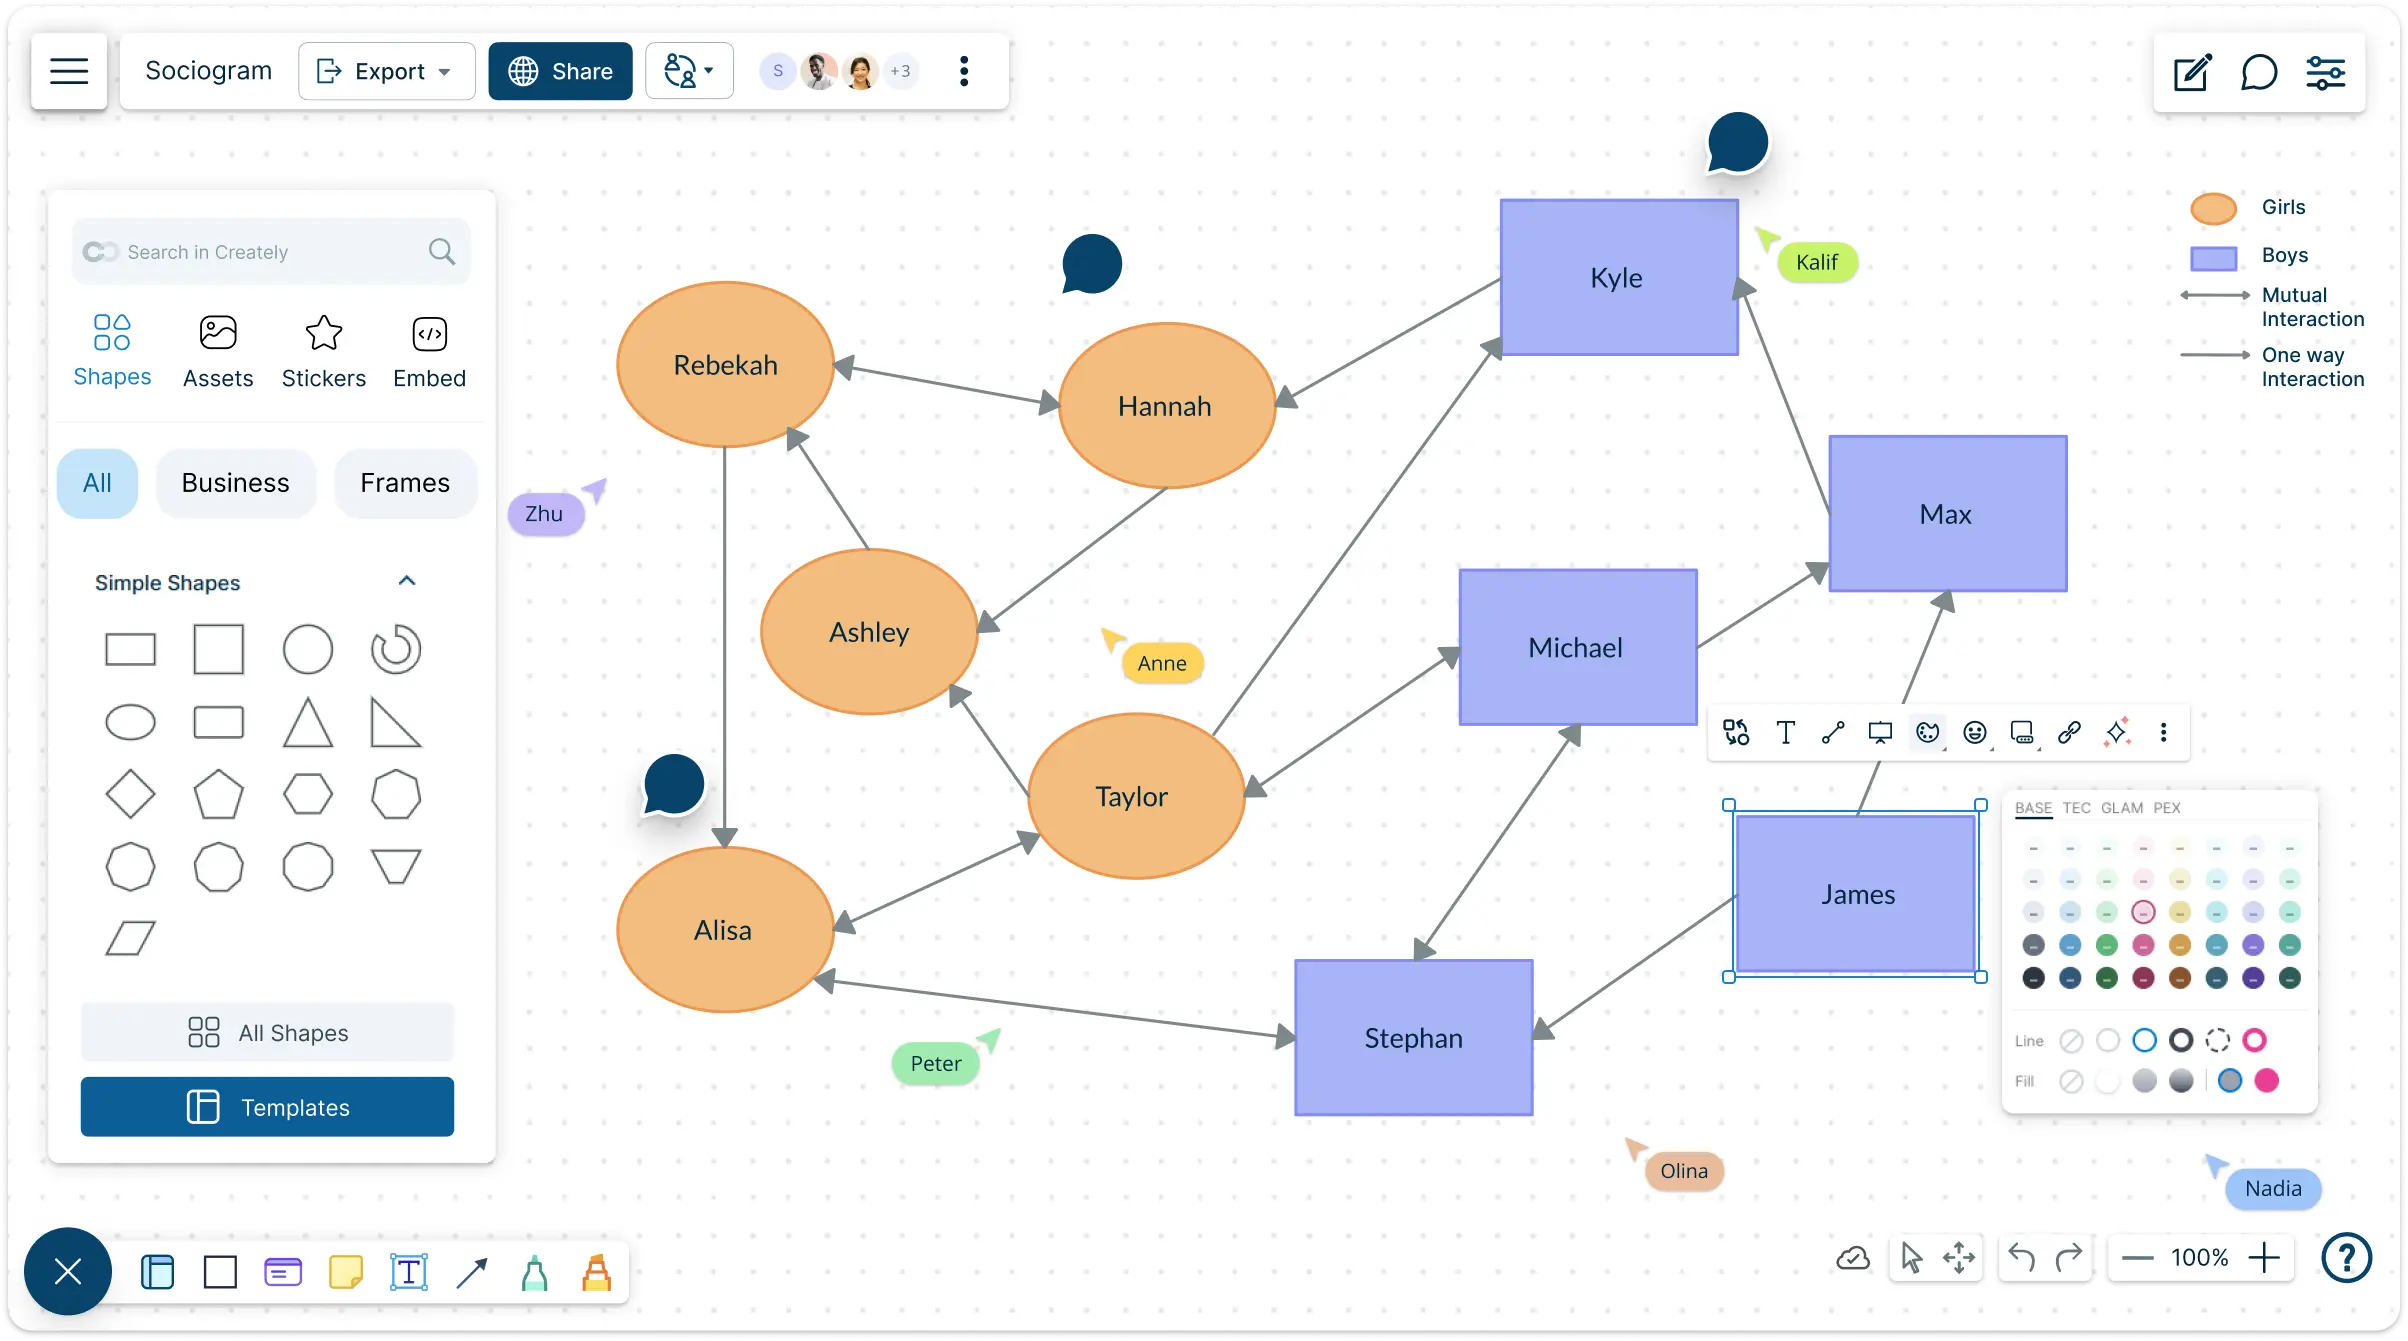
- Advanced collaboration tools to conduct group sessions to create and analyze sociograms
- Ready-made sociogram templates for classrooms, therapy sessions and more
- Drag-and-drop shapes and automatic connectors for faster social mapping
- Advanced collaboration tools to conduct group sessions to create and analyze sociograms
- Ready-made sociogram templates for classrooms, therapy sessions and more
Over 10 Million people and 1000s of teams already use Creately
Analyze Social Interactions with Our Sociogram Creator

- Quickly translate data on social links, preferences, and group dynamics into visual form using editable templates.
- Access and customize symbols for boys, girls, attraction, mutual attraction, indifference, and more to match standard sociogram notation.
- Use smart dynamic connectors to map various relationship types, such as friendships, collaborations, or conflicts.
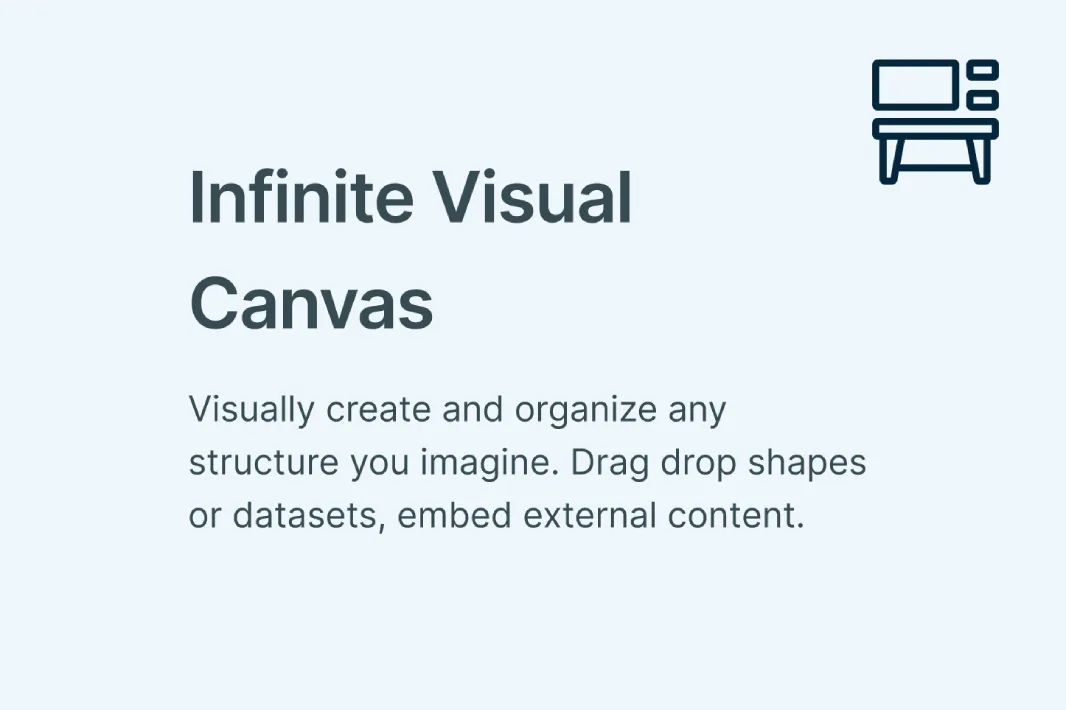
- Infinite canvas to map large and intricate social structures without limits, including multiple relationship types and subgroups.
- Custom color and styling themes to distinguish relationship types and clusters for clearer analysis and quicker understanding.

Add Context and Depth to Your Sociograms
- Bring in videos, photos, documents, and screenshots directly onto the canvas to support analysis and contextualize relationships.
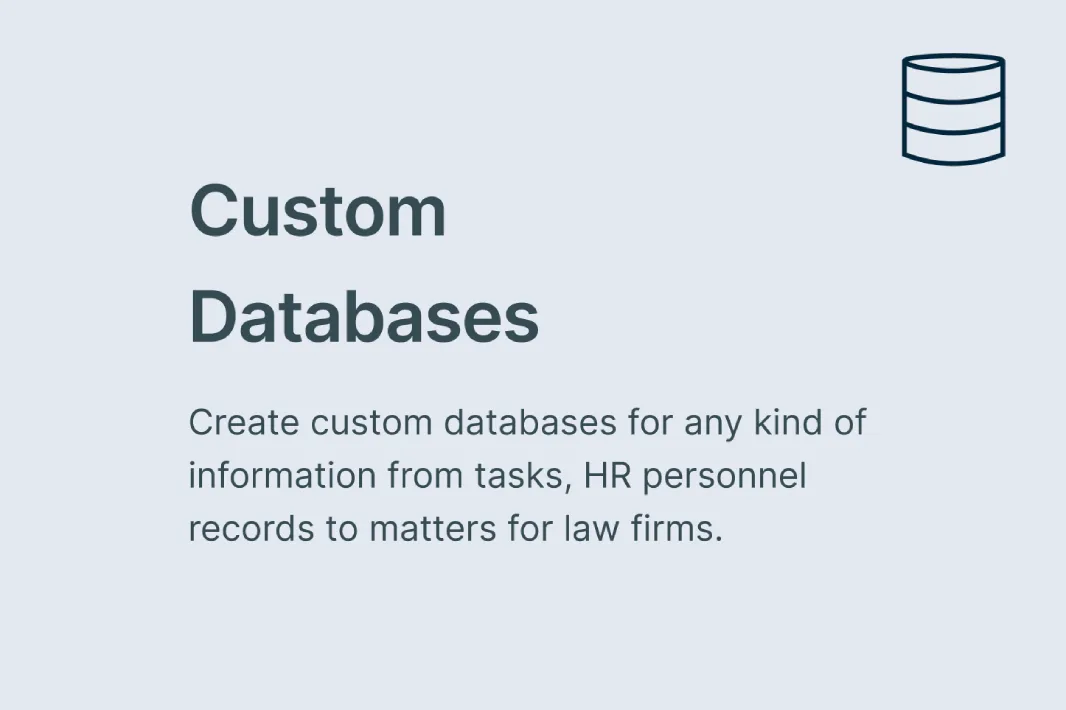
- Enrich each node with custom data fields to store details or notes like personal preferences, affiliations, or social connections.
- Use smart connectors to illustrate various interpersonal relationships such as mutual interests, friendships, or group tensions.
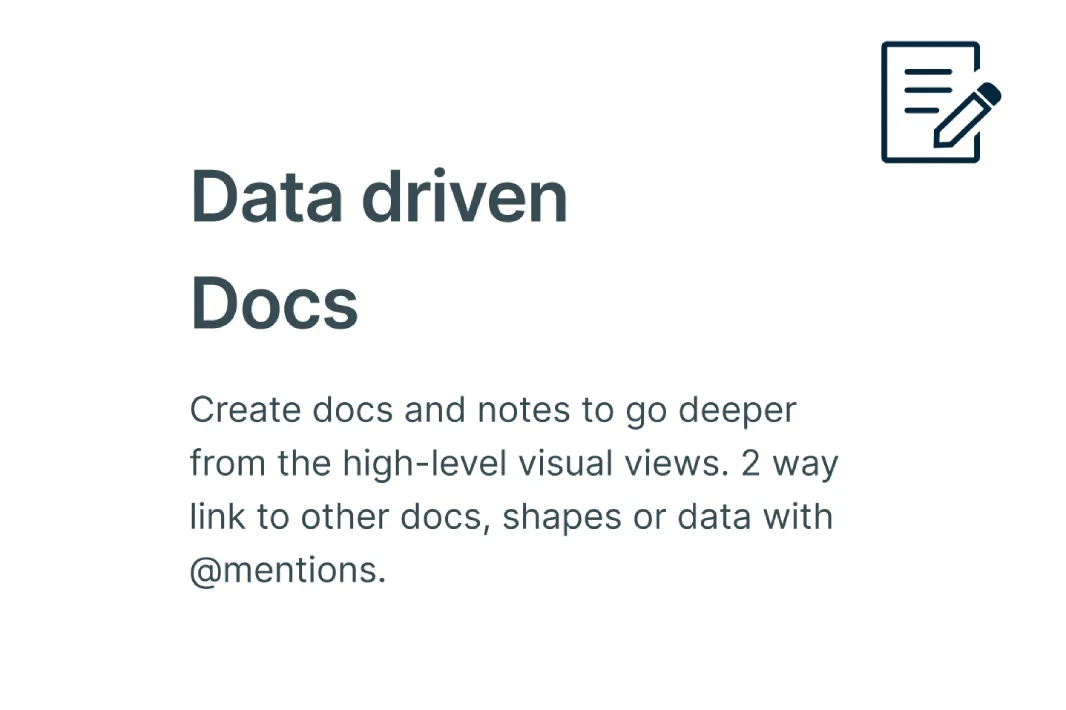
- Add contextual notes to shapes or the canvas to capture observations, interpretations, or background information during analysis.
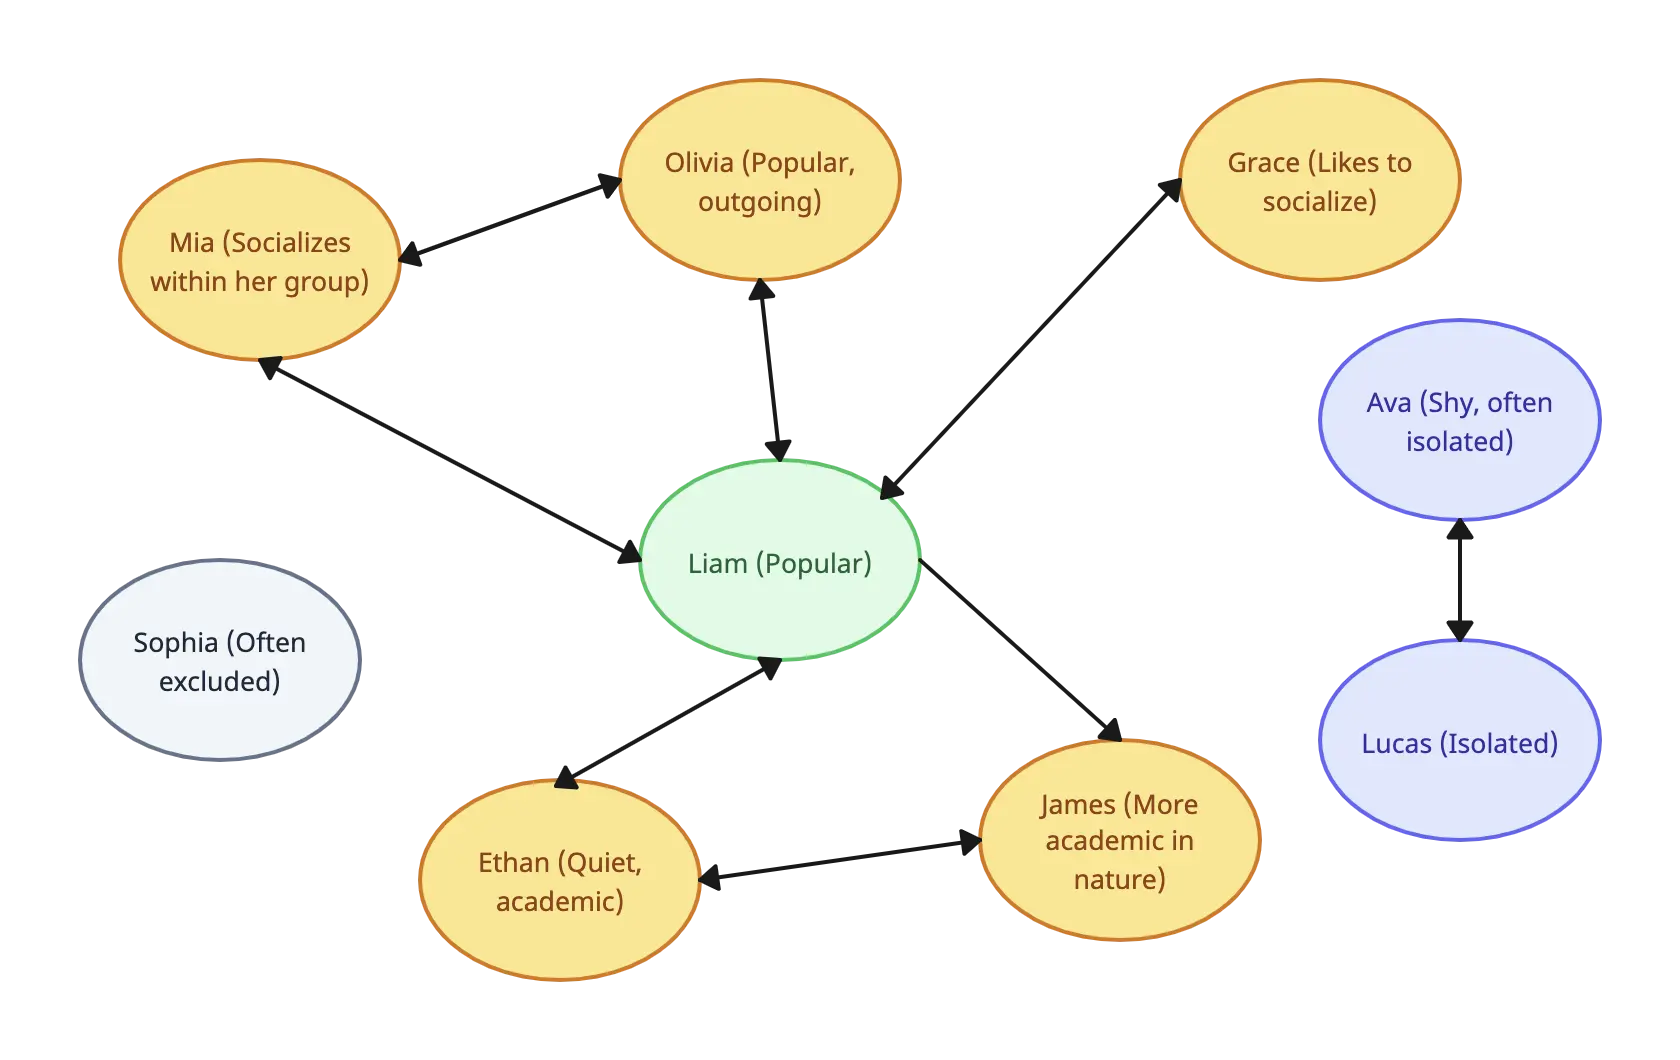
Understand How Peer Groups Form and Evolve

- Full-text search to instantly locate specific individuals, relationship types, or notes across complex sociograms.
- Jump between related individuals or relationship clusters with interactive links.
- Version history to review, compare, or restore previous iterations of a sociogram to study changes over time.
- Use frames to group individuals, highlight interactions, and visualize social structures or group formations.

Sociogram Maker with Seamless Sharing and Integration
- Connect to your favorite tools with Creately plugins for Github, Slack, Google Workspace, Confluence, and more.
- Easily insert your sociogram into Google or Microsoft Docs, Slides, and Sheets to generate reports or presentations.
- Download sociograms as PDF, SVG, PNG, or JPEG for printing, publishing, or sharing.
- Switch to presentation view for a clean, polished display of your sociogram, perfect for sharing insights in meetings or reports.
What Is a Sociogram Maker?
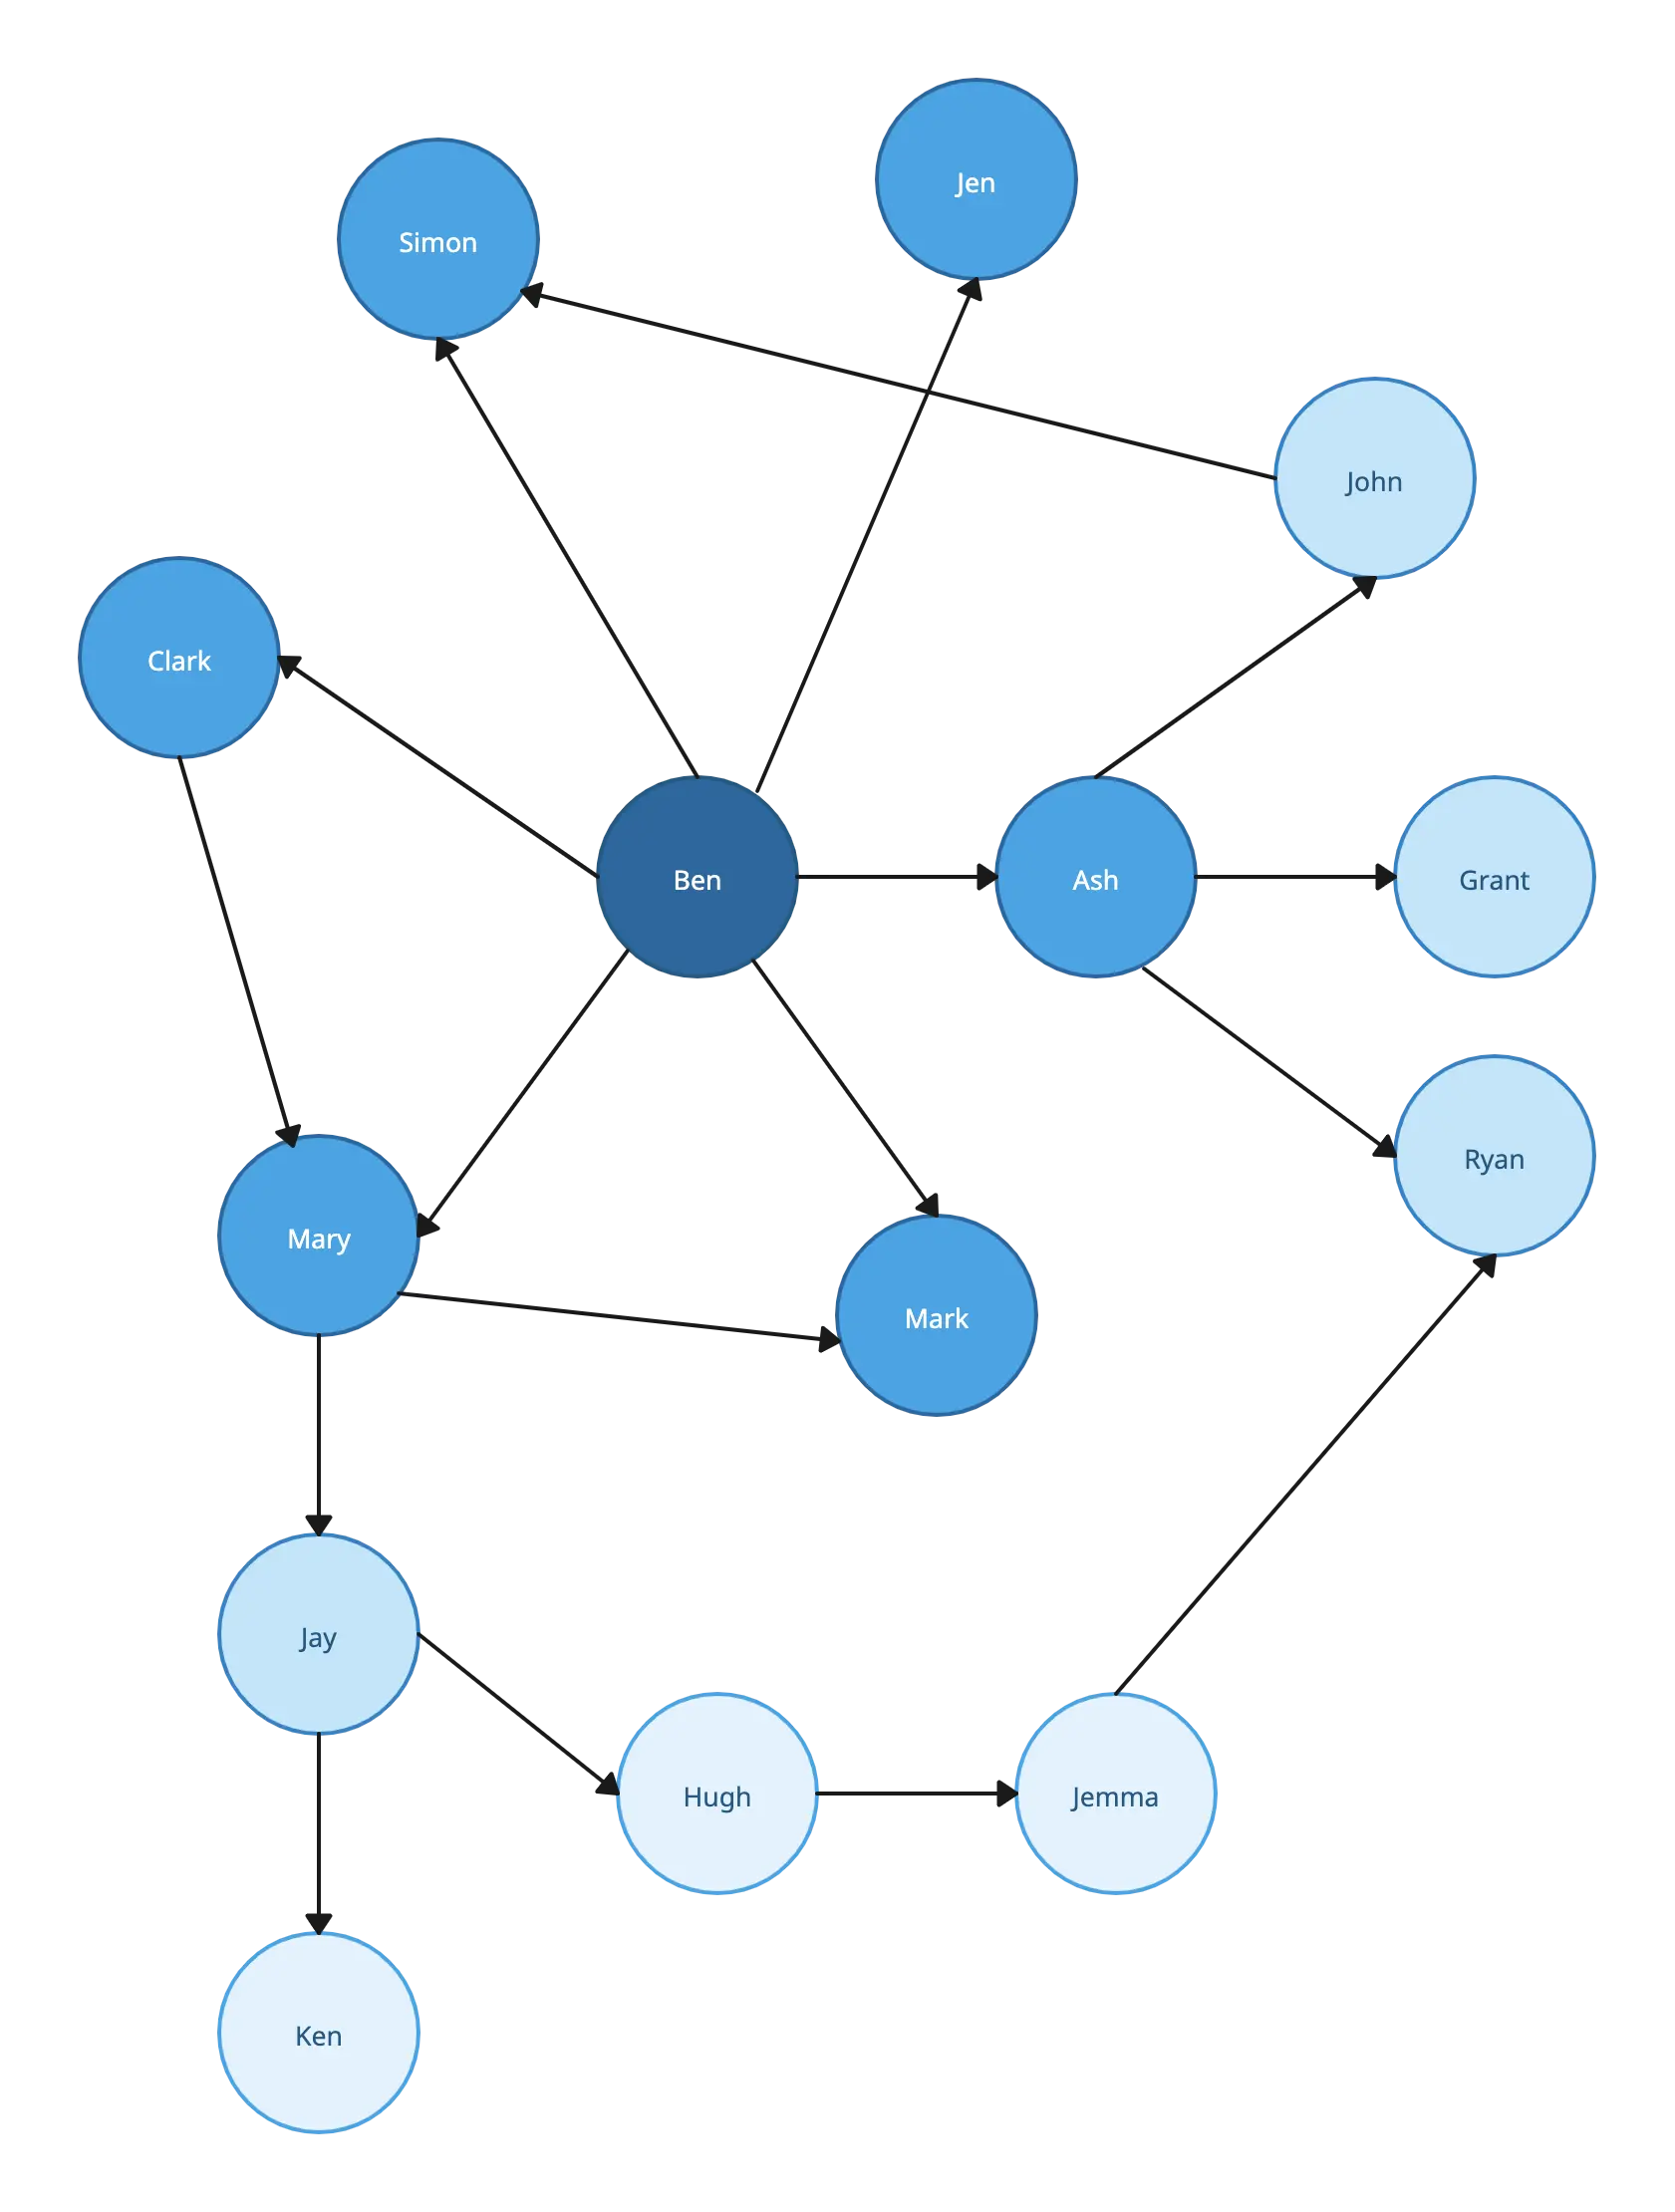
A sociogram maker is a tool used to visually map and analyze the relationships and social interactions within a group. It helps identify patterns such as friendships, influence, attraction, or isolation among individuals. Sociogram makers are especially useful for educators, researchers, social workers, and HR professionals looking to understand group dynamics, improve communication, and foster better collaboration.

How to Create a Sociogram with Creately’s Sociogram Maker?
Choose a Template or Start from Scratch:
You can select from pre-designed sociogram templates or create a new one from scratch using the blank canvas. Whether you’re analyzing classroom interactions, team dynamics, or social networks, there’s a template to suit your needs.Add and Customize Shapes:
Use Creately’s sociogram tools to drag and drop customizable shapes for individuals and relationships. Represent group members, their roles, and relationship types like attraction, indifference, or conflict. Adjust the size, color, and style to suit your diagram.Define Relationships with Connectors:
Use dynamic connectors to link individuals, showing how they interact with each other. You can easily modify the connectors to represent different types of relationships, such as close friends, acquaintances, or collaborators.Add Data and Context:
Enhance your sociogram by adding data fields to each shape. Store details like personal preferences, social links, and roles. You can also attach notes and documents for deeper context.Analyze Group Dynamics:
With the infinite canvas of Creately’s sociogram generator, you can zoom in, move elements around, and adjust the layout to better understand how individuals interact and form groups. This feature allows you to map complex social structures without limitations.Export or Share Your Sociogram:
Once your sociogram is ready, you can export it in multiple formats like PDF, PNG, SVG, or JPEG. You can also use the presentation mode to display your sociogram online in meetings or reports.Collaborate in Real Time:
The real-time collaboration feature of Creately’s free sociogram maker lets you work on the sociogram with others simultaneously. Share insights, make edits, and update the sociogram together without missing a beat.
Start Quickly with Customizable Sociogram Templates
FAQs About Creately’s Sociogram Maker
How can I create a sociogram with Creately’s Sociogram Maker?
With Creately’s sociogram creator, you can easily add customizable shapes and dynamic connectors to represent individuals and relationships. Simply drag and drop elements on the canvas, add relevant data, and use the sociogram generator to visualize group interactions.
Is Creately’s sociogram maker free?
Yes, Creately offers a free sociogram maker that allows you to create and share sociograms. You can start creating sociograms online and explore all features without any initial cost.
Can I use Creately’s Sociogram Maker for team analysis?
Absolutely! Creately’s sociogram tools are perfect for visualizing team dynamics. You can map out team member roles, relationships, and analyze collaboration patterns to improve group cohesion and performance.
Can I embed a sociogram in documents or presentations?
Yes, Creately makes it easy to embed your sociograms into Google Docs, Microsoft Word, or presentations, allowing for seamless sharing and reporting.
What are the benefits of using Creately’s sociogram tools?
Creately’s sociogram maker helps you visualize complex social structures, track relationships, and uncover patterns, making it ideal for social workers, HR professionals, and educators.
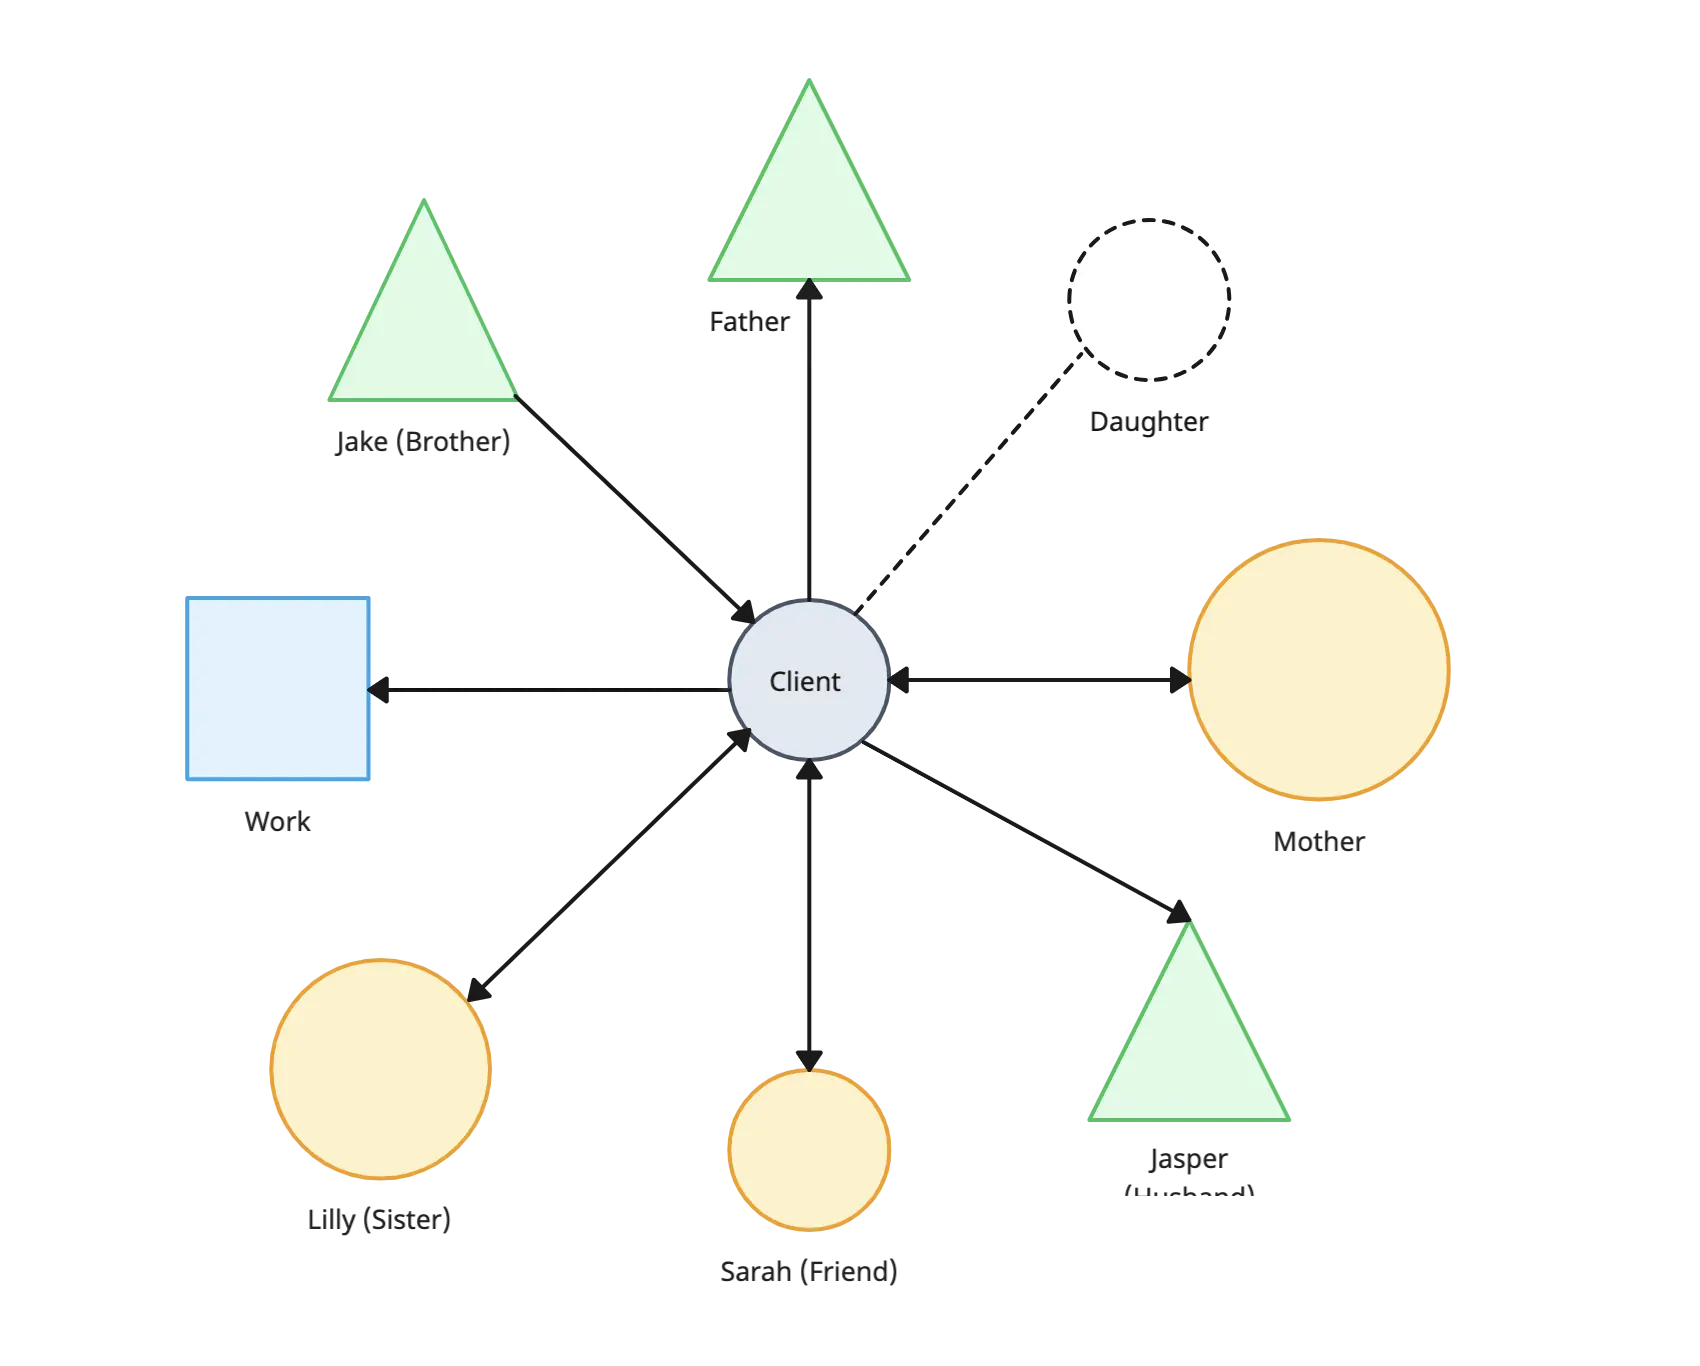
Why is Creately a Better Sociogram Maker?
Creately provides a visual collaboration platform that simplifies the process of organizing and analyzing complex family genograms. With its powerful tools, real-time collaboration features, and integration capabilities, Creately empowers teams to work more efficiently, improve decision-making, and achieve faster results.