Types of visual communication are all around us—on billboards, in social media posts, and in the videos we watch every day. Visuals are one of the most powerful ways to share ideas, tell stories, and make information easy to understand.
But visual communication goes beyond just pictures or videos. It includes various methods to deliver messages in clear, creative, and engaging ways. Whether you’re a business professional, an educator, or someone looking to improve communication skills, understanding the different types of visual communication can help you express ideas more effectively.
6 Key Types of Visual Communication
Visual communication encompasses various methods of conveying information through visual elements. Understanding the different types of visual communication can help in selecting the most effective approach for a given message. Here are some primary types of visual communication:
1. Graphic design
Graphic design is the art of using visuals to communicate messages. It involves creating designs that combine text, images, colors, and shapes to convey ideas effectively.
Examples
- Logos
- Brochures
- Advertisements
- Website designs
- Social media posts
Usage
Graphic design is used everywhere in marketing, branding, and communication. It helps businesses create a visual identity, such as a memorable logo, and design materials like brochures and advertisements to promote their products or services. It’s also essential for creating websites and social media graphics that capture attention and share information.
Benefits:
- Captures attention: Eye-catching designs grab people’s attention, especially in crowded spaces like websites or social media.
- Builds brand identity: Graphic design helps businesses create a recognizable and consistent brand look, which builds trust with customers.
- Simplifies complex ideas: Visuals, such as infographics, can break down complicated information and make it easier to understand.
- Enhances professionalism: Well-designed materials make businesses look more credible and trustworthy.
- Improves marketing: Good design makes marketing materials more engaging, helping to drive sales and attract customers.
2. Photography
Photography is the art of capturing real-life moments or scenes using a camera. It conveys emotions, tells stories, and can enhance the message being communicated.
Examples:
- Portraits
- Product photography
- Event photos
- Advertising imagery
- Stock photos
Usage
Photography is widely used in marketing, media, social media, journalism, and personal projects. In marketing, businesses use high-quality images of products to showcase their features and create a connection with customers. For example, a clothing brand might use professional photos of models wearing their latest collection to attract buyers. In social media, images are key to sharing personal experiences, memories, or events with friends and followers.
Benefits
- Captures emotions: Photos can evoke strong feelings, such as happiness, excitement, or sadness, helping to create a deeper connection with the audience.
- Tells a story: A single photo can tell a complete story, whether it’s showing how a product is used or documenting an important event.
- Boosts engagement: Photos are more likely to grab attention and get engagement on social media, making them an essential tool for digital marketing.
- Builds trust: High-quality, authentic images help to build credibility for a brand or message, making it easier for people to connect.
- Increases understanding: A photo can simplify complex ideas or demonstrate how something works better than text alone. For instance, a before-and-after photo of a product can highlight its effectiveness.
3. Video and animation
Video and animation use moving images and sound to convey information in a dynamic and engaging way. Videos capture real-world footage, while animations are created from graphics or illustrations.
Examples:
- Product demos
- Explainer videos
- Social media ads
- Tutorials
- Animated commercials
Usage
Videos and animations are widely used in marketing, education, entertainment, and business. In marketing, brands often use videos to demonstrate how their products work or tell a compelling story about their brand. Explainer videos are popular in simplifying complex topics, like how a new app or service works. Animation is also used in movies, cartoons, and advertisements to bring ideas to life in a creative way.
Benefits
- Engages viewers: Videos and animations are more engaging than static images or text, capturing attention and holding it longer.
- Explains complex ideas simply: Explainer videos and animations break down complicated information into easy-to-understand visuals, making it accessible for everyone.
- Improves retention: People remember information better when it’s presented through video or animation, making it a great tool for teaching or training.
- Boosts marketing effectiveness: Videos are highly shareable on social media, increasing brand visibility and helping to reach a wider audience.
- Encourages action: Videos often include a call-to-action (CTA), prompting viewers to take the next step, like purchasing a product or subscribing to a service.
4. Data visualization
Data visualization is the process of turning data into visual formats like charts, graphs, and maps. It helps people understand patterns, trends, and insights from large sets of data at a glance.
Examples
- Bar charts
- Line graphs
- Pie charts
- Heatmaps
- Infographics
Usage
Data visualization is widely used in business, marketing, healthcare, and finance to simplify complex data. For example, a company might use bar charts to show monthly sales trends, or a healthcare organization might use heatmaps to visualize patient data across different regions. It’s also common in reports, presentations, and dashboards where quick decision-making is needed based on data.
Benefits
- Makes data accessible: Data can be overwhelming, but visuals help break it down into something people can easily understand and act on.
- Uncovers insights: Visuals help reveal patterns, trends, and outliers that might not be obvious in raw numbers, making it easier to spot important insights.
- Saves time: Instead of reading through pages of data, viewers can quickly grasp the key points by looking at a graph or chart.
- Improves decision making: By presenting data visually, decision-makers can make more informed and quicker decisions, whether it’s adjusting a marketing strategy or forecasting business growth.
- Enhances communication: Visualized data is often more persuasive and easier to explain, helping stakeholders or audiences understand the story the data tells.
5. Illustrations and icons
Illustrations and icons are simple, often stylized images used to represent ideas, objects, or actions. Illustrations are detailed pictures, while icons are small, symbolic representations.
Examples:
- A lightbulb icon to represent an idea
- A hand-drawn illustration of a coffee cup
- A shopping cart icon for online stores
- Diagrams with custom illustrations for instructions
- Emojis used in text to express emotions
Usage
Illustrations and icons are widely used in websites, apps, educational materials, signage, and advertising. For example, icons are common in user interfaces to help users navigate through apps or websites, like a search icon or a menu icon. Illustrations are often used in educational content or marketing to explain complex ideas visually, like a custom illustration explaining a process step-by-step.
Benefits
- Simplifies complex ideas: Illustrations and icons make difficult concepts easy to understand by breaking them down into simple visuals.
- Enhances user experience: Icons, especially in digital interfaces, help users navigate and interact with websites and apps more intuitively.
- Increases engagement: Bright, colorful illustrations capture attention and make content more visually appealing, encouraging users to engage with it.
- Universal understanding: Icons are often universally recognized, transcending language barriers. For example, a trashcan icon is widely understood to mean “delete” or “remove” across cultures.
- Saves space: Icons condense information into compact visuals, saving space and making layouts cleaner and more organized.
6. Symbols and signs
Symbols and signs use simple images or shapes to convey specific messages or ideas without the need for words. They are universally recognized, making them powerful tools for quick communication.
Examples
- A red circle with a line through it to represent “no entry”
- A green checkmark for approval or success
- A skull and crossbones symbol for danger or poison
- A wheelchair symbol for accessibility
- Arrows indicating directions on road signs
Usage
Symbols and signs are used everywhere—from road signs that guide drivers to warning labels on products. They’re essential in environments where quick, clear communication is needed, such as airports, streets, public places, or workplaces. For instance, the “no smoking” sign at a public building instantly tells people the rule without needing any explanation.

Benefits
- Instant recognition: Symbols and signs convey messages quickly, even without words. People can understand them instantly, which is crucial in time-sensitive situations.
- Universal understanding: Many symbols and signs are universally recognized across different languages and cultures, making them effective for global or diverse audiences.
- Reduces miscommunication: By using standardized images, symbols and signs help eliminate confusion that could arise from language barriers or ambiguous wording.
- Improves safety: Road signs, warning labels, and safety symbols protect people by clearly communicating hazards or rules. For example, a “wet floor” sign prevents accidents by warning people of potential dangers.
- Streamlines communication: These visuals simplify communication, especially in busy or crowded environments, where it’s important to convey information quickly and efficiently.
How to Creately Different Types of Visual Communication Examples with Creately
Creately is an all-in-one visual communication tool that allows you to create various types of visual content easily and efficiently. Whether you’re designing marketing materials, presentations, data visualizations, or instructional guides, Creately has a variety of features to help you bring your ideas to life.
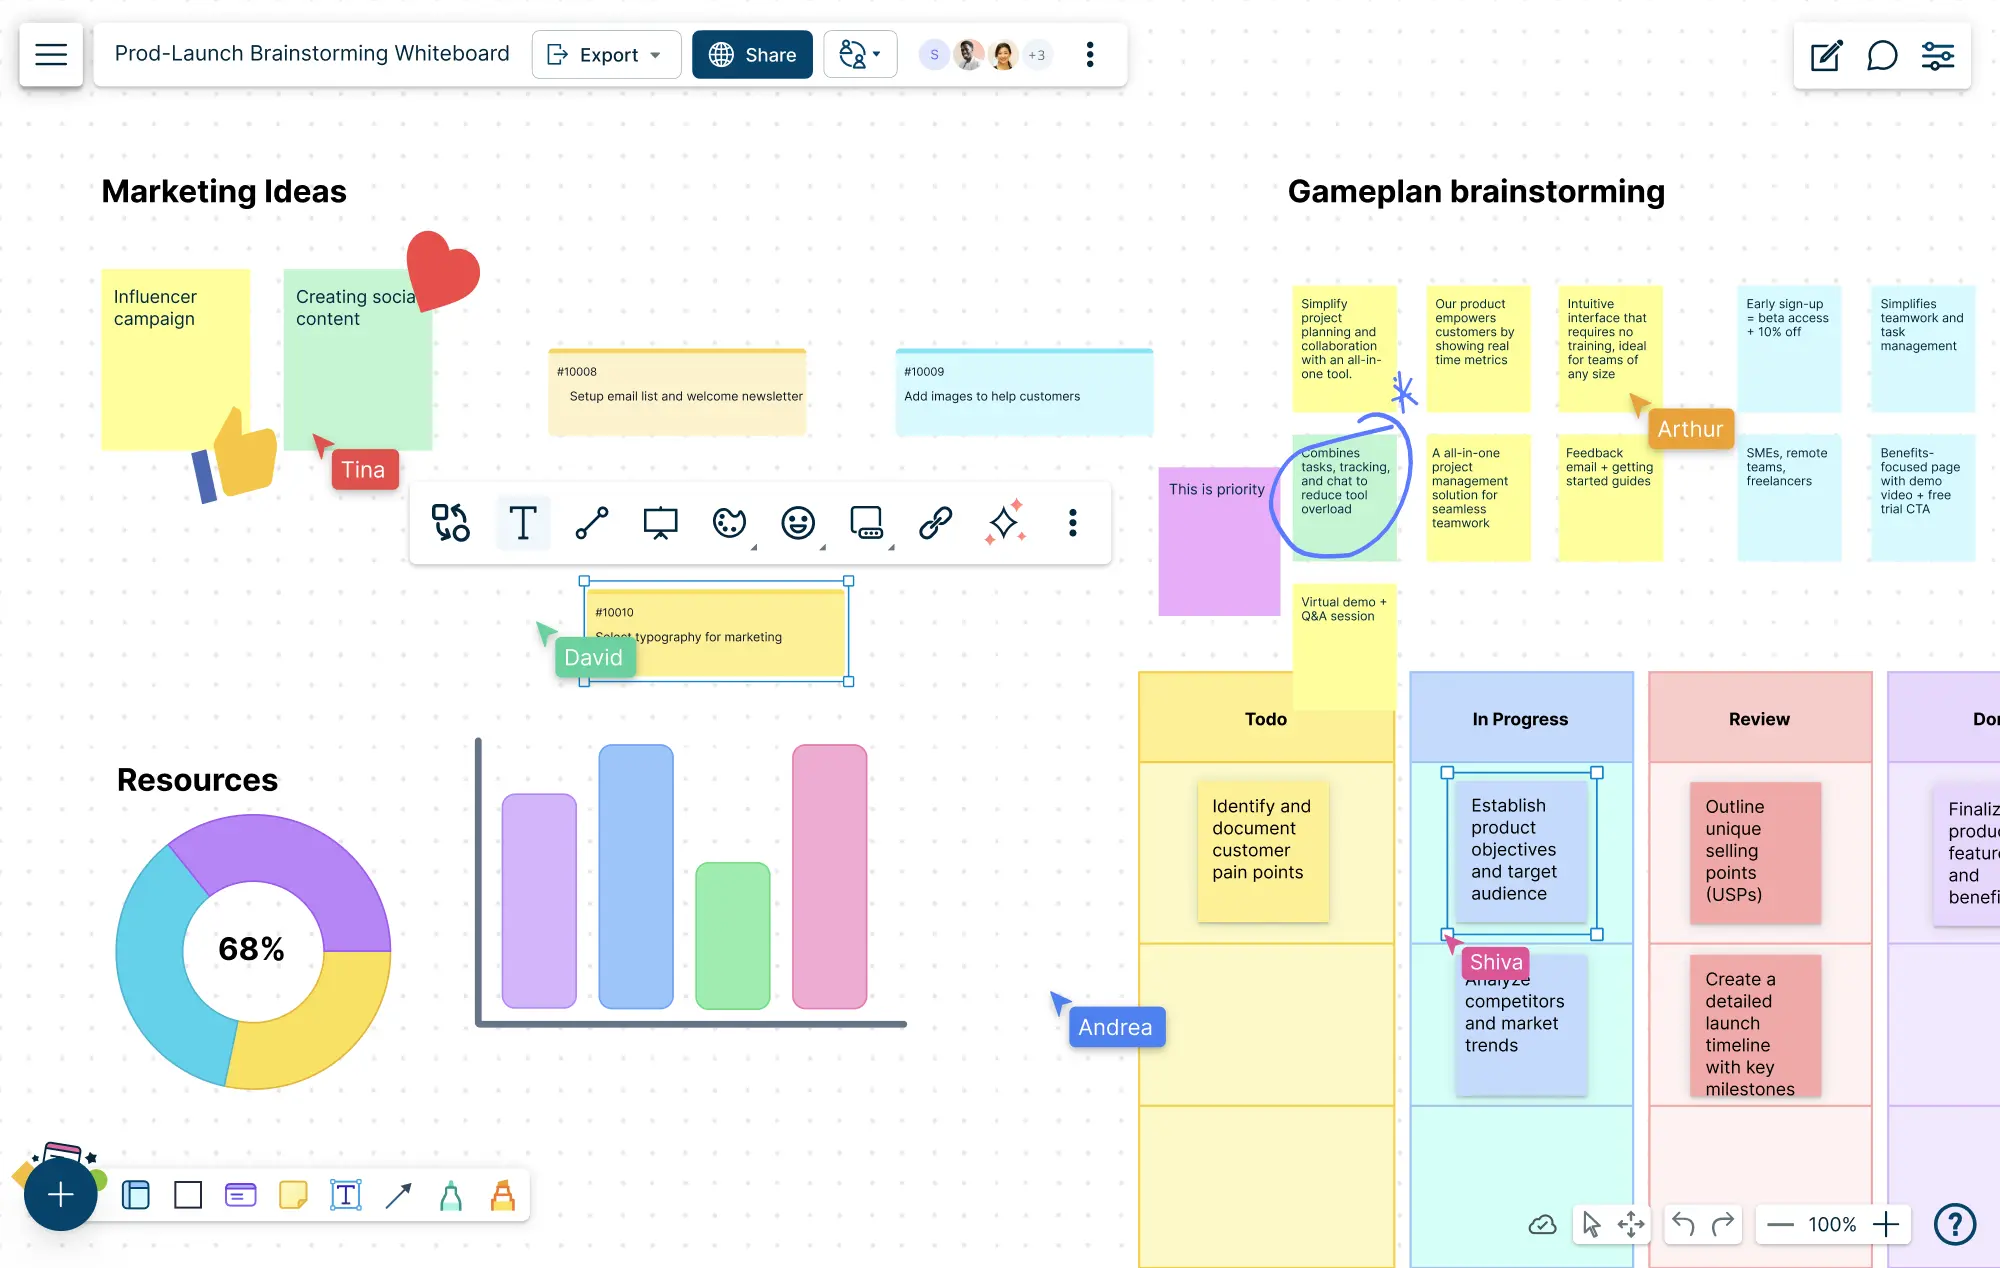
User-friendly interface
Creately’s drag-and-drop interface is designed for users of all skill levels. You don’t need to have any design experience to create professional-quality visuals. Simply drag shapes, icons, and other elements from the sidebar and arrange them to create your visual designs. This user-friendly approach enables anyone to create stunning visuals quickly, without the complexity of traditional design software.
Wide range of templates
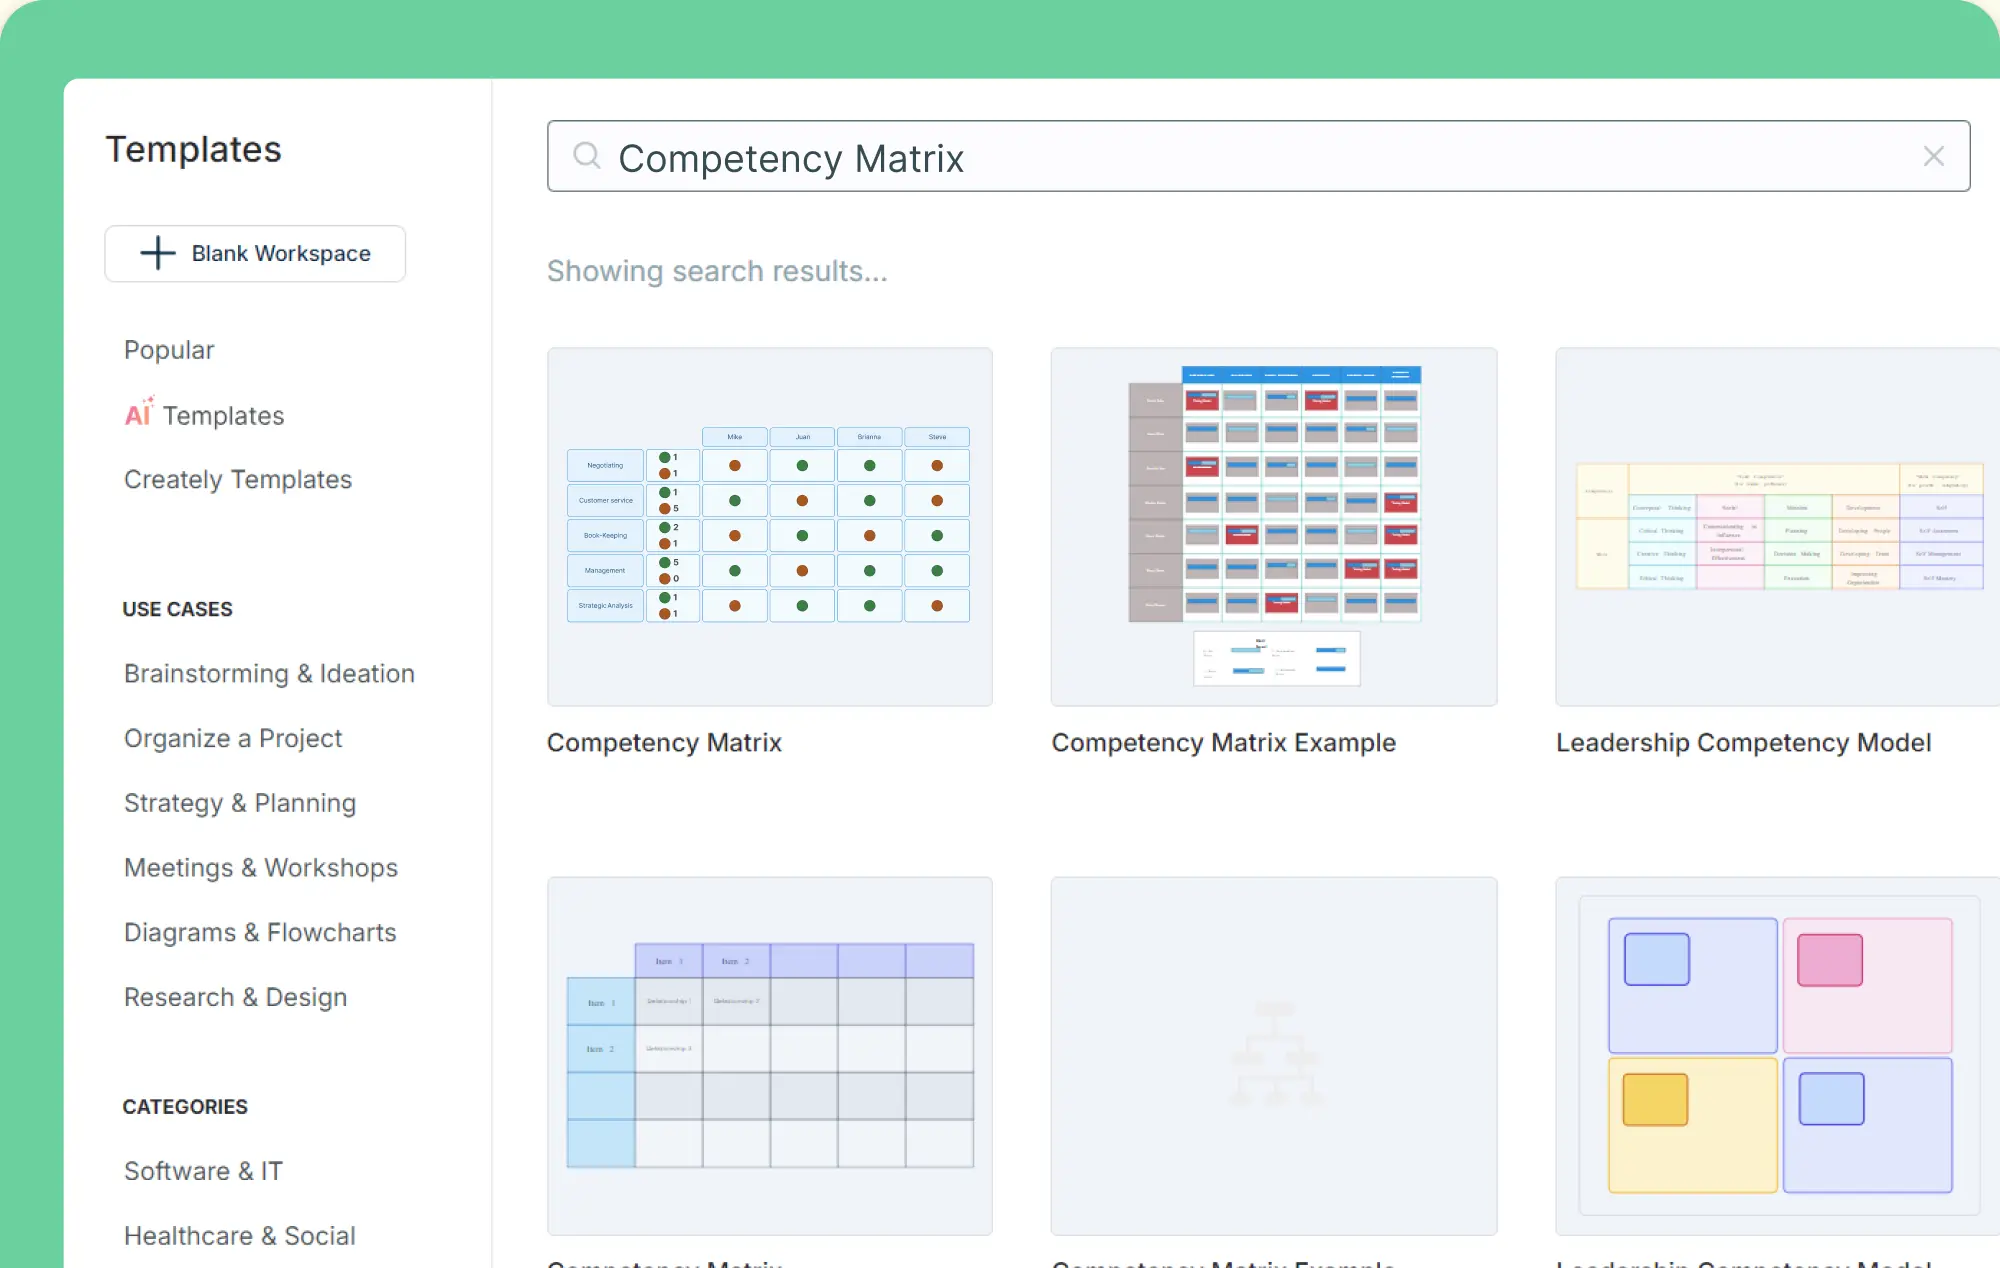
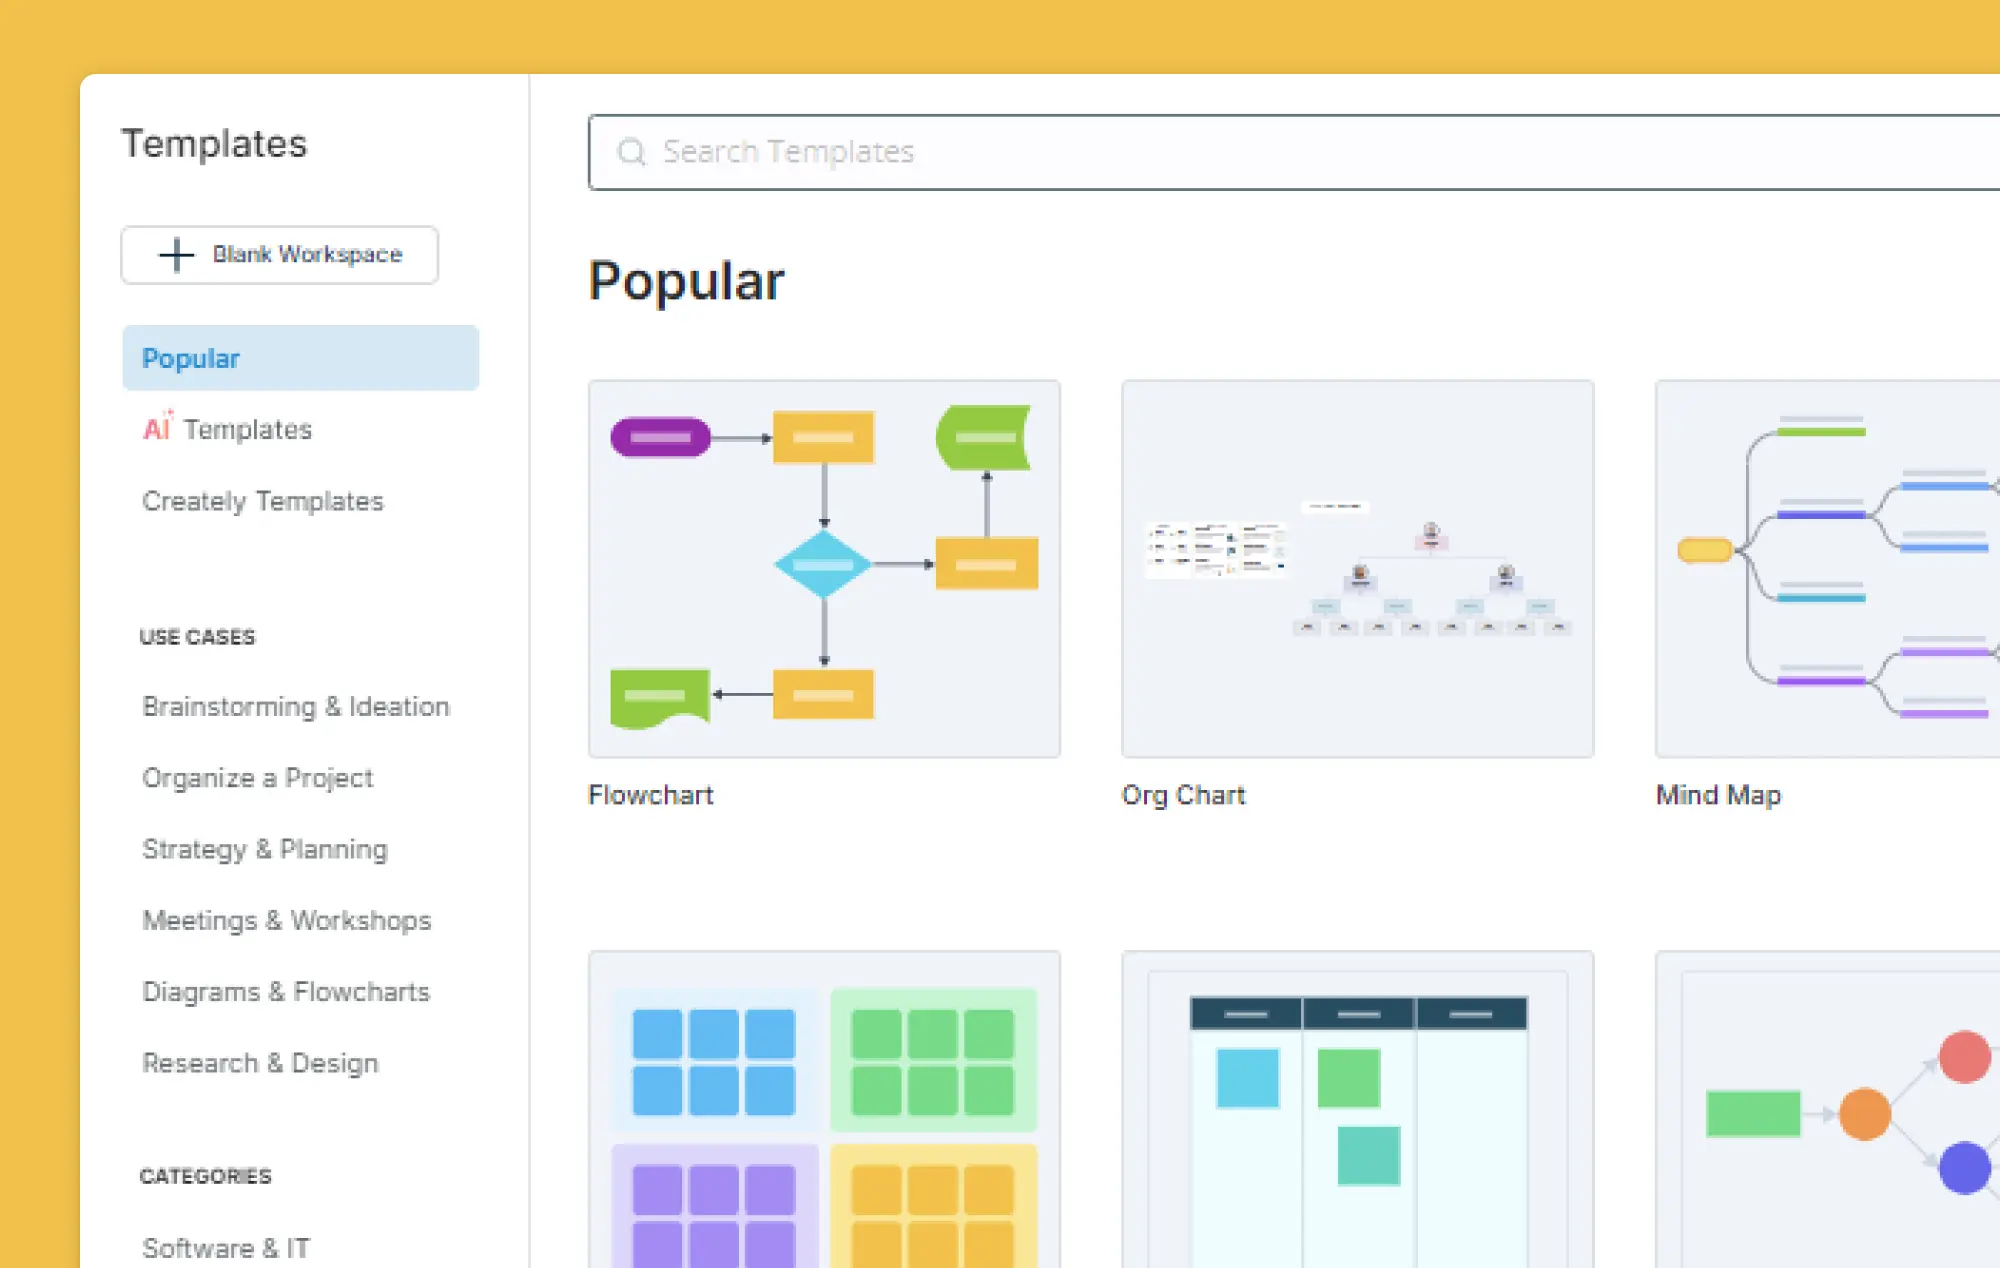
Creately offers a vast library of pre-designed templates that can kickstart your visual communication projects. Whether you need a flowchart, infographic, logo, mind map, or diagram, Creately has templates that are ready to customize. These templates save time and ensure consistency in your design work, giving you a professional starting point for your visual projects.
Real-time collaboration
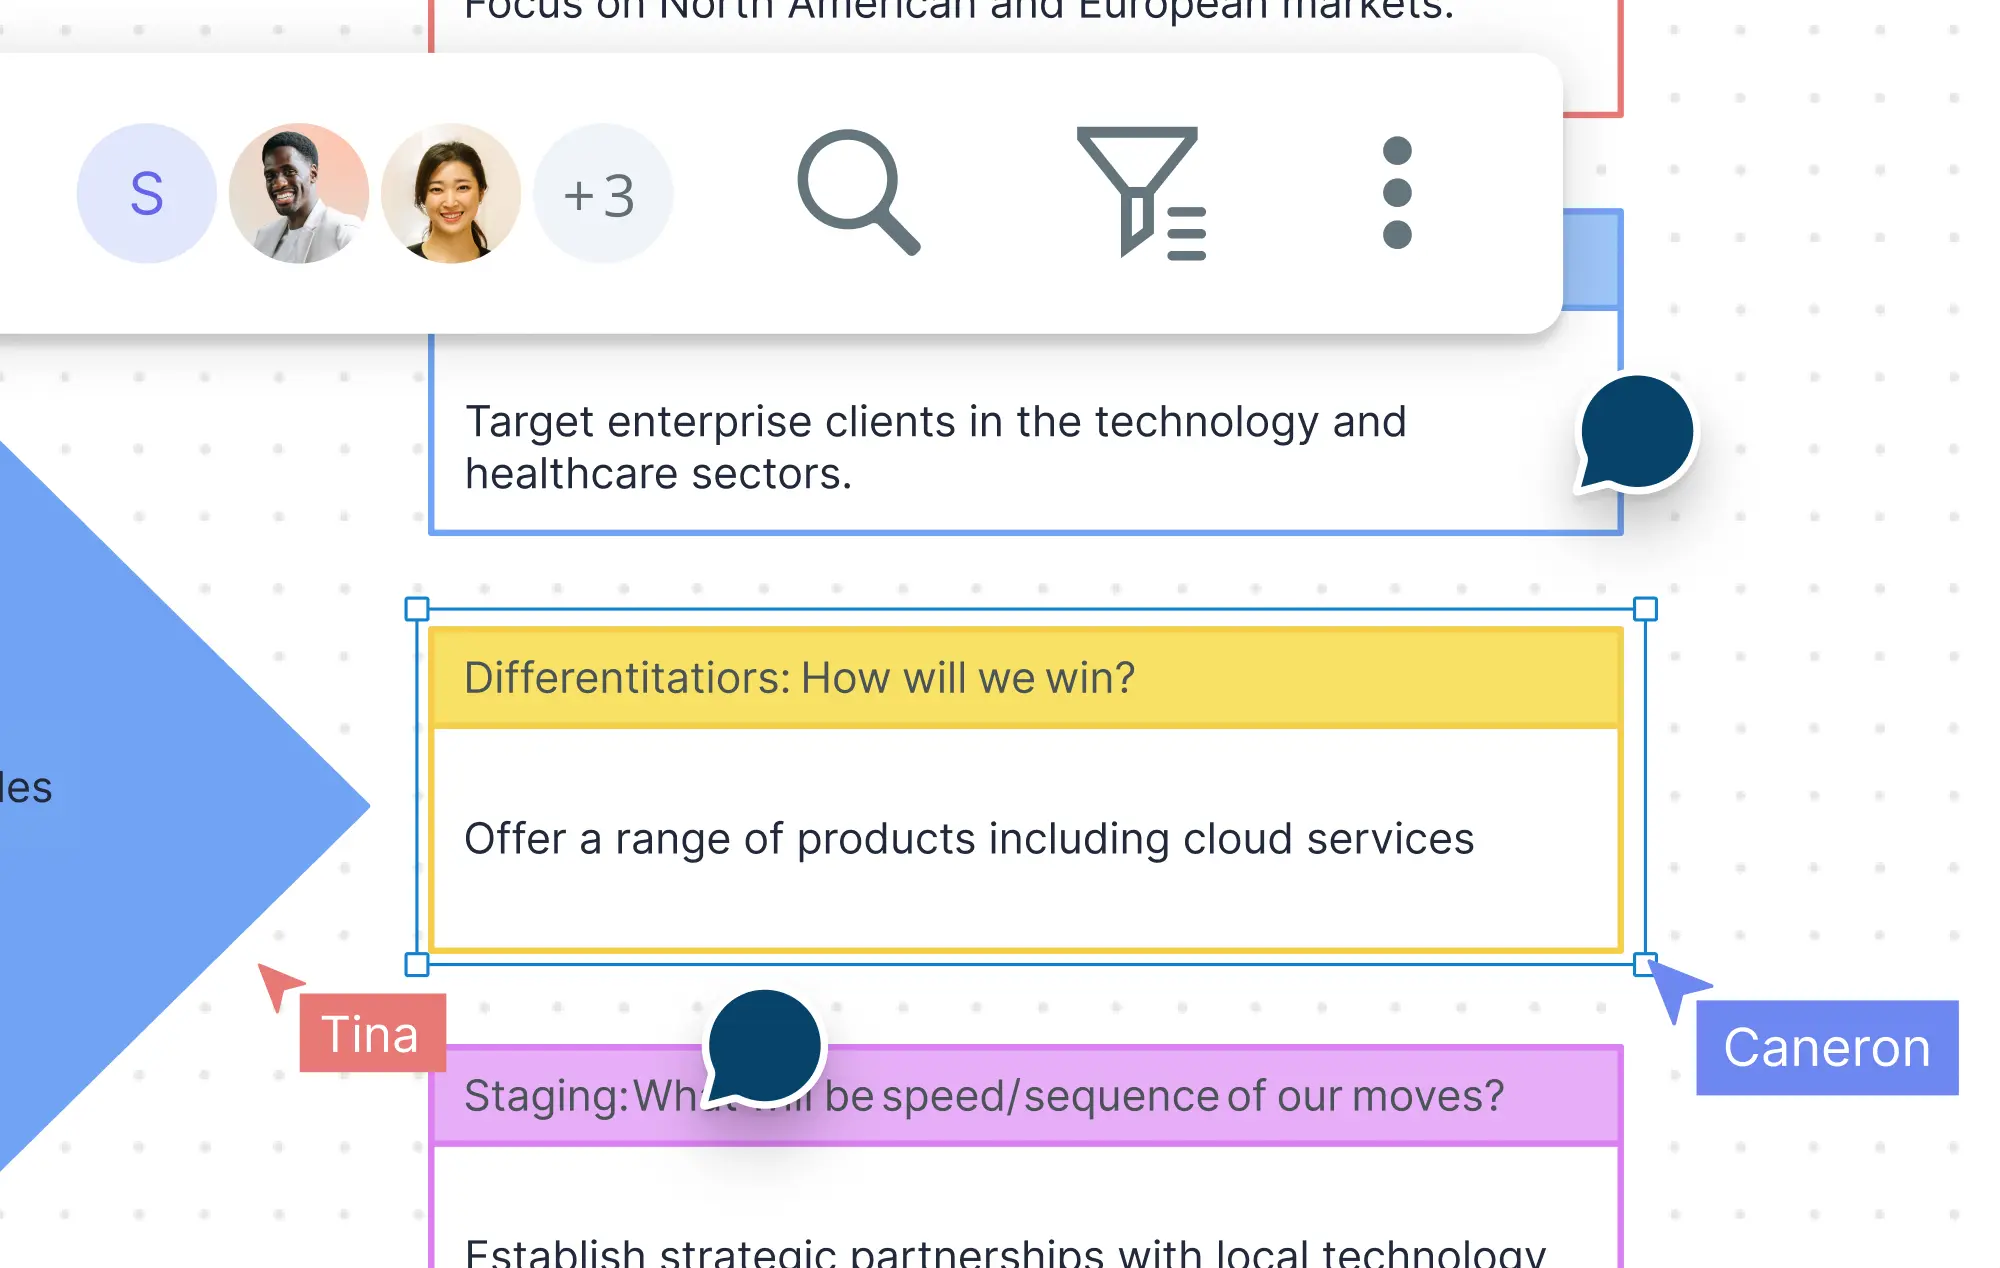
Creately makes team collaboration effortless with its real-time editing feature. You and your team members can work on the same design simultaneously, making it easy to brainstorm, share feedback, and iterate ideas. This is especially useful for teams working remotely, as it allows everyone to stay aligned and contribute to the design process, improving efficiency and creativity.
Data visualization tools
Creately provides powerful tools for creating data visualizations like charts, graphs, and infographics. These visuals help make complex data more accessible, understandable, and visually appealing. Whether you’re presenting financial data, survey results, or performance metrics, Creately’s visualization options make it easier to convey important insights to your audience in an engaging format.
Extensive library of icons and illustrations
With access to thousands of customizable visual elements, Creately offers an extensive library of icons, illustrations, and symbols that can be used to enhance your designs. You can easily drag and drop these elements into your visuals to illustrate concepts, add detail, and elevate your design. The ability to adjust the colors, sizes, and other properties of these elements makes it easy to maintain consistency with your branding or theme. Moreover you can browse for any other visual element you need with the built-in Google image search in the app.
Multiple diagram types and shape libraries
Creately offers a variety of diagram types, including mind maps, flowcharts, network diagrams, and organizational charts. Each diagram type comes with a wide selection of shapes and customizable templates that suit your needs. Whether you’re mapping out processes, creating a visual workflow, or designing an organizational structure, Creately’s diagram options provide all the flexibility you need to visualize your ideas effectively.
Ability to import and browse images
Creately gives you the ability to import your own images or search for visuals directly from Google Images through its built-in image search feature. This flexibility allows you to incorporate custom visuals into your designs or find relevant images to enhance your content. Whether it’s product photos, icons, or any other visual elements, you can easily integrate them into your projects.
AI-powered design suggestions (Creately VIZ)
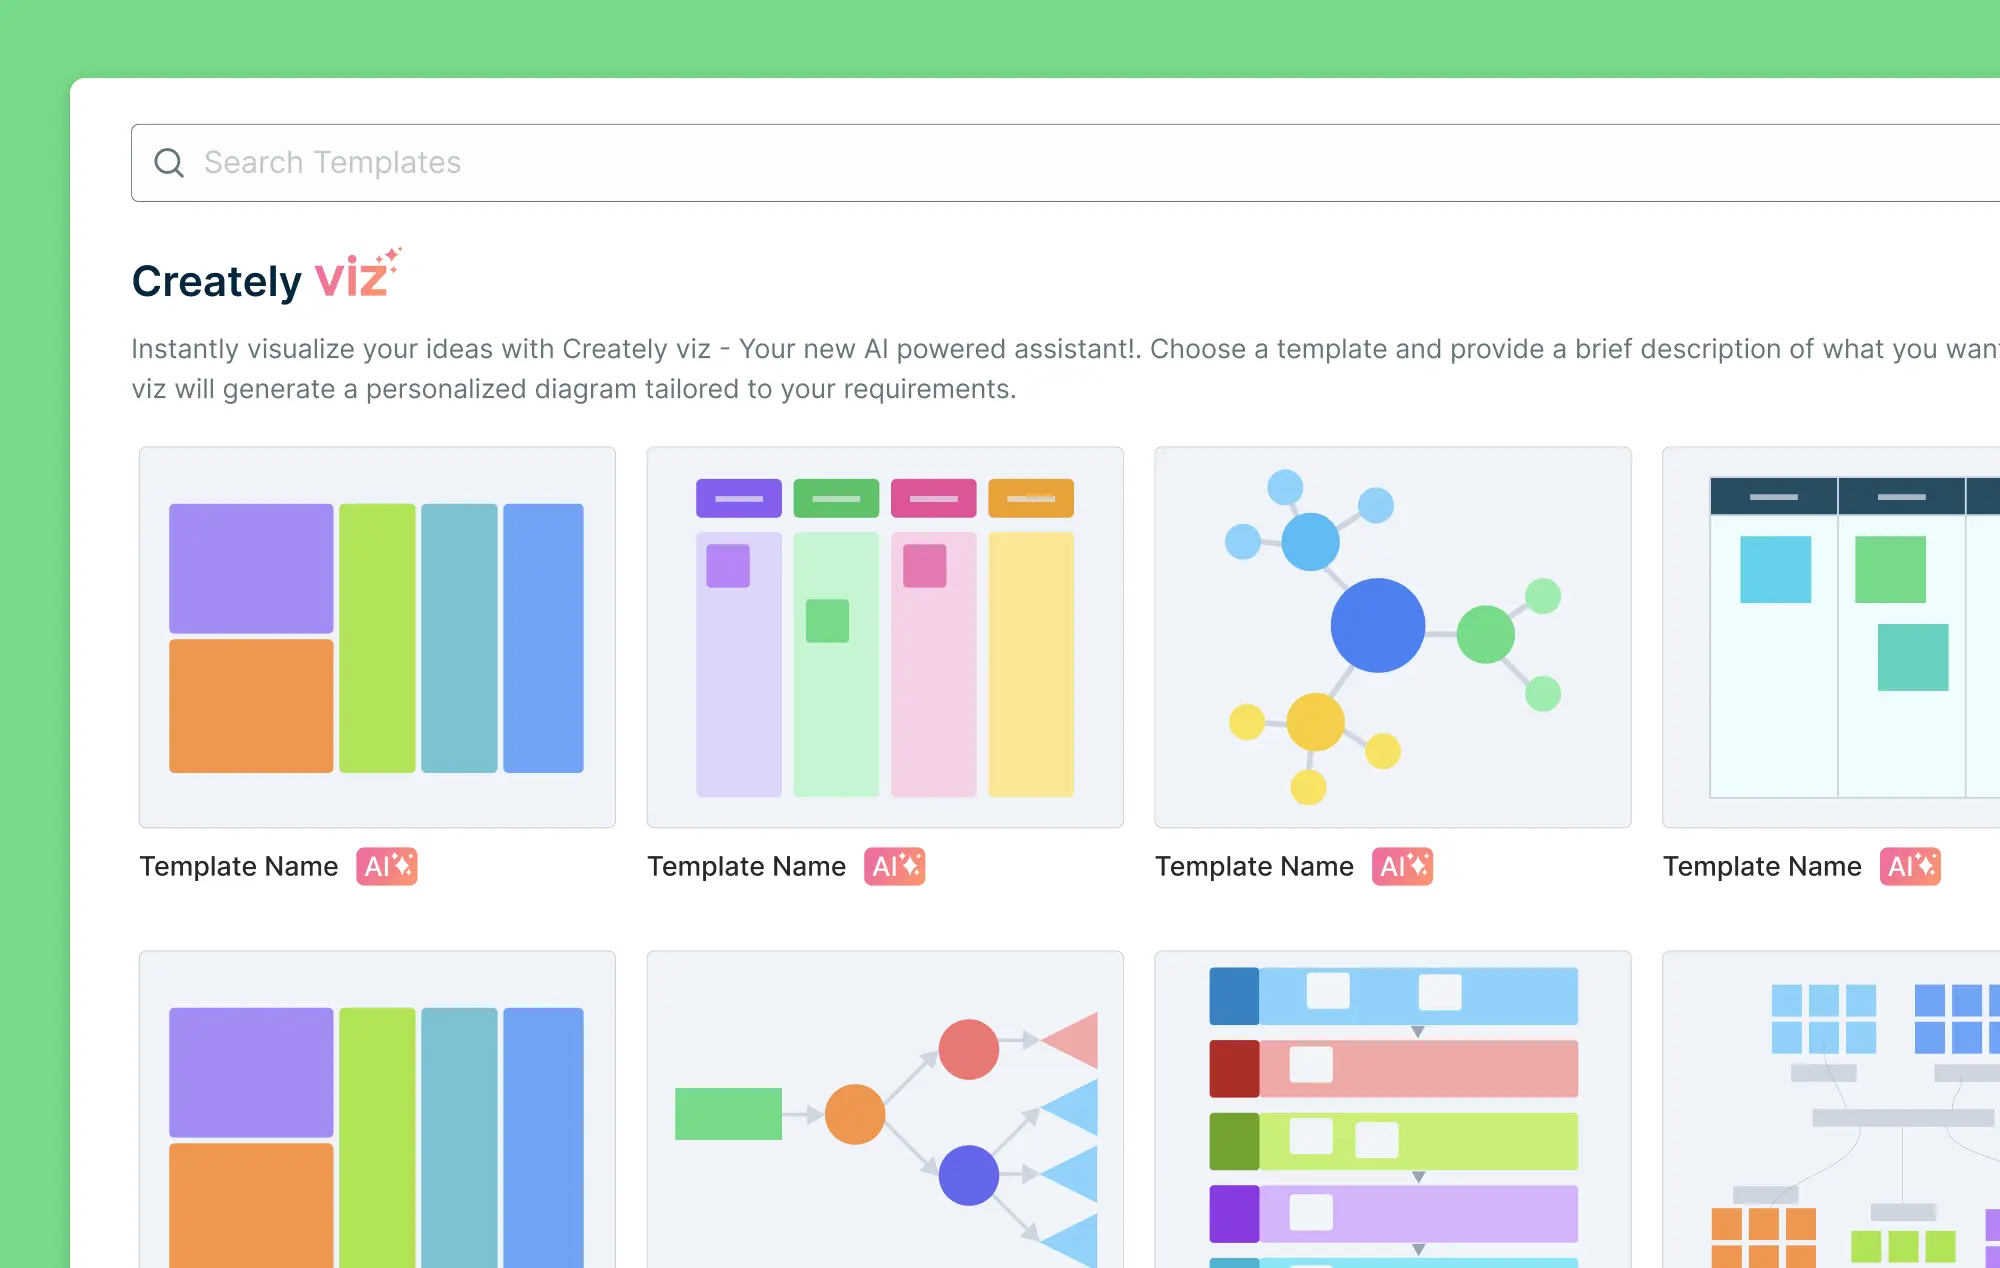
Use Creately’s AI tool to generate visual suggestions and improve the design process by offering quick, intelligent recommendations. It helps you quickly generate diagrams, charts, and visuals based on your content, saving time and improving design efficiency. By analyzing your input, Creately VIZ offers intelligent recommendations to optimize the layout, structure, and overall appearance of your visuals.
Multiple export options
Once your design is complete, Creately offers a range of export options to fit your needs. You can download your visuals in various formats, such as images (JPEG, PNG), and PDFs making it easy to share your work with others. Whether you need to integrate your design into a presentation, print materials, share it on social media or embed it in any site or intranet, Creately’s export options allow for seamless integration with other projects or platforms.
Conclusion: Different Types of Visual Communication
Visual communication is a powerful tool that helps convey messages quickly and clearly. From graphic design to symbols and signs, the different types of visual communication play a crucial role in making information more accessible and engaging. Whether you’re using images to tell a story, charts to explain data, or signs to ensure safety, these visual communication types help us connect, understand, and act faster.
As technology continues to advance, the use of visuals in communication will only grow. Understanding the different types of visual communication can help you choose the right tools for your message, whether for business, education, or everyday life. By incorporating visuals effectively, you can ensure your messages are not only heard but understood.
References
Ijaz, N. (2018). (PDF) Art of Visual Communication, Evolution and its Impact. [online] ResearchGate. Available at: https://www.researchgate.net/publication/330828287_Art_of_Visual_Communication_Evolution_and_its_Impact.
Thelander, Å. (2018). Visual Communication. The International Encyclopedia of Strategic Communication, pp.1–13. doi:https://doi.org/10.1002/9781119010722.iesc0198.
FAQs about Visual Communication Types
How can types of visual communication improve learning?
What role does color play in the types of visual communication?
How do types of visual communication impact marketing campaigns?
Can types of visual communication be used in different industries?
What are some best practices for using types of visual communication?


