A new tool can make a task faster while making the overall work harder. An automated form may reduce data entry, for example, but send more exceptions to an already overloaded team. A sociotechnical systems view helps you see why: the outcome depends on people, processes, and technology working together.
This guide explains the concept, walks through workplace examples, and shows how to map a system so that changes improve the work as a whole.
What Is a Sociotechnical System?
A sociotechnical system is a set of people and technical elements that interact to carry out work. The social side includes roles, skills, relationships, decision rights, and norms. The technical side includes software, equipment, data, and the procedures that shape how those tools are used. Processes connect the two sides in day-to-day work.
The central idea is joint design: a tool cannot be judged only by whether it works technically, and a team structure cannot be judged without considering the work and tools it supports. A peer-reviewed overview of sociotechnical systems explains why the social and technical parts need to be considered together.
For a practical map, begin with four questions:
- People: Who performs the work, makes decisions, receives the result, or is affected by it?
- Process: What steps, handoffs, exceptions, and rules govern the work?
- Technology and information: Which systems, devices, data, and interfaces enable those steps?
- Outcome and feedback: What result matters, and how do people learn whether the system is working?
These are mapping lenses, not fixed layers that every organization must use. A hospital, software team, and warehouse will have different boundaries and levels of detail.
Why Map People, Processes, and Technology Together?
Looking at one element alone can hide the cause of a problem. Slow approvals may appear to be a software issue, while the actual delay comes from unclear ownership. A high-performing tool may still fail if staff do not trust its output or have no time to review exceptions.
A shared system map helps a team:
- find handoffs where information is lost or work waits;
- see who can act when a tool fails or an unusual case appears;
- anticipate how a process change affects workload, customer experience, and controls;
- compare the current way of working with a proposed future state; and
- choose measures that reflect the whole outcome, not just tool usage.
The wider method is explained in our systems mapping guide. For a sociotechnical question, annotate the map with who owns each interaction, which tool supports it, and what feedback changes the next decision.


Sociotechnical System Examples
Customer support and ticket resolution
People: Customers, support agents, specialists, and team leads. Process: Intake, triage, response, escalation, and follow-up. Technology: Ticketing software, a knowledge base, and messaging tools. A customer-facing answer depends on the quality of the knowledge base and on whether agents can reach the right specialist. If a chatbot handles routine questions, map where it hands off uncertain cases and who corrects outdated answers.
Hospital discharge
Clinicians, patients, caregivers, pharmacists, and administrators use clinical records, prescriptions, and scheduling systems to coordinate a discharge. The process includes medication review, instructions, and follow-up booking. A successful record update does not guarantee that a patient understands the plan or that the pharmacy receives it on time. Mapping the handoffs makes those gaps visible.
Software incident response
Engineers, support staff, and incident leaders rely on monitoring, alerts, runbooks, and communication channels. An alert’s value depends on who receives it, whether the runbook reflects the current system, and how the team learns after an incident. Map both the technical signal and the human decision path.
In each example, the unit of analysis is the work outcome. The map should show the interactions that produce it, not merely list the people and software involved.
How to Map a Sociotechnical System
1. Define the outcome and boundary
Name one outcome, such as “resolve a customer issue without rework.” Mark where the work begins and ends. Decide whether customers, external suppliers, or regulators need to appear inside the map. A narrow boundary keeps the first version readable; record important external influences at the edge.
2. Capture the current work with its participants
Ask the people who do the work what happens in practice, including workarounds and exceptions. List each role, team, tool, data source, and rule. Do not assume the documented procedure describes the current state.
3. Draw the flow and handoffs
Use a process map or swimlane diagram to show steps, decisions, and ownership. Mark each point where work or information crosses a role or system boundary. Our process mapping guide explains how to build and review this kind of flow.

4. Add structure, tools, and feedback
Place the key teams beside the flow and show reporting or collaboration links where they affect decisions. A project team org chart can clarify who coordinates across functions, but add the actual collaboration paths as well. Draw connections to the systems and data each step uses. Then add feedback loops: where do errors, customer comments, or performance measures return to the people who can change the process?

5. Test changes against the whole system
Pick one friction point and ask what would change for each role, process step, and tool. If you automate triage, for instance, check who monitors exceptions, how customers can reach a person, and whether specialists receive enough context. Make a future-state map, agree on an owner for each change, and choose a small set of measures such as resolution time, rework, staff workload, and customer satisfaction. Review the map after the change; the system will not remain static.
Which Diagram Should You Use?
| Question | Useful diagram | What to add for a sociotechnical view |
|---|---|---|
| What affects the outcome? | System or activity map | People, tools, rules, dependencies, and feedback |
| Where does work get stuck? | Process or swimlane map | Owners, systems used, exceptions, and handoffs |
| Who coordinates the work? | Team structure or org chart | Collaboration paths and decision rights |
| Why does a problem recur? | Causal loop or interrelationship diagram | Reinforcing effects between behavior, workload, and tools |
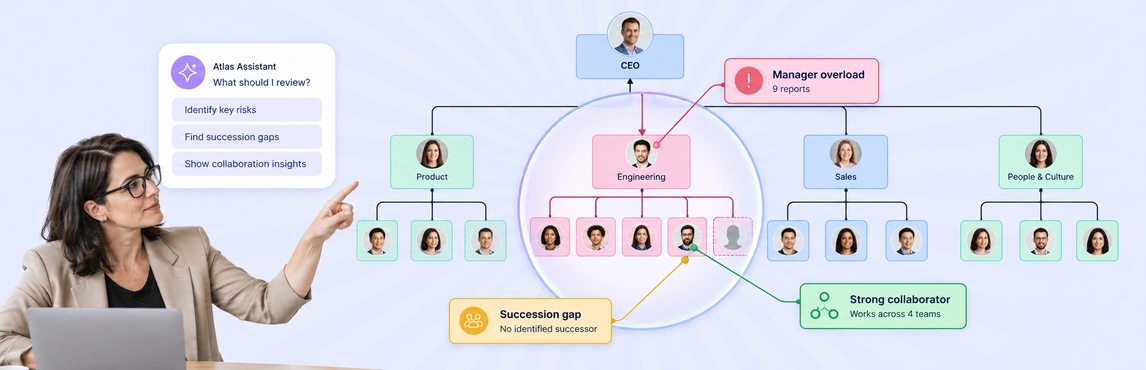
Often the clearest answer uses two linked views: a high-level system map for relationships and a detailed process map for the troublesome workflow. Creately Workspace provides a shared canvas for these diagrams and team review. When processes need an owned, searchable record, Creately Process supports process maps with steps, owners, and source context; Creately Atlas focuses on people and reporting structures.
Templates for Exploring a Sociotechnical System
The examples above show the core system, workflow, and team views. These additional templates help investigate causes, stakeholders, and accountability without repeating those three examples.


Helpful Resources
Choose a mapping method and learn how to show relationships and feedback loops.
Document the real steps, decisions, and handoffs in a workflow.
Show the reporting and collaboration structure behind cross-functional work.