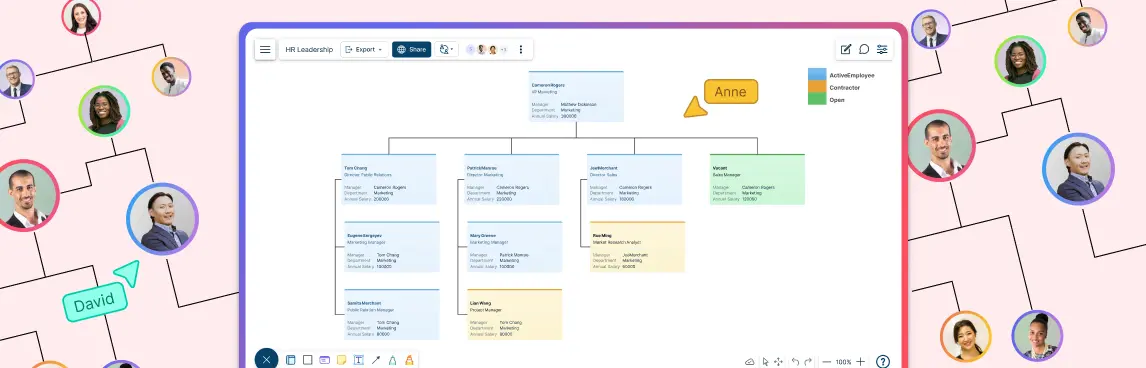
The right org chart solution keeps reporting lines clear, supports hiring and workforce decisions, and stays accurate without creating another manual HR database. Evaluate each option on eight requirements: data sync, update effort, planning depth, permissions, collaboration, history, usability, and implementation fit. A drawing tool is enough for occasional charts. HR teams managing frequent change need a connected org-intelligence layer.
This guide is for CHROs, Chief People Officers, VP HR leaders, People Operations teams, and recruiting leaders comparing organizational chart tools. It focuses on the decision, not on how to draw boxes and lines.
What Should HR Leaders Look for in an Org Chart Solution?
HR leaders should look for a solution that turns reliable people data into a usable view of the organization. The chart must be easy to understand, but visual polish alone is not enough. It should also help HR maintain reporting relationships, model change, control sensitive information, and give leaders a consistent basis for decisions.
Use these eight criteria as a first-pass evaluation:
- Data accuracy: Can the chart use data from your HRIS, directory, spreadsheet, or another approved source?
- Maintenance effort: What happens after a hire, transfer, promotion, manager change, or exit?
- Structural flexibility: Can it represent hierarchical, flat, divisional, and matrix reporting relationships?
- Workforce planning: Can HR compare the current organization with a proposed hiring plan or reorganization?
- Permissions: Can different audiences see appropriate views without exposing compensation, succession, or performance data?
- Collaboration: Can HR, recruiters, finance partners, and business leaders review the same plan with clear ownership?
- History and governance: Can you understand what changed, when it changed, and which version was approved?
- Adoption: Can managers and employees find the people and reporting context they need without specialist training?
Do not let a long feature list hide a weak operating model. Ask every vendor to demonstrate one real change from source data through review and publication.
How Should I Evaluate Org Chart Tools Before Choosing One?
Evaluate org chart tools against a representative workflow, score the results, and separate mandatory requirements from useful extras. A scripted evaluation is more reliable than a generic product tour because it exposes how the system handles your data, permissions, exceptions, and decision process.
Step 1: Define the decision the chart must support
Start with one primary job. Examples include maintaining a company directory, approving headcount, planning a reorganization, preparing a board view, supporting recruitment, or reviewing succession coverage. A product that is strong for presentation design may not be strong for governed workforce planning.
Step 2: Build a realistic test dataset
Use a small, anonymized sample that includes the difficult cases:
- A vacant approved position
- A contractor and a full-time employee
- A dotted-line relationship
- One person with a pending manager change
- A department with an unusually wide span of control
- A sensitive field that should be visible only to HR leadership
The test should prove how exceptions work, not just how quickly the first chart appears.
Step 3: Run the same scenario with every option
Ask each vendor or internal evaluator to complete this sequence:
- Import or connect the test roster.
- Correct a reporting-line error.
- Add an approved vacancy under the right manager.
- Create a proposed structure without changing the current view.
- Share a limited view with a hiring manager.
- Compare the current and proposed organization.
- Record who approved the change.
Step 4: Score evidence, not promises
Use a 1-to-5 score for each criterion, where 1 means the requirement is mostly manual and 5 means it works in the tested workflow with the required controls. Weight data accuracy, permissions, and maintenance more heavily if the chart will contain operational people data.
| Evaluation area | Weight | Evidence to request |
|---|---|---|
| Data connection and validation | 20% | Successful import or sync, error handling, field mapping |
| Ongoing maintenance | 15% | Demonstration of a hire, transfer, and exit update |
| Scenario and workforce planning | 15% | Isolated proposed structure and comparison with current state |
| Permissions and privacy | 15% | Role-appropriate views using the same underlying organization |
| Reporting relationships | 10% | Direct, dotted-line, vacant, and matrix relationships |
| Collaboration and approvals | 10% | Comments, ownership, review status, and handoff |
| History and auditability | 10% | Version or change history and an as-of view |
| Usability and rollout | 5% | Completion by a typical HR or manager user |
Set the pass mark before reviewing products. Also define any non-negotiable requirement that causes an automatic fail, such as exposing restricted data or overwriting the current organization during scenario planning.
Is a Template, Workspace, or Org-Intelligence Platform the Right Fit?
Choose the lightest solution that reliably supports the job. A free template, collaborative workspace, and org-intelligence platform solve different levels of the same problem.
| Your situation | Best-fit starting point | Why |
|---|---|---|
| One-time chart for a small team or presentation | Editable org chart template | Fast to start and easy to customize |
| Recurring updates owned by HR or a team lead | Collaborative visual workspace | Shared editing, reusable structure, comments, and controlled handoff |
| Frequent changes across departments and data owners | Connected HR org chart software | Reduces manual reconstruction and keeps structure tied to source data |
| Reorganizations, headcount scenarios, succession, or leadership reporting | Org-intelligence platform | Adds planning, governed views, comparisons, and organizational analysis |
Creately org chart software supports fast org chart creation with editable templates and visual collaboration. It is the practical self-serve path when the immediate need is to create, share, and improve an organizational chart.
Creately Atlas is the deeper path for CHROs and People Operations teams that need current org data, workforce and headcount planning, succession context, separate people and position records, and historical views based on effective-dated relationships. It uses imported org data alongside the HRIS rather than replacing it. This separation matters: the HRIS remains the source of record, while the org-intelligence layer helps leaders understand and plan the organization.
How Do Org Charts Support Recruitment and Hiring Management?
An org chart supports recruitment when it connects an open role to the organization around it. Recruiters and hiring managers can see where the role sits, who it reports to, which team it joins, and how the hire affects approved headcount before the requisition moves forward.
Consider a product team planning to hire three roles. A useful hiring view shows:
- The approved Product Operations Manager vacancy under the VP Product
- Two planned analyst roles that depend on the manager hire
- The expected span of control after all three positions are filled
- Ownership of each requisition and its approval state
- The current structure alongside the proposed structure
That context helps the recruiter validate the reporting line and role title before sourcing begins. It helps Finance confirm that the positions match the approved plan. It helps the hiring manager explain the team design to candidates. For a detailed planning-to-requisition workflow, use the related guide on aligning org charts with workforce planning and hiring.
The org chart should not become a second applicant tracking system. Keep candidate stages and recruiting operations in the ATS. Use the chart to clarify organizational placement, approved roles, dependencies, and the intended future structure.
How Do HR Leaders Use Org Charts for Headcount and Workforce Planning?
HR leaders use org charts for workforce planning by comparing the current organization with a proposed future state. The visual structure makes approved vacancies, reporting changes, management layers, and capacity gaps easier to review across HR, Finance, and business leadership.
A strong evaluation should test whether the solution can:
- Mark current, vacant, and proposed positions distinctly
- Model a reorganization without changing the published structure
- Compare scenarios such as growth, consolidation, or acquisition integration
- Review spans of control and management layers
- Attach decision context without exposing restricted employee information
- Preserve an approved snapshot for later review
The chart is a decision surface, not the entire workforce-planning model. Budget, compensation, and financial forecasts may remain in specialist systems. The org solution should make the structural implications visible and keep the relevant links between roles, teams, and plans.
How Should an Org Chart Stay Accurate as the Company Changes?
An operational org chart should update from an agreed source and follow a defined ownership process. Manual redraws can work for occasional presentations, but they become fragile when hires, exits, transfers, and title changes happen continuously.
Ask these questions during evaluation:
- Which system is authoritative for names, titles, managers, departments, and employment status?
- How are missing managers, duplicate records, and circular reporting relationships identified?
- Can HR review changes before they appear in a leadership or company-wide view?
- Can teams use a controlled spreadsheet import when a direct connection is unavailable?
- Can the solution show the organization as it existed at an earlier date?
- What happens when the source system and a proposed planning scenario disagree?
Creately Atlas uses reviewed CSV imports and editable org records for planning and analysis without replacing the HRIS. That model keeps system ownership clear: record changes happen in the appropriate source, while planning and analysis happen in the organizational view.
Which Security, Permission, and Governance Controls Matter?
Permissions should follow the data, audience, and purpose of each view. A company directory, a hiring plan, and an executive succession review should not expose the same fields even if they use the same basic reporting structure.
Evaluate whether the solution can provide:
- View, edit, and administrative roles
- Department- or audience-specific views
- Restricted handling for compensation, performance, succession, and demographic fields
- Clear ownership for current and proposed structures
- Change history or another reviewable record
- Revocable sharing and controlled exports
Use the security review to test actual access, not only policy documents. Create a restricted test field, sign in as a manager-level user, and confirm that the information is not visible in the chart, search, export, or shared link.
How Should Creately Be Compared with Canva, Lucidchart, and Other Options?
Compare products by the job you need completed. Canva is commonly considered for design-led templates, while Lucidchart and Creately are considered for diagramming and collaboration. The more important distinction for HR leadership is whether the evaluation stops at drawing or extends into governed organizational data and planning.
Use the same test script for every option and verify current capabilities directly with each vendor. Product packages change, so avoid scoring from an old comparison article or a feature-list screenshot.
| Decision question | What a design-first tool must prove | What an org-intelligence option must prove |
|---|---|---|
| Can we create a clear chart quickly? | Templates, editing, layout, and export | Fast initial structure plus data onboarding |
| Can we keep it current? | Repeatable manual ownership | Reliable source connection and change handling |
| Can we plan future structures? | Duplicate-and-edit workflow | Isolated scenarios and current-to-future comparison |
| Can we protect sensitive fields? | File and sharing controls | Field- and audience-appropriate access |
| Can leaders use it for decisions? | Clear presentation and comments | Structural analysis, history, and governed context |
What Should the Final Buying Decision Include?
The final decision should include the weighted score, proof from the test workflow, implementation ownership, data and security review, expected maintenance effort, and a clear next step for each buyer type. Do not approve a product only because it produced the best-looking sample chart.
Choose the self-serve path when the team needs templates, visual editing, and collaboration without complex workforce governance. Start an organizational chart in Creately and test it with a representative team structure.
Choose the enterprise evaluation path when HR needs connected org data, permissioned workforce views, scenarios, history, or cross-functional governance.
Org Chart Solution Evaluation Checklist
Before choosing a solution, confirm that your team has:
- Named the primary organizational decision the tool must support
- Identified the authoritative source for people and position data
- Tested vacancies, dotted lines, transfers, and restricted fields
- Scored each option against the same weighted criteria
- Defined automatic-fail requirements before vendor reviews
- Separated current-state publishing from future-state scenario planning
- Assigned ownership for data, chart maintenance, approvals, and access
- Chosen distinct self-serve and enterprise next steps
Helpful Resources for Evaluating Org Chart Solutions
Compare common organizational structures and choose a chart that represents how work and accountability flow.
Improve readability, ownership, and maintenance before rolling an org chart out across the organization.
Explore the self-serve and connected capabilities available for HR teams building organizational charts.