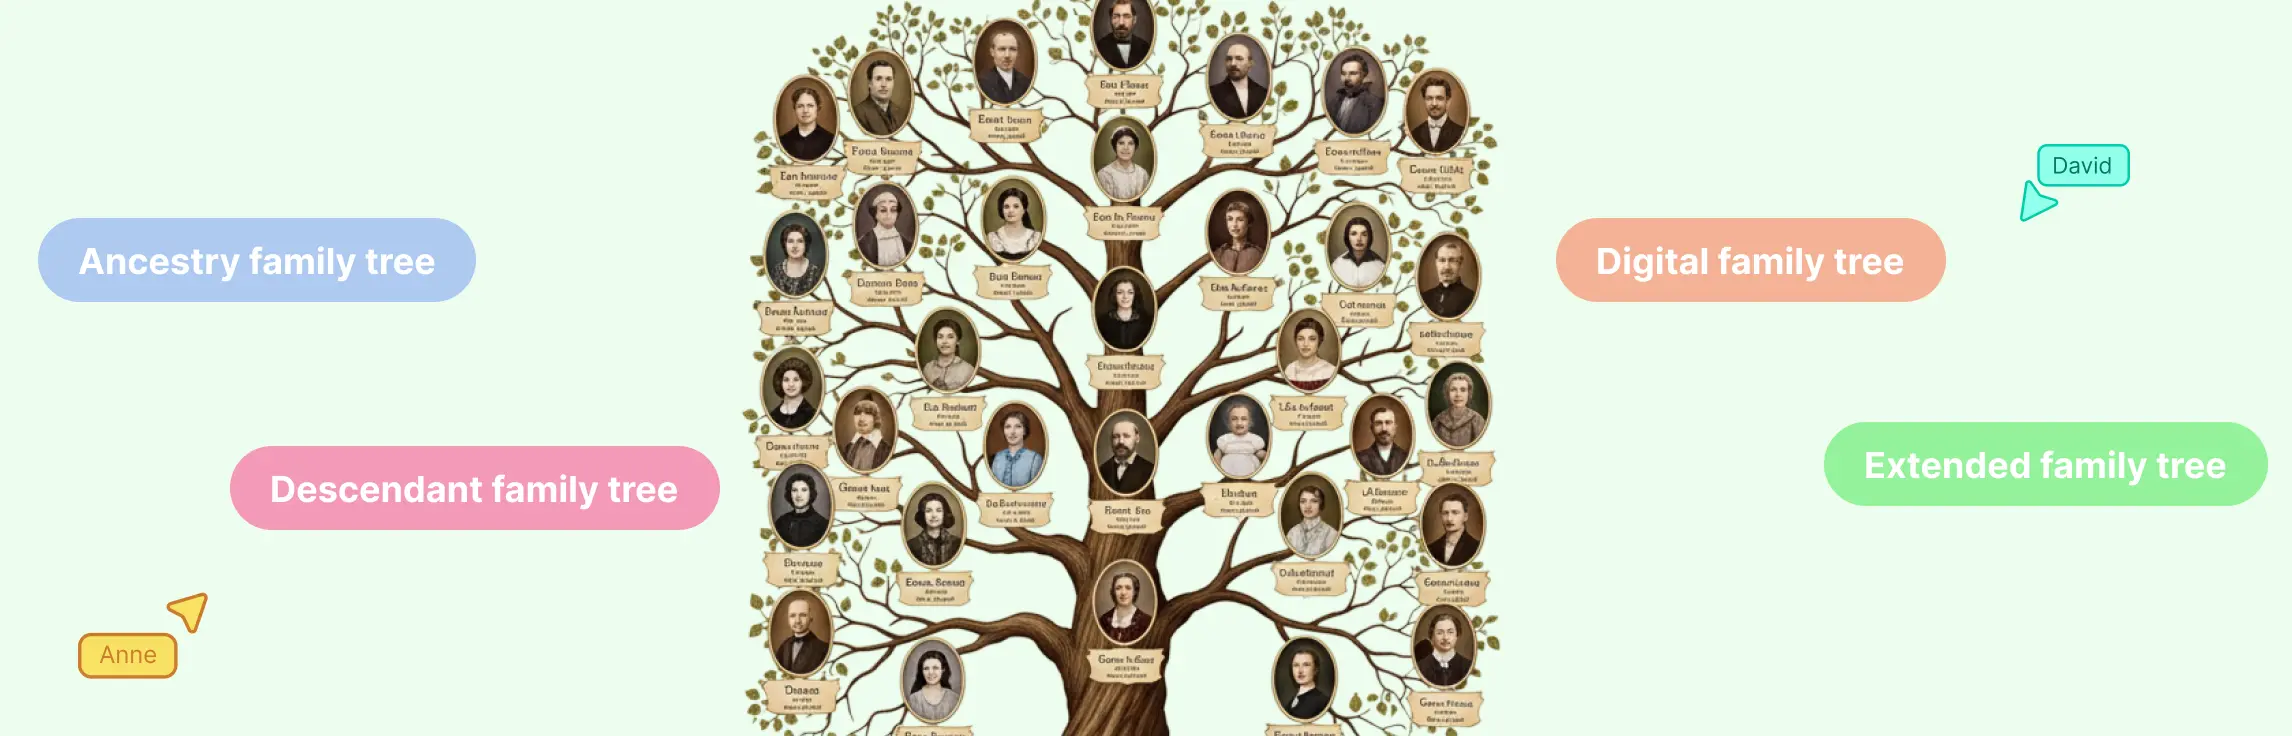
Understanding how people, services, and institutions connect within a shared environment can be difficult, but a community genogram makes those relationships easier to see. Unlike a family-only diagram, it helps map the broader support systems around schools, clinics, nonprofits, neighborhoods, and other community spaces.
In this guide, you’ll explore 10 practical community genogram examples that show how these diagrams can be used in healthcare, social work, education, nonprofit planning, and community support. Each example includes an editable community genogram template to help you adapt the format for your own project, whether you need a simple planning tool or a more detailed visual reference. You can also use Creately’s templates, relationship lines, and notes to turn these examples into working diagrams your team can review, update, and share.
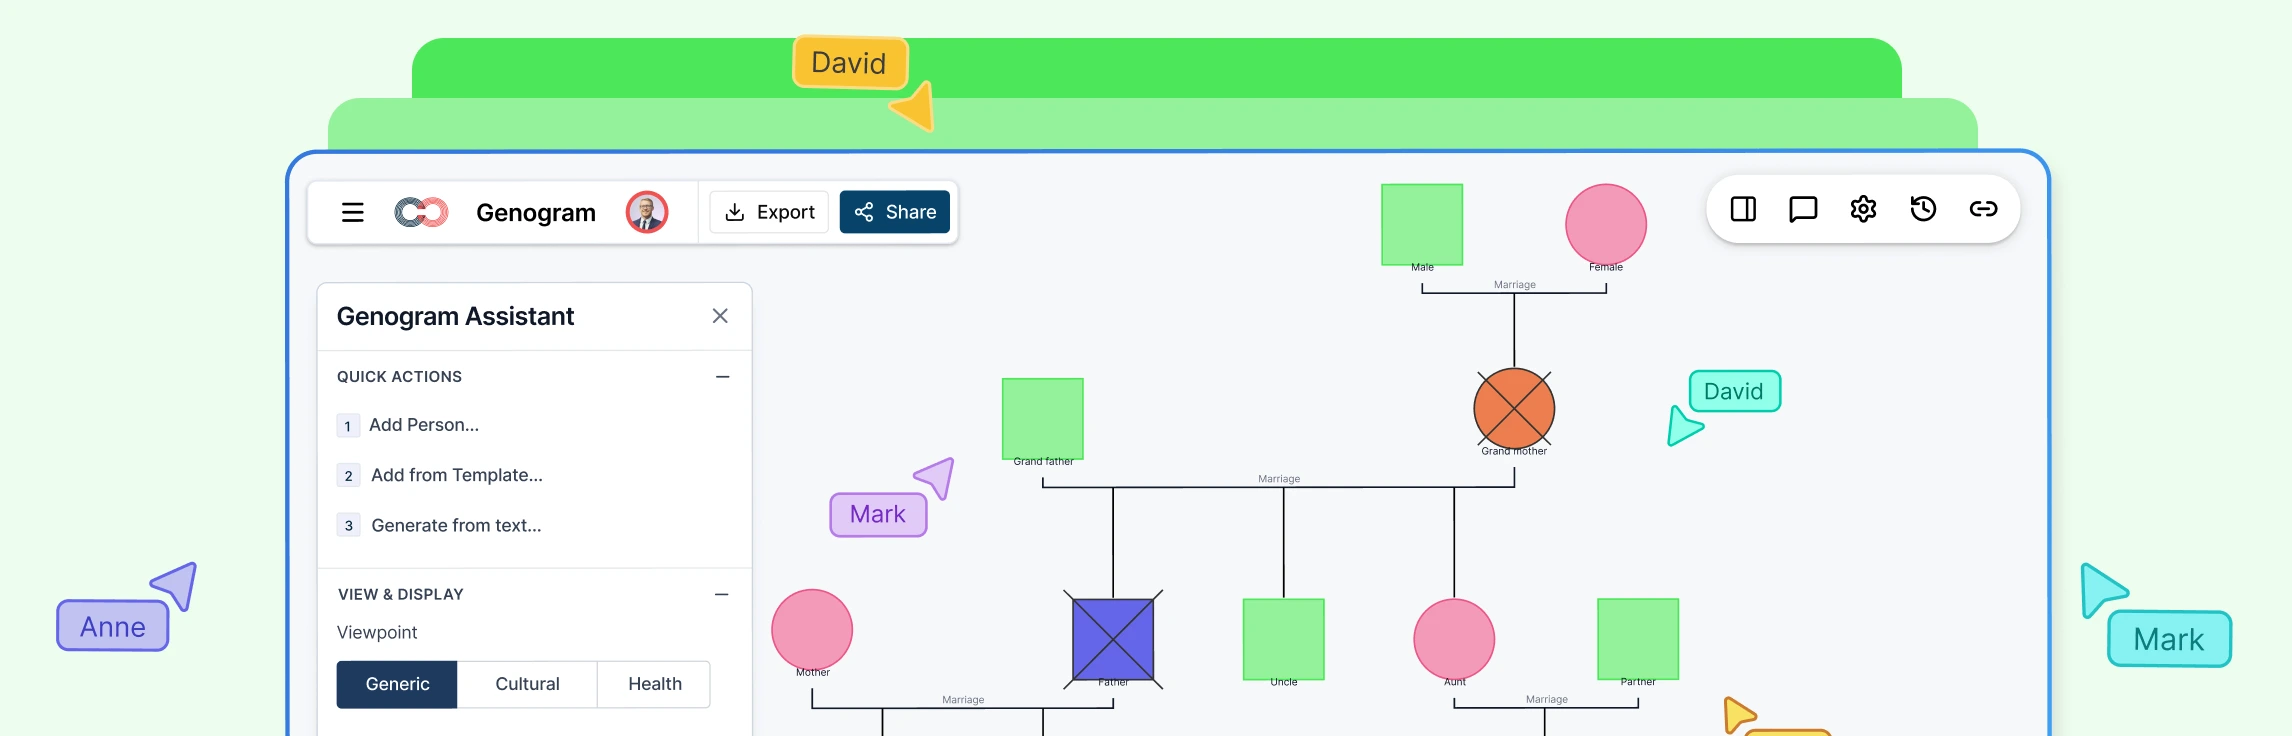
What Is a Community Genogram?
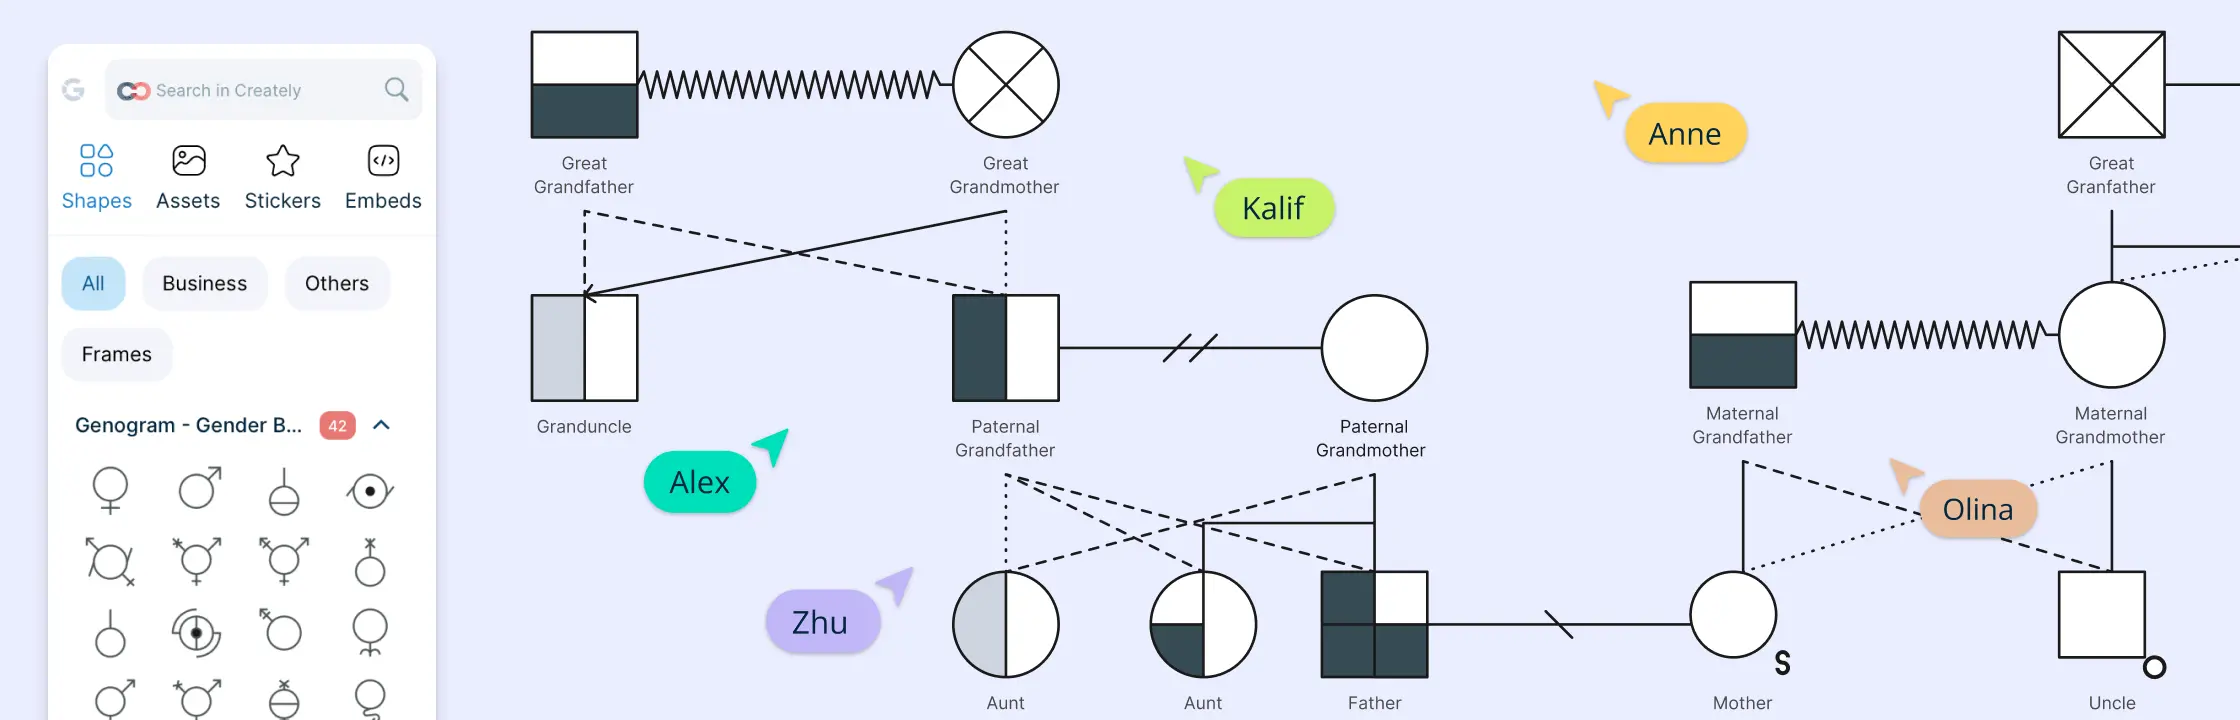
A community genogram is a visual tool that maps out the social, cultural, institutional, and interpersonal relationships within a specific community. Unlike a family-only diagram, it includes external systems as well as people, making it more useful when you need a broader planning or intervention view. It can also work as a social work genogram when the goal is to understand how family relationships connect with schools, clinics, shelters, nonprofits, and other community support.
Used frequently in social work, counseling, education, and community development, community genograms help uncover patterns of support, influence, collaboration, or tension in a shared environment. They’re especially useful for identifying community assets, social support structures, and areas of need within a population.
Common Elements Found in a Community Genogram
- Individuals and Families: Community genograms still include family units as in traditional genograms, but they also incorporate individuals who may not be part of a specific family but play significant roles within the community.
- Organizations and Institutions: This includes schools, religious institutions, healthcare facilities, businesses, non-profit organizations, social service agencies, and other community-based groups.
- Interconnections: The lines and symbols used in the genogram represent the relationships between different individuals, families, and organizations. These connections can show social ties, partnerships, collaborations, conflicts, and other interactions.
- Roles and Positions: People’s roles and positions within organizations or institutions are often indicated, helping to identify leaders, staff, volunteers, or participants.
- Community Characteristics: Additional information may be included, such as demographic data, cultural factors, economic indicators, and community assets.
These elements are easier to capture in Creately using genogram symbols for structure, relationship lines for interaction patterns, and notes or field packs for added social, medical, or service-related context.
Community Genogram vs Family Genogram vs Ecomap vs Culturagram
If you’re comparing a community genogram with other mapping tools, the main difference is scope. A community genogram maps relationships across a wider social setting, while other diagrams focus more narrowly on family structure, one household’s outside systems, or cultural context.
| Tool | What it shows | Visual cue | Best use case |
|---|---|---|---|
| Community genogram | Relationships among people, groups, institutions, and support systems in a shared setting | Multiple individuals, families, schools, agencies, and community groups connected in one network | Understanding how resources, influence, and support work across a neighborhood, school, care network, or nonprofit ecosystem |
| Family genogram | Family structure, emotional ties, and generational patterns | A family-tree style layout centered on relatives across generations | Tracing caregiving roles, health history, relationship dynamics, and inherited patterns |
| Ecomap | How one person or family connects to outside systems | One person or household in the center with lines radiating to schools, employers, services, and community contacts | Understanding one household’s external support network and service relationships |
| Culturagram | Cultural, migration, language, and identity factors that shape a family’s experience | A family or household surrounded by cultural and environmental influences | Understanding how culture affects communication, belonging, stress, and service access |
If your goal is to understand how a wider group interacts across institutions and local support systems, a community genogram is usually the best fit. If you’re comparing an ecomap vs genogram, an ecomap is better for showing how one person or family connects to outside services, while a community genogram gives a broader view of relationships across a shared setting.
For a closer look at the differences between genograms and ecomaps, see the genogram and ecomap guide, which explains what each diagram shows, how they map relationships and external systems differently, and when each one is most useful.
Community Genogram Templates for a Quick Start
Let’s explore ten community genograms, each highlighting the relationships and networks within a specific community. Each template opens in Creately’s online genogram maker, where you can customize the people, groups, institutions, and relationship lines, add notes or supporting context, and turn the example into a working community genogram for your own team, case, or project.
1. Community Health Assessment Genogram
A community health assessment genogram maps how residents, local services, and community-level supports influence health outcomes across a specific population. Instead of focusing only on care providers, it highlights broader factors such as outreach programs, schools, public health teams, and community organizations that affect prevention, access, and well-being.
This type of community genogram is useful for public health professionals, outreach coordinators, and community planners who need to identify health disparities, service gaps, referral pathways, and opportunities for preventive intervention across a community.


2. Social Work Support Network Genogram
A social work support network genogram shows the relationships surrounding an individual, family, or vulnerable group across both formal and informal support systems. It focuses on the direct network around a case, such as family members, counselors, schools, shelters, and community support.
This type of community genogram is especially useful for case managers, therapists, and social workers who need to understand trust relationships, care coordination, and immediate support gaps affecting a person or family.

For social workers and case managers who start with intake notes or referral summaries, Creately’s AI text-to-genogram can help turn written case information into a structured first draft faster before the community map is refined in detail.
3. School and Community Intervention Genogram
A school and community intervention genogram focuses on the support network around a student or small student group facing academic, behavioral, or social challenges. It maps how caregivers, teachers, counselors, after-school programs, and community services connect to support intervention planning.
This type of community genogram helps educators, counselors, and student-support teams coordinate targeted responses, identify missing links in care, and improve collaboration around student well-being and school engagement.

For social workers, school counselors, and student-support teams, these first examples are most useful when the diagram stays editable as the case develops. In Creately, you can refine relationship lines as referrals change, add notes to capture context from meetings, use comments for team review, and keep everyone aligned in a shared workspace.
4. Nonprofit Stakeholder Mapping Genogram
A nonprofit stakeholder mapping genogram visually maps the network of relationships around a nonprofit organization, including staff, volunteers, board members, donors, beneficiaries, community leaders, partner organizations, and government agencies. It helps show how influence, communication, collaboration, and support flow through the nonprofit ecosystem.
This type of community genogram is particularly valuable for nonprofit leaders, program managers, and partnership teams looking to strengthen engagement and improve coordination. It can also be used to identify key stakeholders, uncover collaboration gaps, and plan outreach strategies for fundraising, advocacy, or service delivery.

5. Family-Community Relationship Genogram
A family-community relationship genogram illustrates how a family interacts with the wider community systems that influence everyday life. It maps family members alongside schools, neighbors, healthcare providers, social services, religious groups, workplaces, and community organizations to show how family relationships connect with external sources of support, stress, and opportunity.
This type of community genogram is useful for social workers, counselors, educators, and healthcare providers who need to understand how family dynamics intersect with broader community structures. It can also be used to assess resilience factors, identify support gaps, and plan more effective family-centered interventions.

6. School Community Genogram
A school community genogram maps the relationships and roles across the wider educational environment, including students, teachers, administrators, support staff, parents, and external partners. This type of community genogram gives a broad view of how the school functions as a connected system rather than focusing on one student or intervention case.
It is useful for school leaders, educators, and administrators who want to understand communication flows, leadership structures, stakeholder relationships, and school-community partnerships across the full school setting.

When the network extends across staff, families, and external partners, Creately’s layout organization tools help keep the community genogram readable, while real-time collaboration and share options make it easier to use the same diagram across planning sessions and stakeholder reviews.
7. Religious Community Genogram
A religious community genogram offers a detailed look at the relationships, roles, and support networks within a faith-based group. It visually maps the congregation, including leaders, members, spiritual practices, and community outreach efforts. By identifying the connections between individuals and institutions within the religious setting, this genogram helps uncover the underlying social structures that shape the spiritual life of the community.
This type of community genogram is particularly valuable for faith leaders, social workers, and community organizers, as it provides insights into the emotional and social ties that strengthen unity and support the congregation’s shared beliefs and values.

8. Healthcare Community Genogram
A healthcare community genogram maps the relationships between patients, providers, care facilities, and support organizations within a healthcare network. This type of community genogram focuses on treatment coordination, referrals, and provider collaboration rather than broader community-level health assessment.
It is useful for healthcare administrators, medical social workers, and care teams who need to understand service pathways, continuity of care, and the connections that support better patient outcomes.

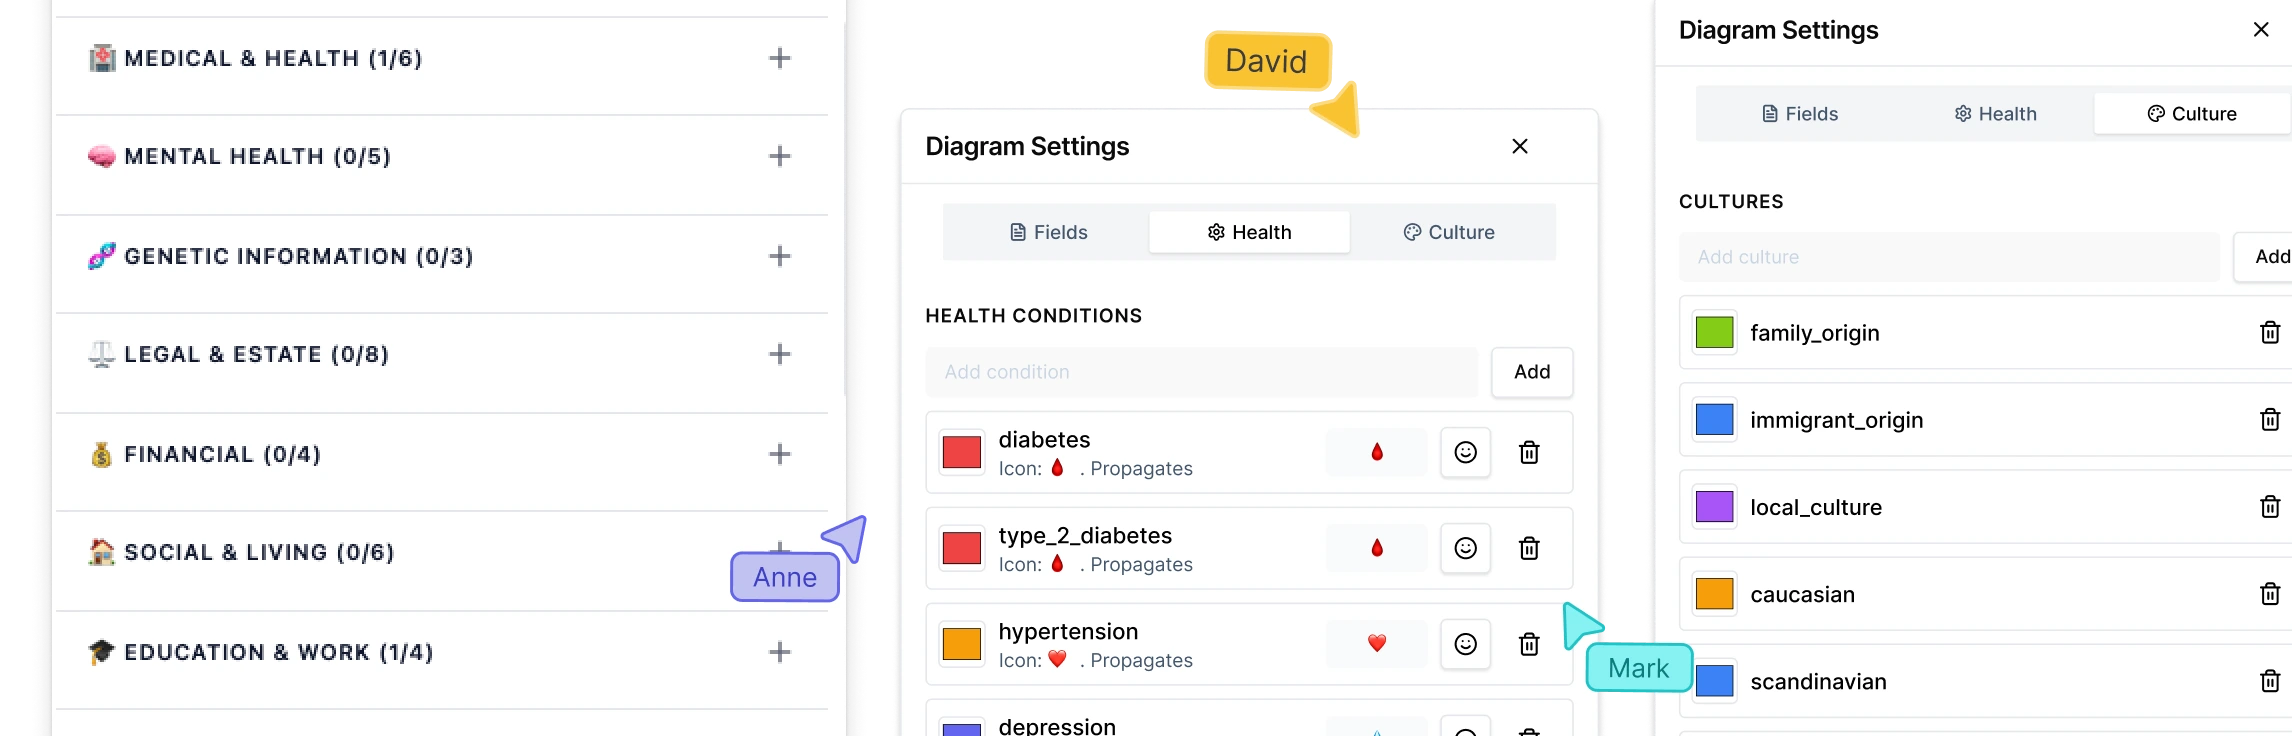
For healthcare administrators, medical social workers, and care teams, Creately can also support more detailed review workflows beyond the basic community map. If your genogram includes health-related patterns or care context, Genogram Health View Mode can help surface condition-based insights more clearly during assessment and coordination.
9. Neighborhood Community Genogram
A neighborhood community genogram illustrates the network of relationships within a specific locality or residential area, showcasing how residents, local businesses, schools, community centers, and other neighborhood institutions interact. This type of community genogram helps uncover patterns of collaboration, support systems, and social dynamics that influence the neighborhood’s overall health and cohesion.
It’s particularly useful for urban planners, social workers, and community leaders looking to foster engagement, address local challenges, or enhance neighborhood resilience through informed decision-making.

If your community genogram also needs to reflect cultural identity, migration background, or shared heritage across a neighborhood or community group, Creately’s culture views can help highlight those patterns more clearly alongside the broader relationship map.
10. Social Services Community Genogram
A social services community genogram maps how agencies, programs, outreach services, and public resources connect to support vulnerable populations. Unlike a more case-focused social work genogram, this type of community genogram highlights the wider service ecosystem and how organizations work together across a community.
It is useful for service coordinators, policymakers, and community organizers who need to identify access barriers, collaboration gaps, and opportunities to strengthen service delivery across multiple agencies.

For service coordinators and care teams, Creately is also useful when a community genogram needs to support formal documentation. Once the diagram is updated with field packs and notes, it can be prepared as a PDF/DOCX report that includes the genogram, structured profiles, and supporting context for case review, recordkeeping, or team documentation.
Helpful Resources
Discover everything you need to know about genograms, from what they are, their components, and how they are used.
Learn how different types of genograms can help visualize important aspects of life.
Explore the essential symbols used in genograms to represent everything from basic family structures to complex emotional and medical relationships.
Ready to Visualize Your Community?
Community genograms help visualize how families, organizations, professionals, and local systems influence one another within a shared setting. They are useful for community health assessment, school intervention, nonprofit planning, neighborhood analysis, and social work. Use these community genogram examples and templates to map support systems, identify gaps, and create a community genogram that fits your specific context.
If you are ready to build your own community genogram, use Creately’s editable genogram templates to customize examples with relationship lines, notes, and shared team input, then turn them into working diagrams your team can review, update, and share as the situation evolves.
FAQs About Community Genograms
What is the purpose of a community genogram?
How is a community genogram different from a family genogram?
Can community genograms help with community development projects?
When should I use a community genogram instead of another genogram example?
Can I use a community genogram template for social work or school planning?
What Creately features are useful for community genograms?
Resources
Butler, J.F. (2008). The Family Diagram and Genogram: Comparisons and Contrasts. The American Journal of Family Therapy, 36(3), pp.169–180. doi:https://doi.org/10.1080/01926180701291055.
Rempel, G.R., Neufeld, A. and Kushner, K.E. (2007). Interactive Use of Genograms and Ecomaps in Family Caregiving Research. Journal of Family Nursing, 13(4), pp.403–419. doi:https://doi.org/10.1177/1074840707307917.