In the realm of business strategy, making informed decisions is key for success. Strategic management provides a framework for guiding these decisions, making sure that resources are allocated effectively and goals are achieved. One of the fundamental tools in strategic management is the BCG Matrix, a simple yet powerful model for analyzing and managing a company’s portfolio of products or services. In this guide, we will look at the role of the BCG matrix in strategic management and how to effectively use it for portfolio analysis and decision making.
Understanding the BCG Matrix Framework in Strategic Management
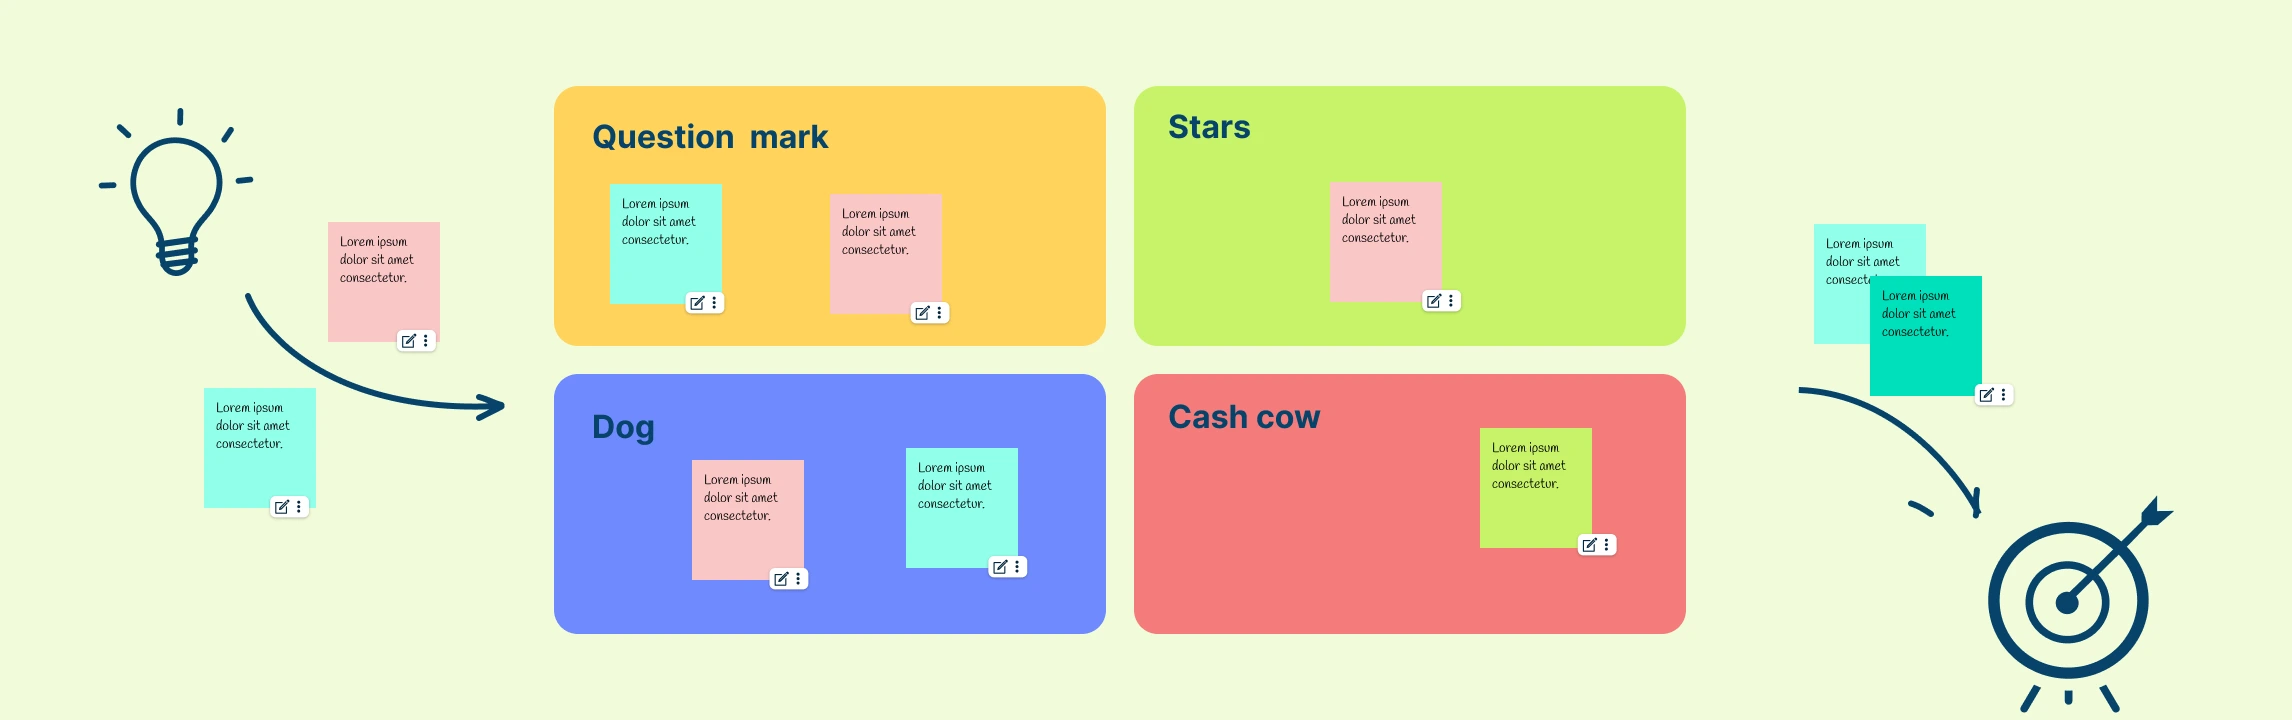
The BCG Matrix categorizes a company’s products or services into four quadrants based on two dimensions: market growth rate and relative market share. These quadrants are Stars, Question Marks, Cash Cows, and Dogs. Each quadrant represents a different strategic implication for the product or service it contains, guiding decisions on resource allocation and growth strategies.
To learn more about what is the BCG matrix and how to use it, refer to our guide What is BCG Matrix: A Comprehensive Guide with Templates.
Explore more BCG matrix examples.
Steps for Implementing the BCG Matrix in Strategic Management
Implementing the BCG Matrix in strategic management involves several steps, each of which is crucial for effectively analyzing your business’s portfolio and making informed decisions. Let’s break down these steps:
Step 1: Data Collection and Analysis
To begin implementing the BCG Matrix in strategic management, the first step is gathering relevant data and conducting thorough analysis. This involves collecting information on two key metrics for each product or service in your portfolio:
- Market growth rate: This metric reflects the rate at which the overall market for a particular product or service is growing. It helps determine the attractiveness of the market in which a product operates.
- Relative market share: This metric compares a product’s market share to that of its competitors. It indicates the product’s strength and competitiveness within its market segment.
Gathering data for these metrics may involve market research, sales data analysis, and competitor benchmarking. Once collected, the data should be carefully analyzed to ensure accuracy and reliability.
Step 2: Plotting on the matrix
With the data collected and analyzed, the next step is to plot each product or service on the BCG Matrix. The matrix consists of four quadrants, each representing a different combination of market growth rate and relative market share:


Stars: Products with high market share in high-growth markets. These products typically require significant investment to maintain their growth trajectory.
Question Marks (or Problem Children): Products with low market share in high-growth markets. These products have potential for growth but require careful investment and strategic management.
Cash Cows: Products with high market share in low-growth markets. These products generate significant cash flow and profits and typically require minimal investment.
Dogs: Products with low market share in low-growth markets. These products may not generate significant profits and may require reevaluation or divestment.
Each product or service in your portfolio should be placed in one of these quadrants based on its market growth rate and relative market share.
Step 3: Analyzing results and formulating strategies
Once products or services are plotted on the matrix, the final step is to analyze the results and formulate strategies accordingly. This involves understanding the strategic implications of each quadrant and determining appropriate actions:
Stars: For products in this quadrant, the focus should be on investing resources to maintain and further grow market share. Strategies may include product innovation, marketing campaigns, and expansion into new markets.
Question Marks: Products in this quadrant require careful consideration and strategic investment. Depending on the potential for growth and market dynamics, strategies may include market development, product differentiation, or strategic partnerships.
Cash Cows: These products are typically mature and stable, generating consistent cash flow. Strategies may focus on maximizing profitability through cost management, pricing optimization, and efficient resource allocation.
Dogs: Products in this quadrant may require reevaluation or divestment, especially if they are not contributing to the overall profitability of the portfolio. Strategies may include product rationalization, divestment, or strategic alliances.
By analyzing the results of the BCG Matrix and formulating appropriate strategies, organizations can optimize their portfolio management and make informed decisions to drive sustainable growth and profitability.

Implementing the BCG Matrix in strategic management requires careful consideration of market dynamics, competitive positioning, and strategic priorities. By following these steps and leveraging the insights provided by the matrix, organizations can effectively manage their portfolio of products and services to achieve their strategic objectives.
Tips for Effectively Using the BCG Matrix in Strategic Management
Here are effective tips for leveraging the BCG Matrix to drive strategic insights, optimize resource allocation, and position your business for sustainable growth and success.
Regularly update your data
Market conditions and product performance can change rapidly. To ensure the accuracy and relevance of your BCG Matrix, make it a priority to update your data regularly. This includes monitoring market growth rates, assessing relative market shares, and tracking changes in your product portfolio.
Ensure accurate positioning
The accuracy of your BCG Matrix hinges on the precise positioning of your products/services within the four quadrants. Take the time to gather reliable data and thoroughly analyze each product/service before plotting it on the matrix. Avoid making assumptions and rely on empirical evidence whenever possible.
Consider external factors
While the BCG Matrix provides valuable insights into internal factors such as market growth rate and relative market share, it’s essential to consider external factors that may impact your business and its portfolio. This includes economic conditions, industry trends, regulatory changes, and competitive dynamics. Integrating these external factors into your analysis will provide a more comprehensive view of your strategic landscape.
Integrate with other strategic tools
The BCG Matrix is just one tool in your strategic management toolkit. To gain a holistic understanding of your business and its strategic options, consider integrating the BCG Matrix with other tools and models, such as SWOT analysis, PESTEL analysis, and Porter’s Five Forces. Each tool offers unique perspectives that can complement and enrich your strategic decision-making process.
Prioritize actionable insights
The primary purpose of the BCG Matrix is to identify strategic priorities and guide resource allocation decisions. Focus on actionable insights that will drive tangible outcomes for your business. Prioritize investments in products/services with high growth potential (Stars and Question Marks) while optimizing profitability in established offerings (Cash Cows) and rationalizing underperforming ones (Dogs).
Involve key stakeholders
Strategic decision-making is a collaborative effort that involves input from various stakeholders across your organization. Engage key stakeholders, including senior management, product managers, marketing teams, and finance professionals, in the BCG Matrix process. This will ensure alignment, foster buy-in, and enrich the quality of your strategic decisions.
Monitor and adapt
Markets are dynamic, and strategic landscapes evolve over time. Continuously monitor the performance of your products/services and reassess their positioning on the BCG Matrix. Be prepared to adapt your strategies and reallocate resources as needed to capitalize on emerging opportunities and mitigate potential risks.
BCG Matrix vs Ansoff Matrix in Strategic Management
While both the BCG Matrix and the Ansoff Growth Matrix are valuable tools in strategic management, they serve different purposes and focus on different aspects of strategic decision-making. The BCG Matrix is primarily used for portfolio analysis and resource allocation, while the Ansoff Growth Matrix is focused on growth strategies and market expansion. Depending on the company’s objectives and context, both tools can provide valuable insights for informed decision-making in strategic management.
Purpose and focus
- BCG Matrix: Helps companies decide where to invest resources among their existing products.
- Ansoff Growth Matrix: Helps companies decide how to grow, whether by selling more of what they have, selling to new customers, selling new products, or entering new markets.
Analysis approach
- BCG Matrix: Sorts products into groups based on how much they’re growing and how much they’re selling.
- Ansoff Growth Matrix: Helps decide if a company should sell more to current customers, find new customers, sell new products, or try something completely new.
Time horizon
- BCG Matrix: Helps with short to medium-term decisions.
- Ansoff Growth Matrix: Thinks about the long-term future of a company.
Application
- BCG Matrix: Best for big companies with lots of products, helping them decide where to invest and where to pull back.
- Ansoff Growth Matrix: Useful for any company wanting to grow, helping them understand how to do it, whether by selling more of the same products, finding new customers, making new products, or trying something new altogether.
Understanding the BCG Matrix Positions Throughout the Product Lifecycle
By analyzing the product lifecycle of each product in the portfolio and aligning them with their appropriate positions on the BCG matrix, companies can develop targeted strategies for resource allocation, investment prioritization, and portfolio optimization. This approach enables companies to maximize the value of their product portfolio and drive sustainable growth in competitive markets.
Introduction stage
- At the beginning of their lifecycle, products are introduced into the market. Sales are typically low as consumers become aware of the product and its features.
- In the BCG Matrix, products in the introduction stage are often categorized as Question Marks or Stars.
- Question Marks: These products have low market share but high growth potential, indicating they are in the early stages of market penetration.
- Stars: Some products may quickly gain market share and exhibit high growth rates, positioning them as stars in the BCG Matrix.
Growth stage
- As products gain acceptance and popularity, they enter the growth stage. Sales begin to increase rapidly as consumer demand grows.
- Products in the growth stage are typically classified as Stars in the BCG Matrix.
- Stars represent products with high growth potential and significant market share, reflecting their success in capturing a growing market segment.
Maturity stage
- After reaching peak sales levels, products enter the maturity stage. Market saturation becomes apparent, and competition intensifies.
- In the BCG Matrix, products in the maturity stage are usually classified as Cash Cows.
- Cash Cows have high market share but low growth rates, indicating their position as established and profitable products.
Decline stage
- Eventually, products reach the decline stage as sales begin to decline due to changing consumer preferences or technological advancements.
- Products in the decline stage are typically classified as Dogs in the BCG Matrix.
- Dogs represent products with low market share and low growth rates, signaling the need for strategic decisions regarding their future viability.
The BCG Matrix is a valuable tool in the strategic management toolkit, providing a structured approach to portfolio analysis and decision-making. By understanding its framework, implementing it effectively, and recognizing its strengths and limitations, businesses can make more informed strategic choices and drive sustainable growth.