Venn Diagram
Create Venn Diagrams with Ease
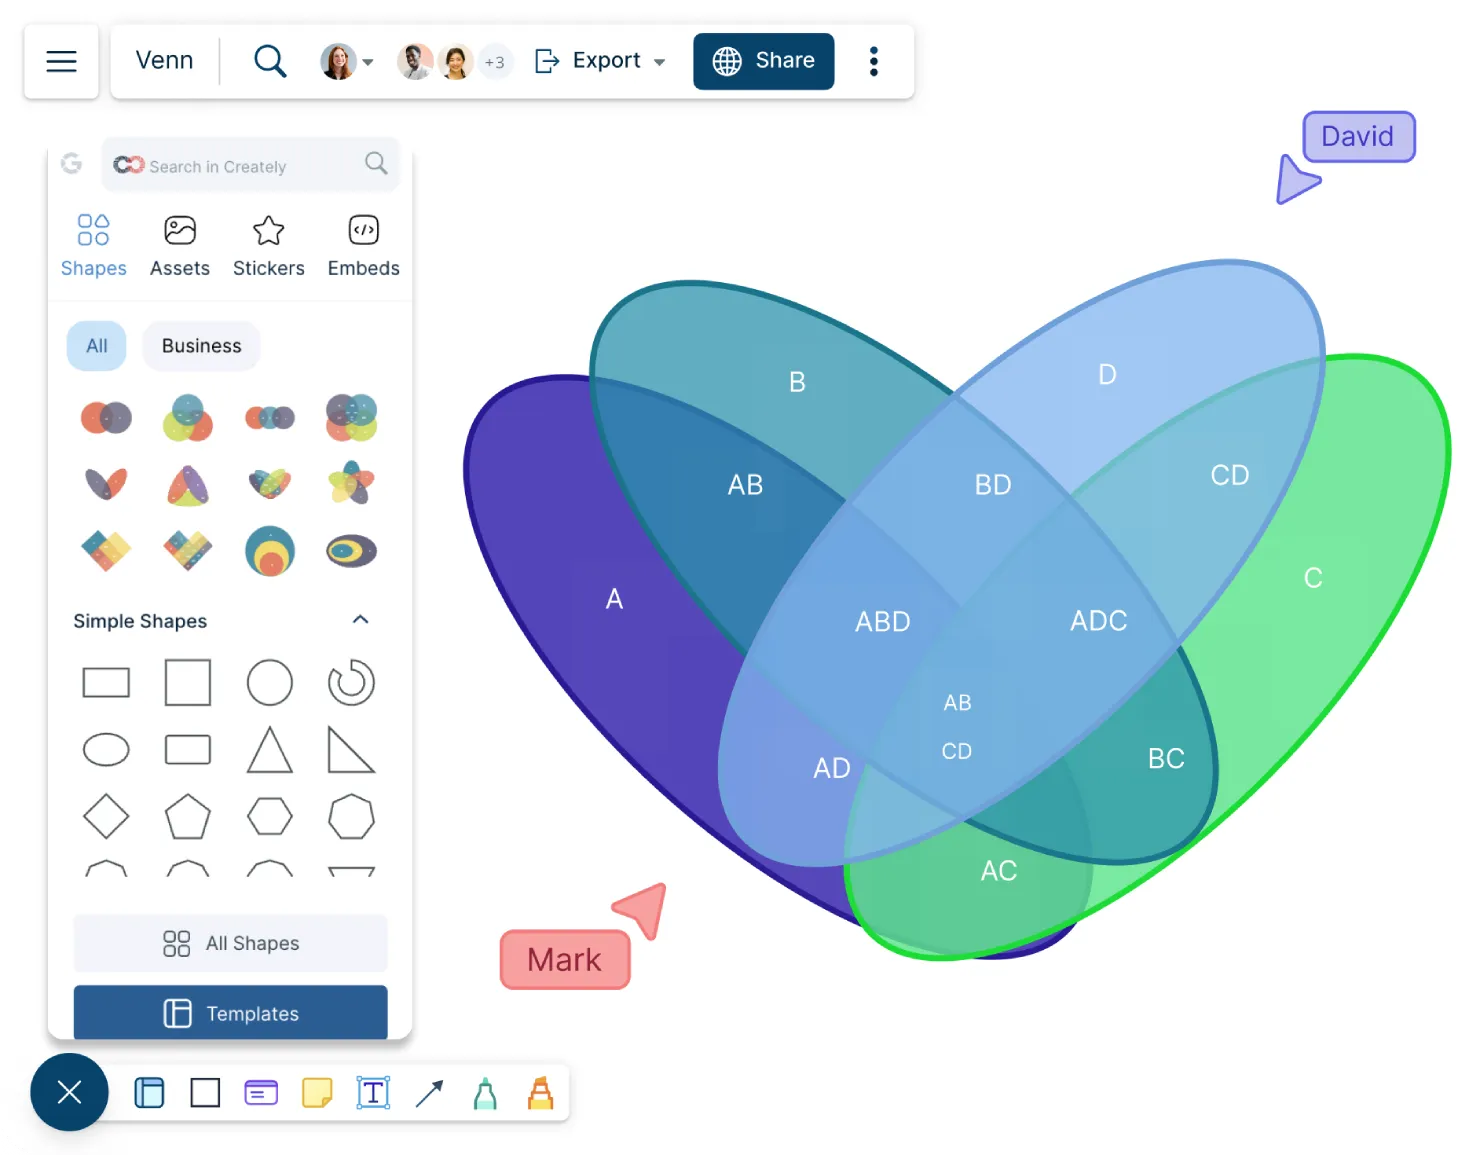
- Simple drag and drop interface and automatic drawing to create visually stunning Venn diagrams
- 1000s of custom-built Venn diagram templates and professional color themes to start quickly
- Export in multiple formats and create presentations with ease
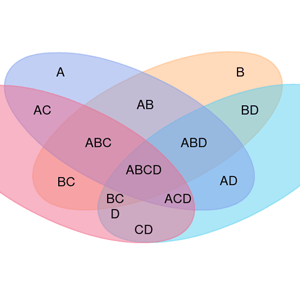
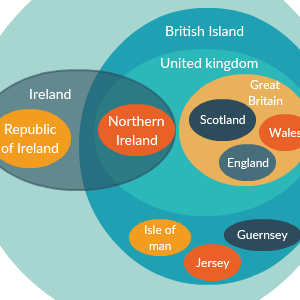
Venn Templates


What Is a Venn Diagram?
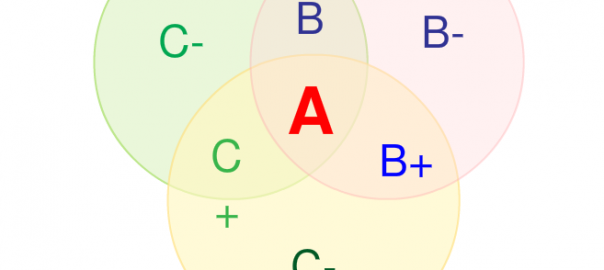
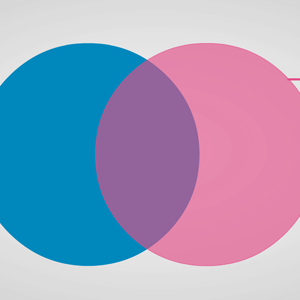
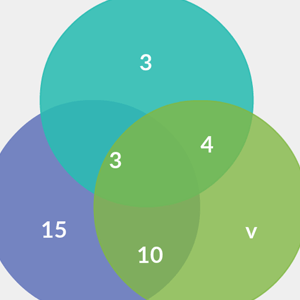
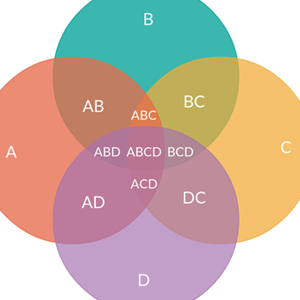
Venn diagrams are made up of two or more overlapping circles. They are often used to show relationships between sets. Circles that overlap have a commonality while circles that do not overlap do not share those traits.
Venn diagrams are helpful in organizing information and presenting it in an easy-to-understand manner.
How to Create a Venn Diagram?
- The first step to creating a Venn diagram is identifying what you would like to compare.
- Now begin by visualizing the relationship these two or more items have with each other. You can get started by using a Venn diagram template or starting with a blank canvas and adding shapes as you go.
- Add a circle for each item you want to compare.
- The section where two circles overlap represents the areas of commonality between the two items. For ease of reference- make sure to color code this section in a different color.
- The section where the circles do not overlap represents the points of difference between the items you have chosen to compare.