Planogram Maker
Figure Out the Optimal Way to Display Your Products
Design product placement and take clear actions that maximize sales with customizable planograms that show exactly how your retail store should be set up.
- Ready-made planogram templates to get started instantly
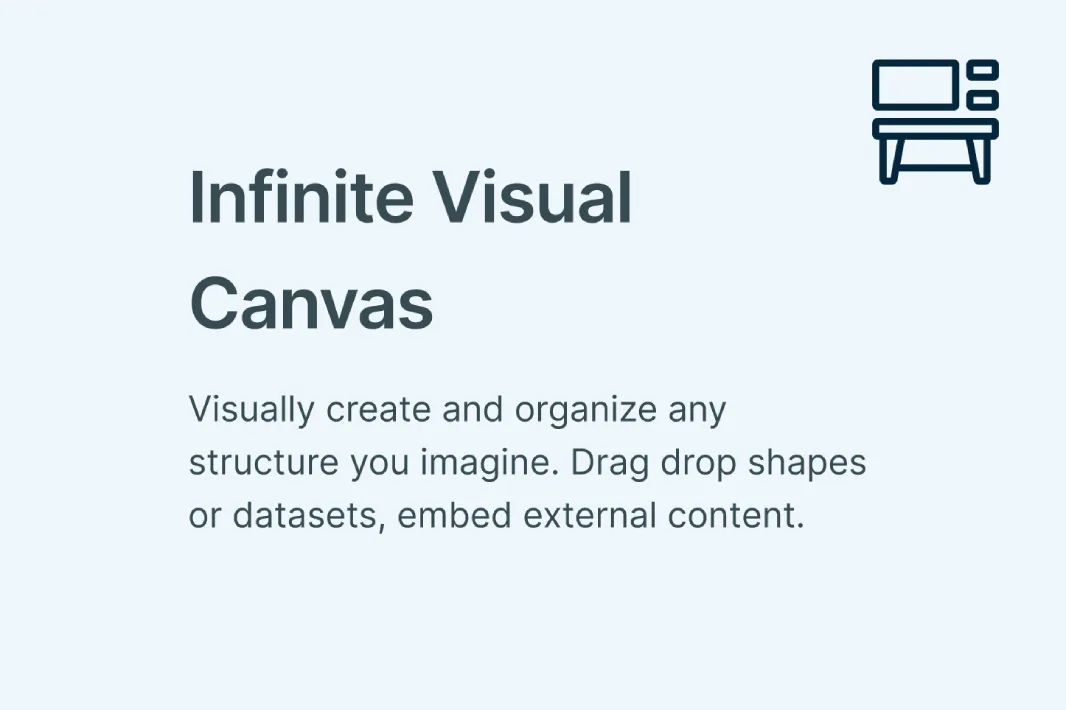
- A free form canvas to drag and drop anything and visualize fast
- Export your planograms in JPEG, PNG, PDF and SVG formats
Over 10 Million people and 1000s of teams already use Creately
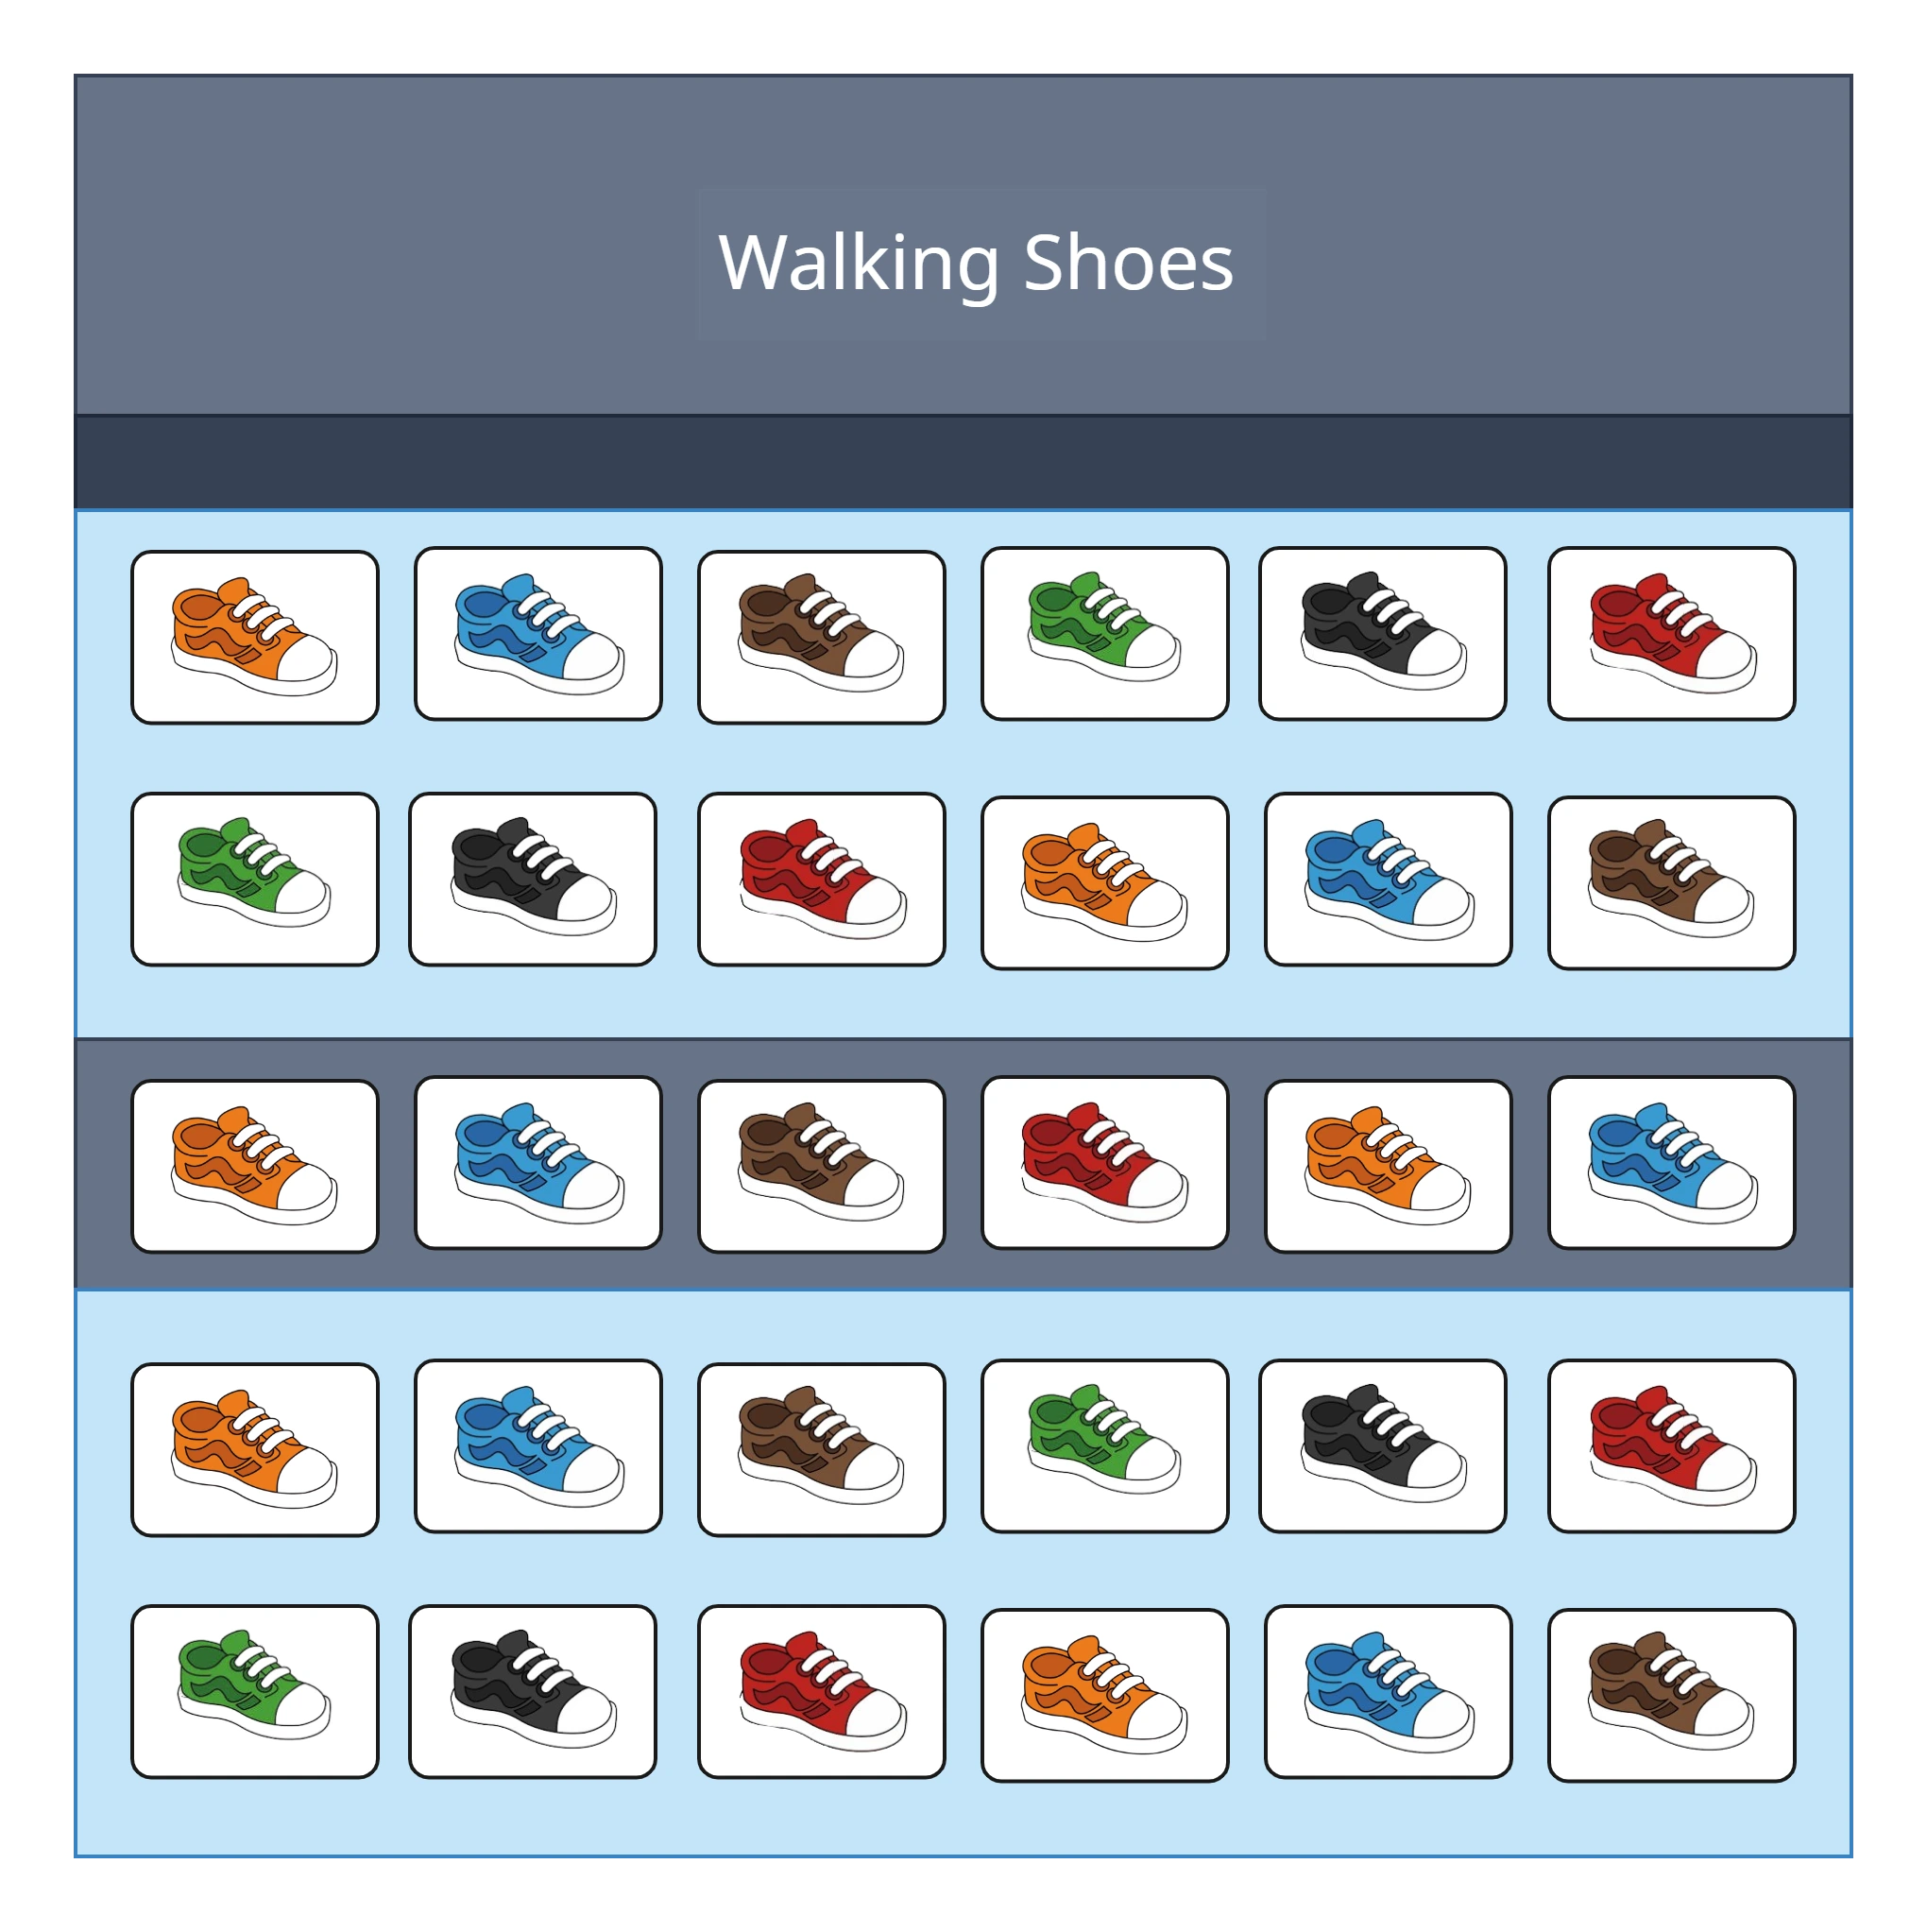
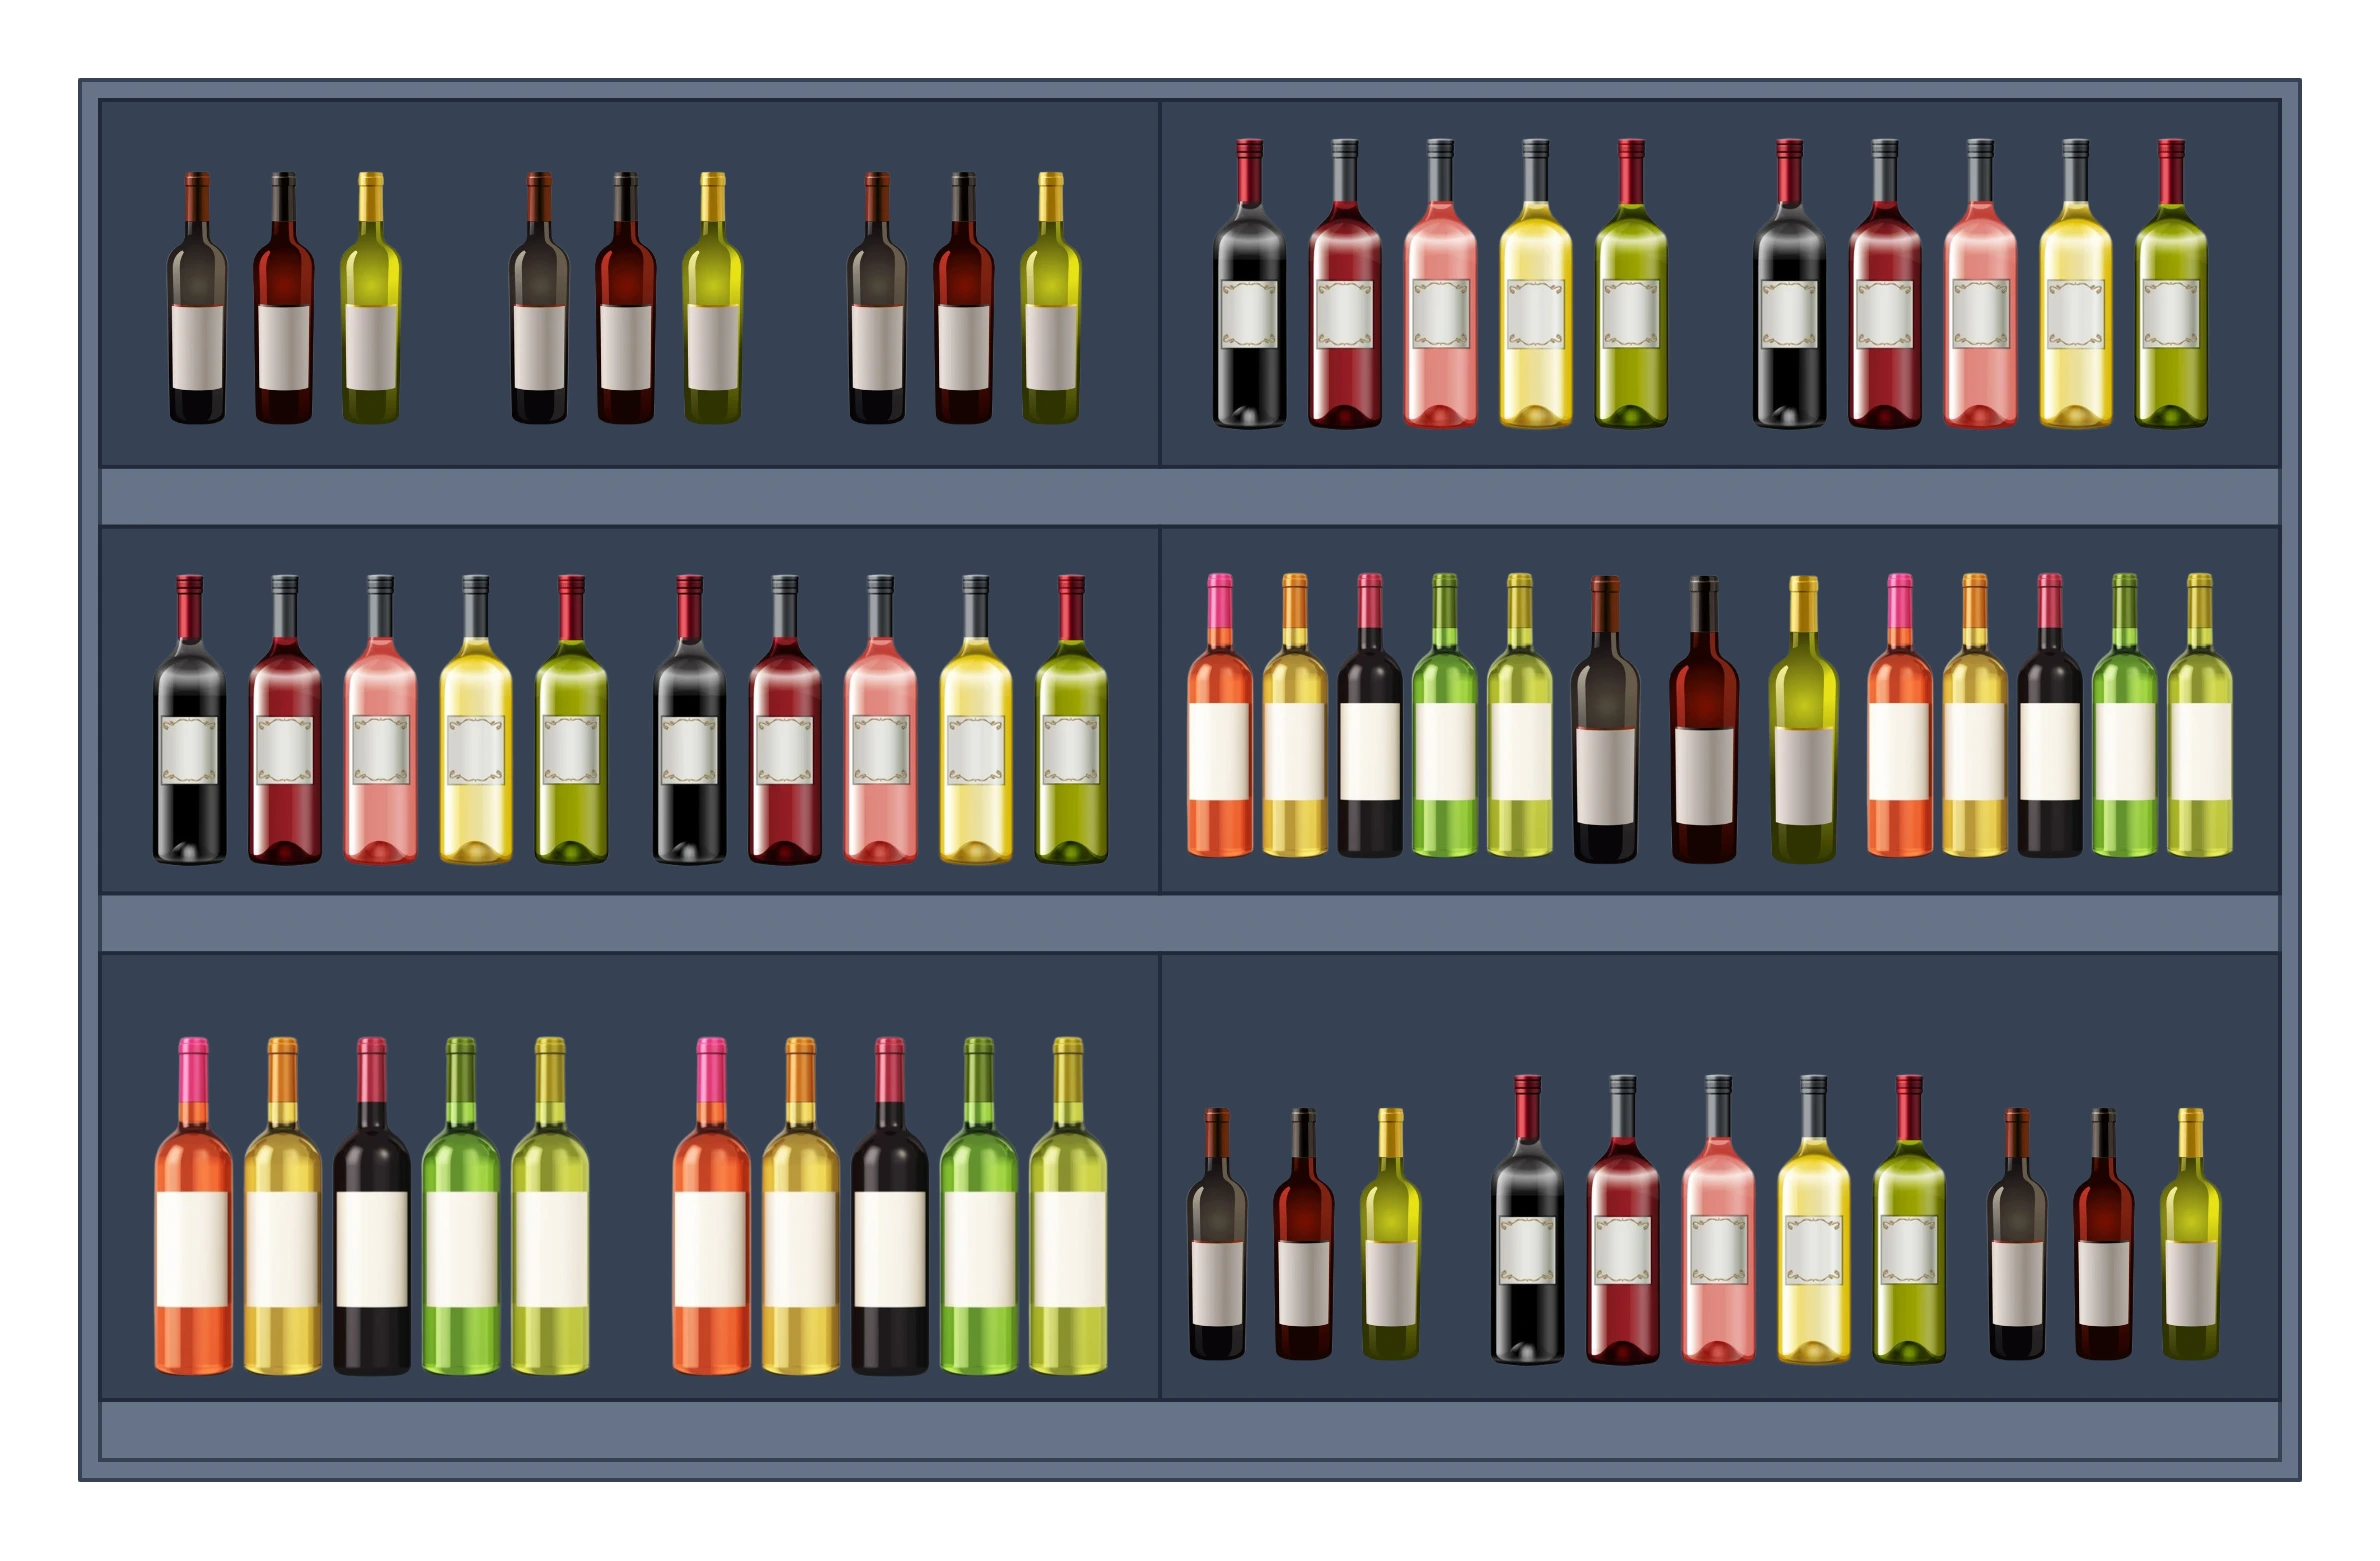
Free Planogram Templates to Customize for Your Store Layout
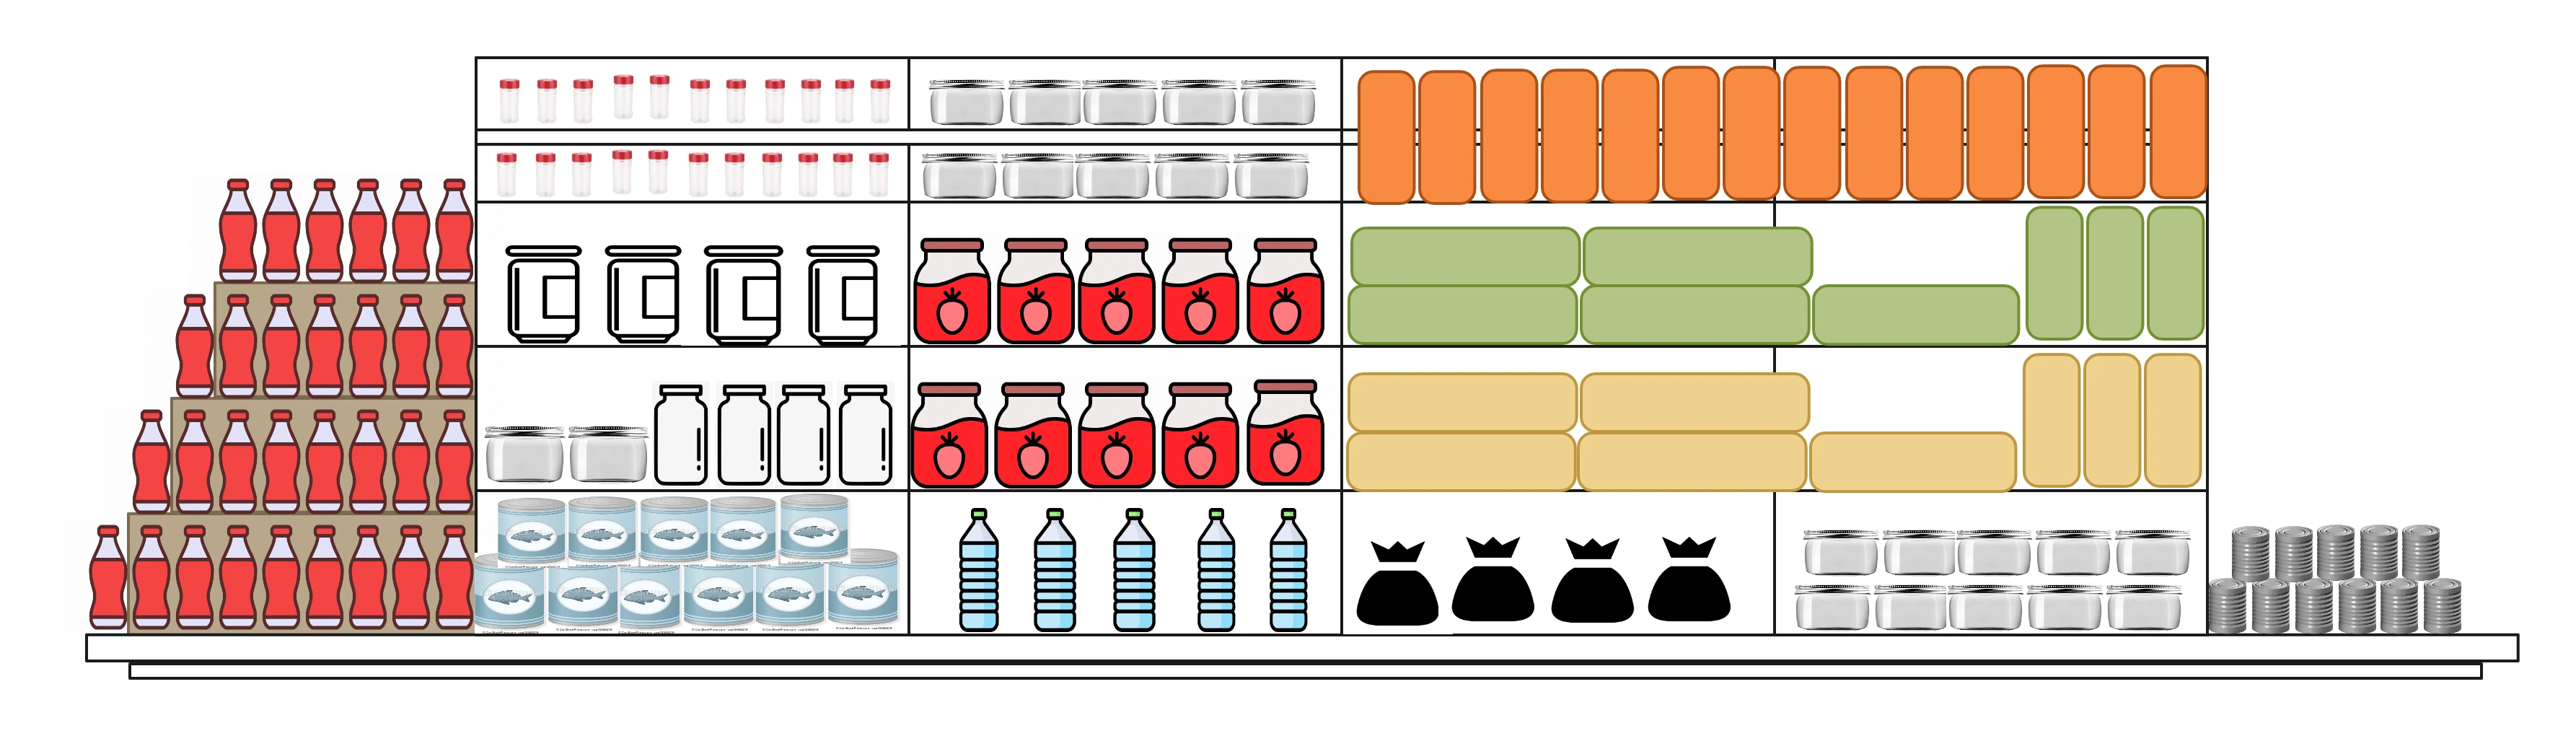

Determine Which Product Goes Where
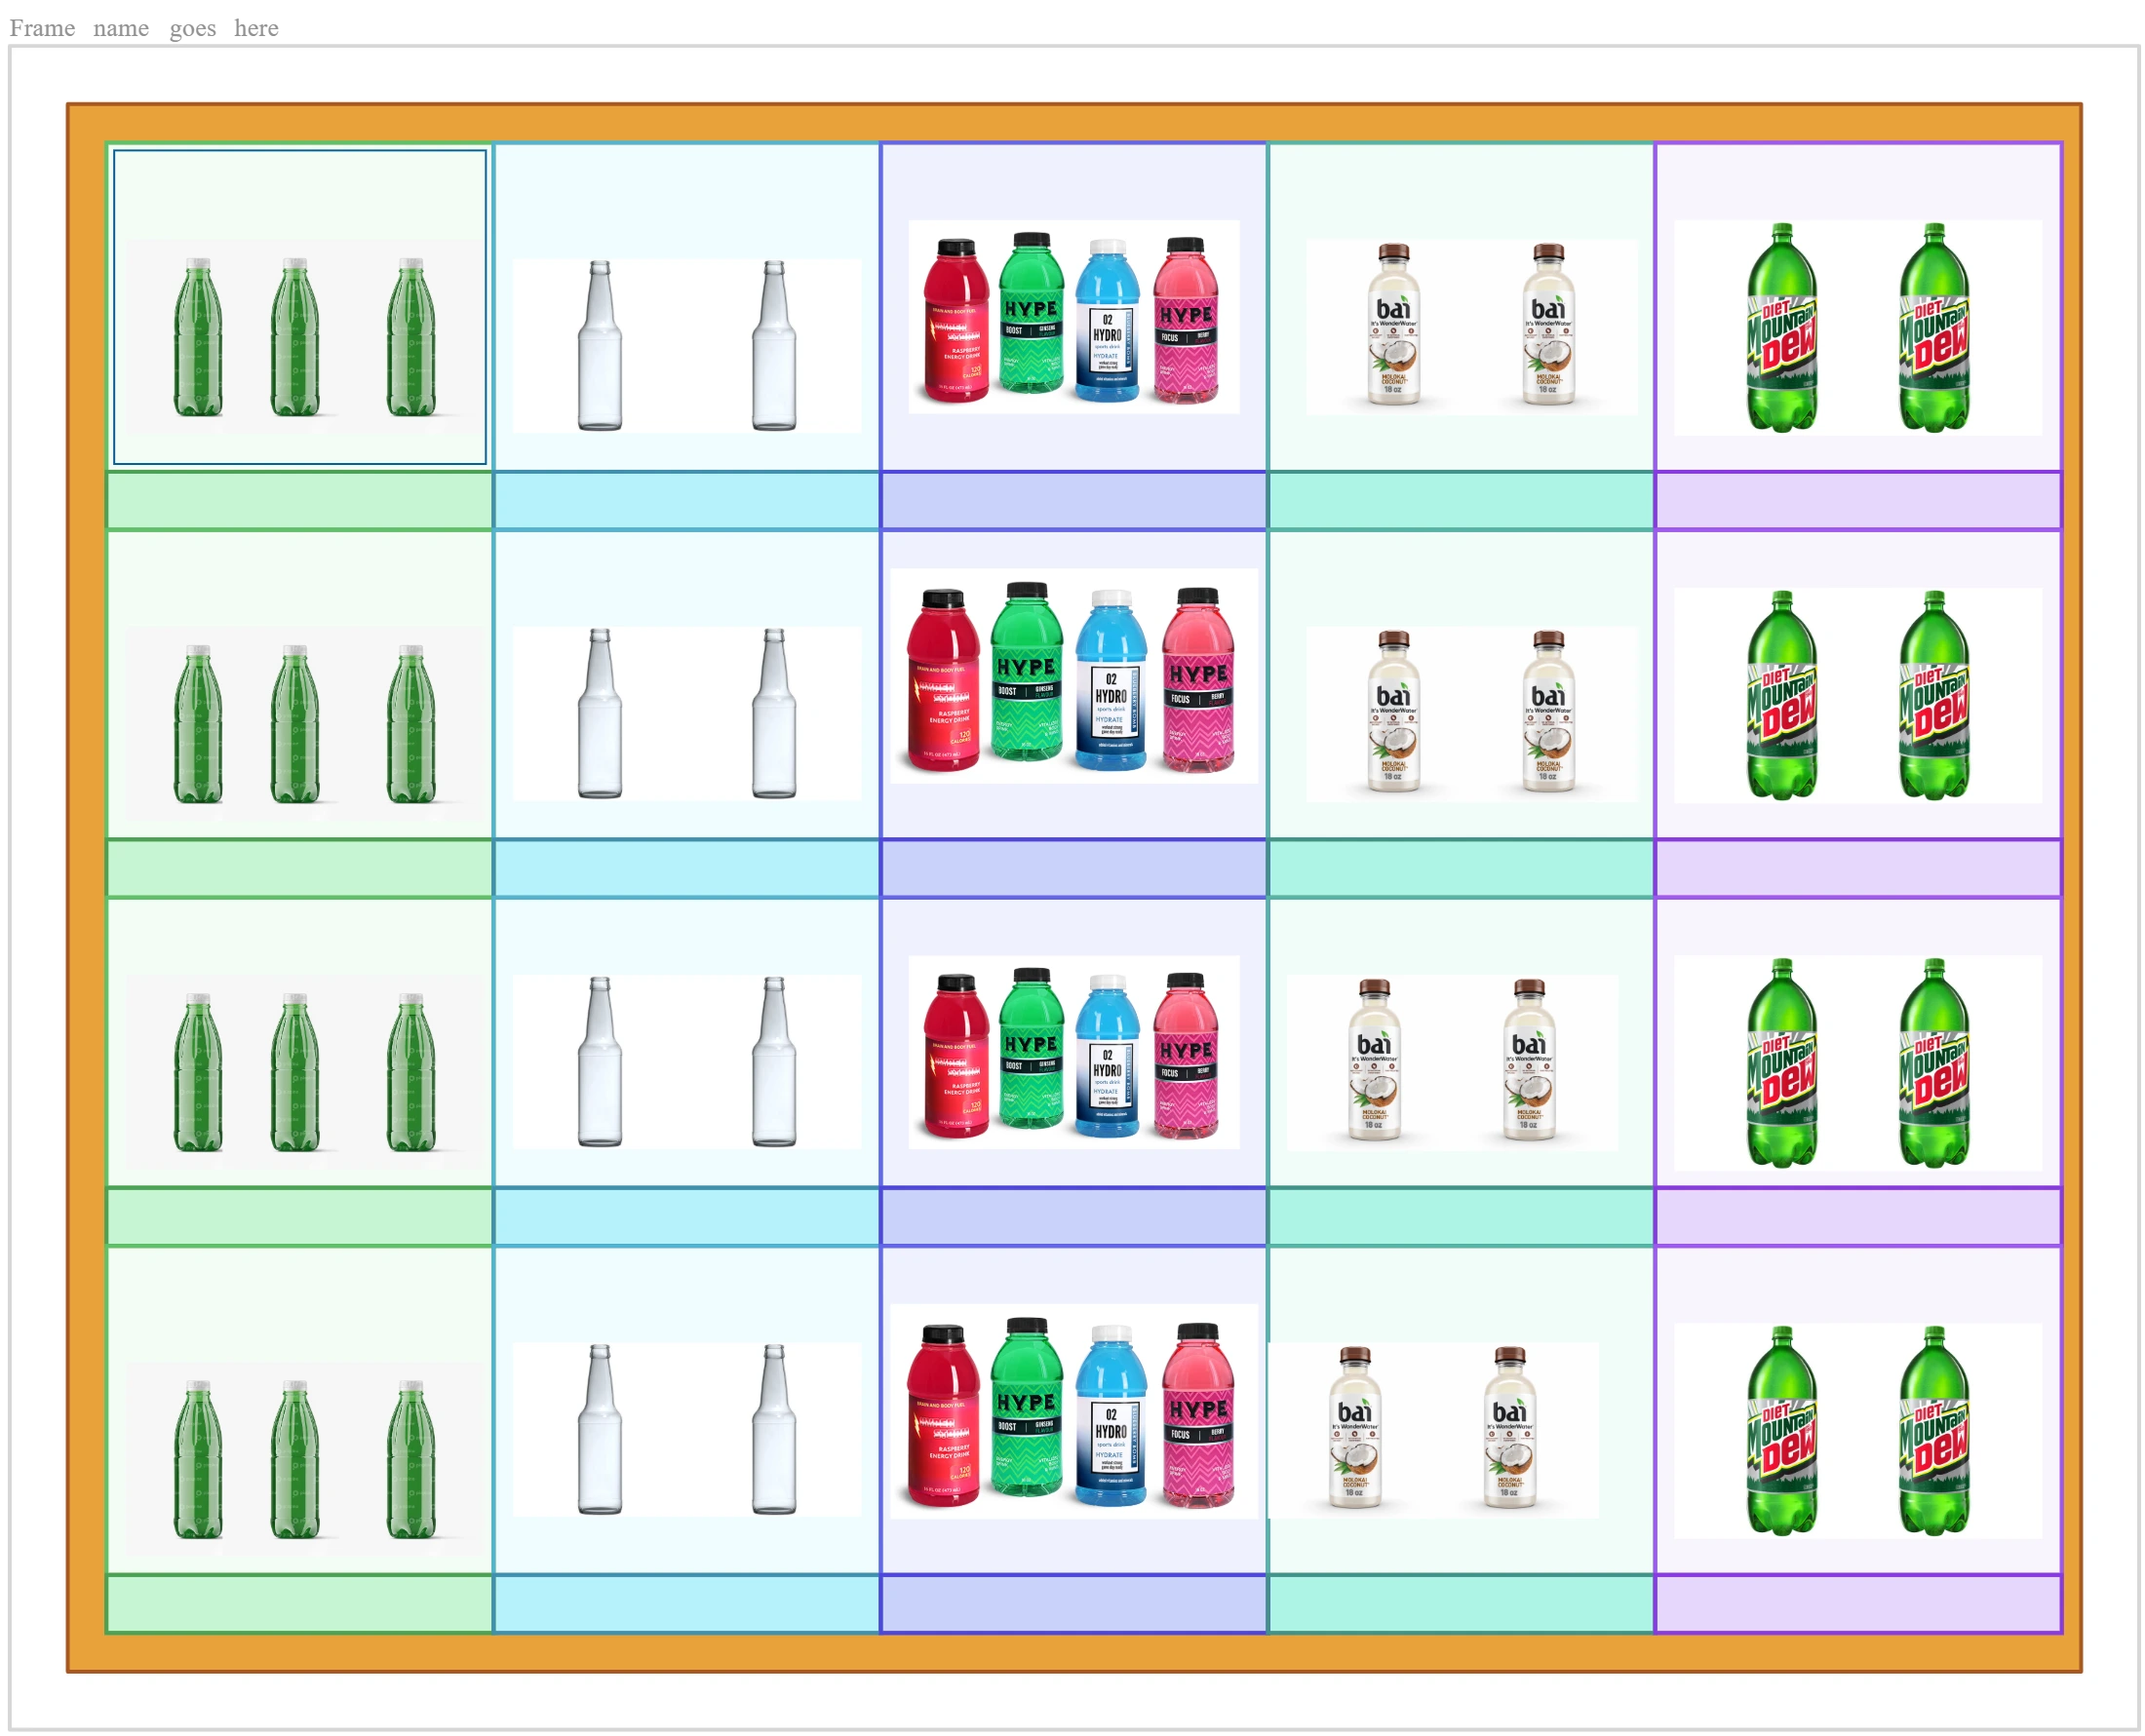
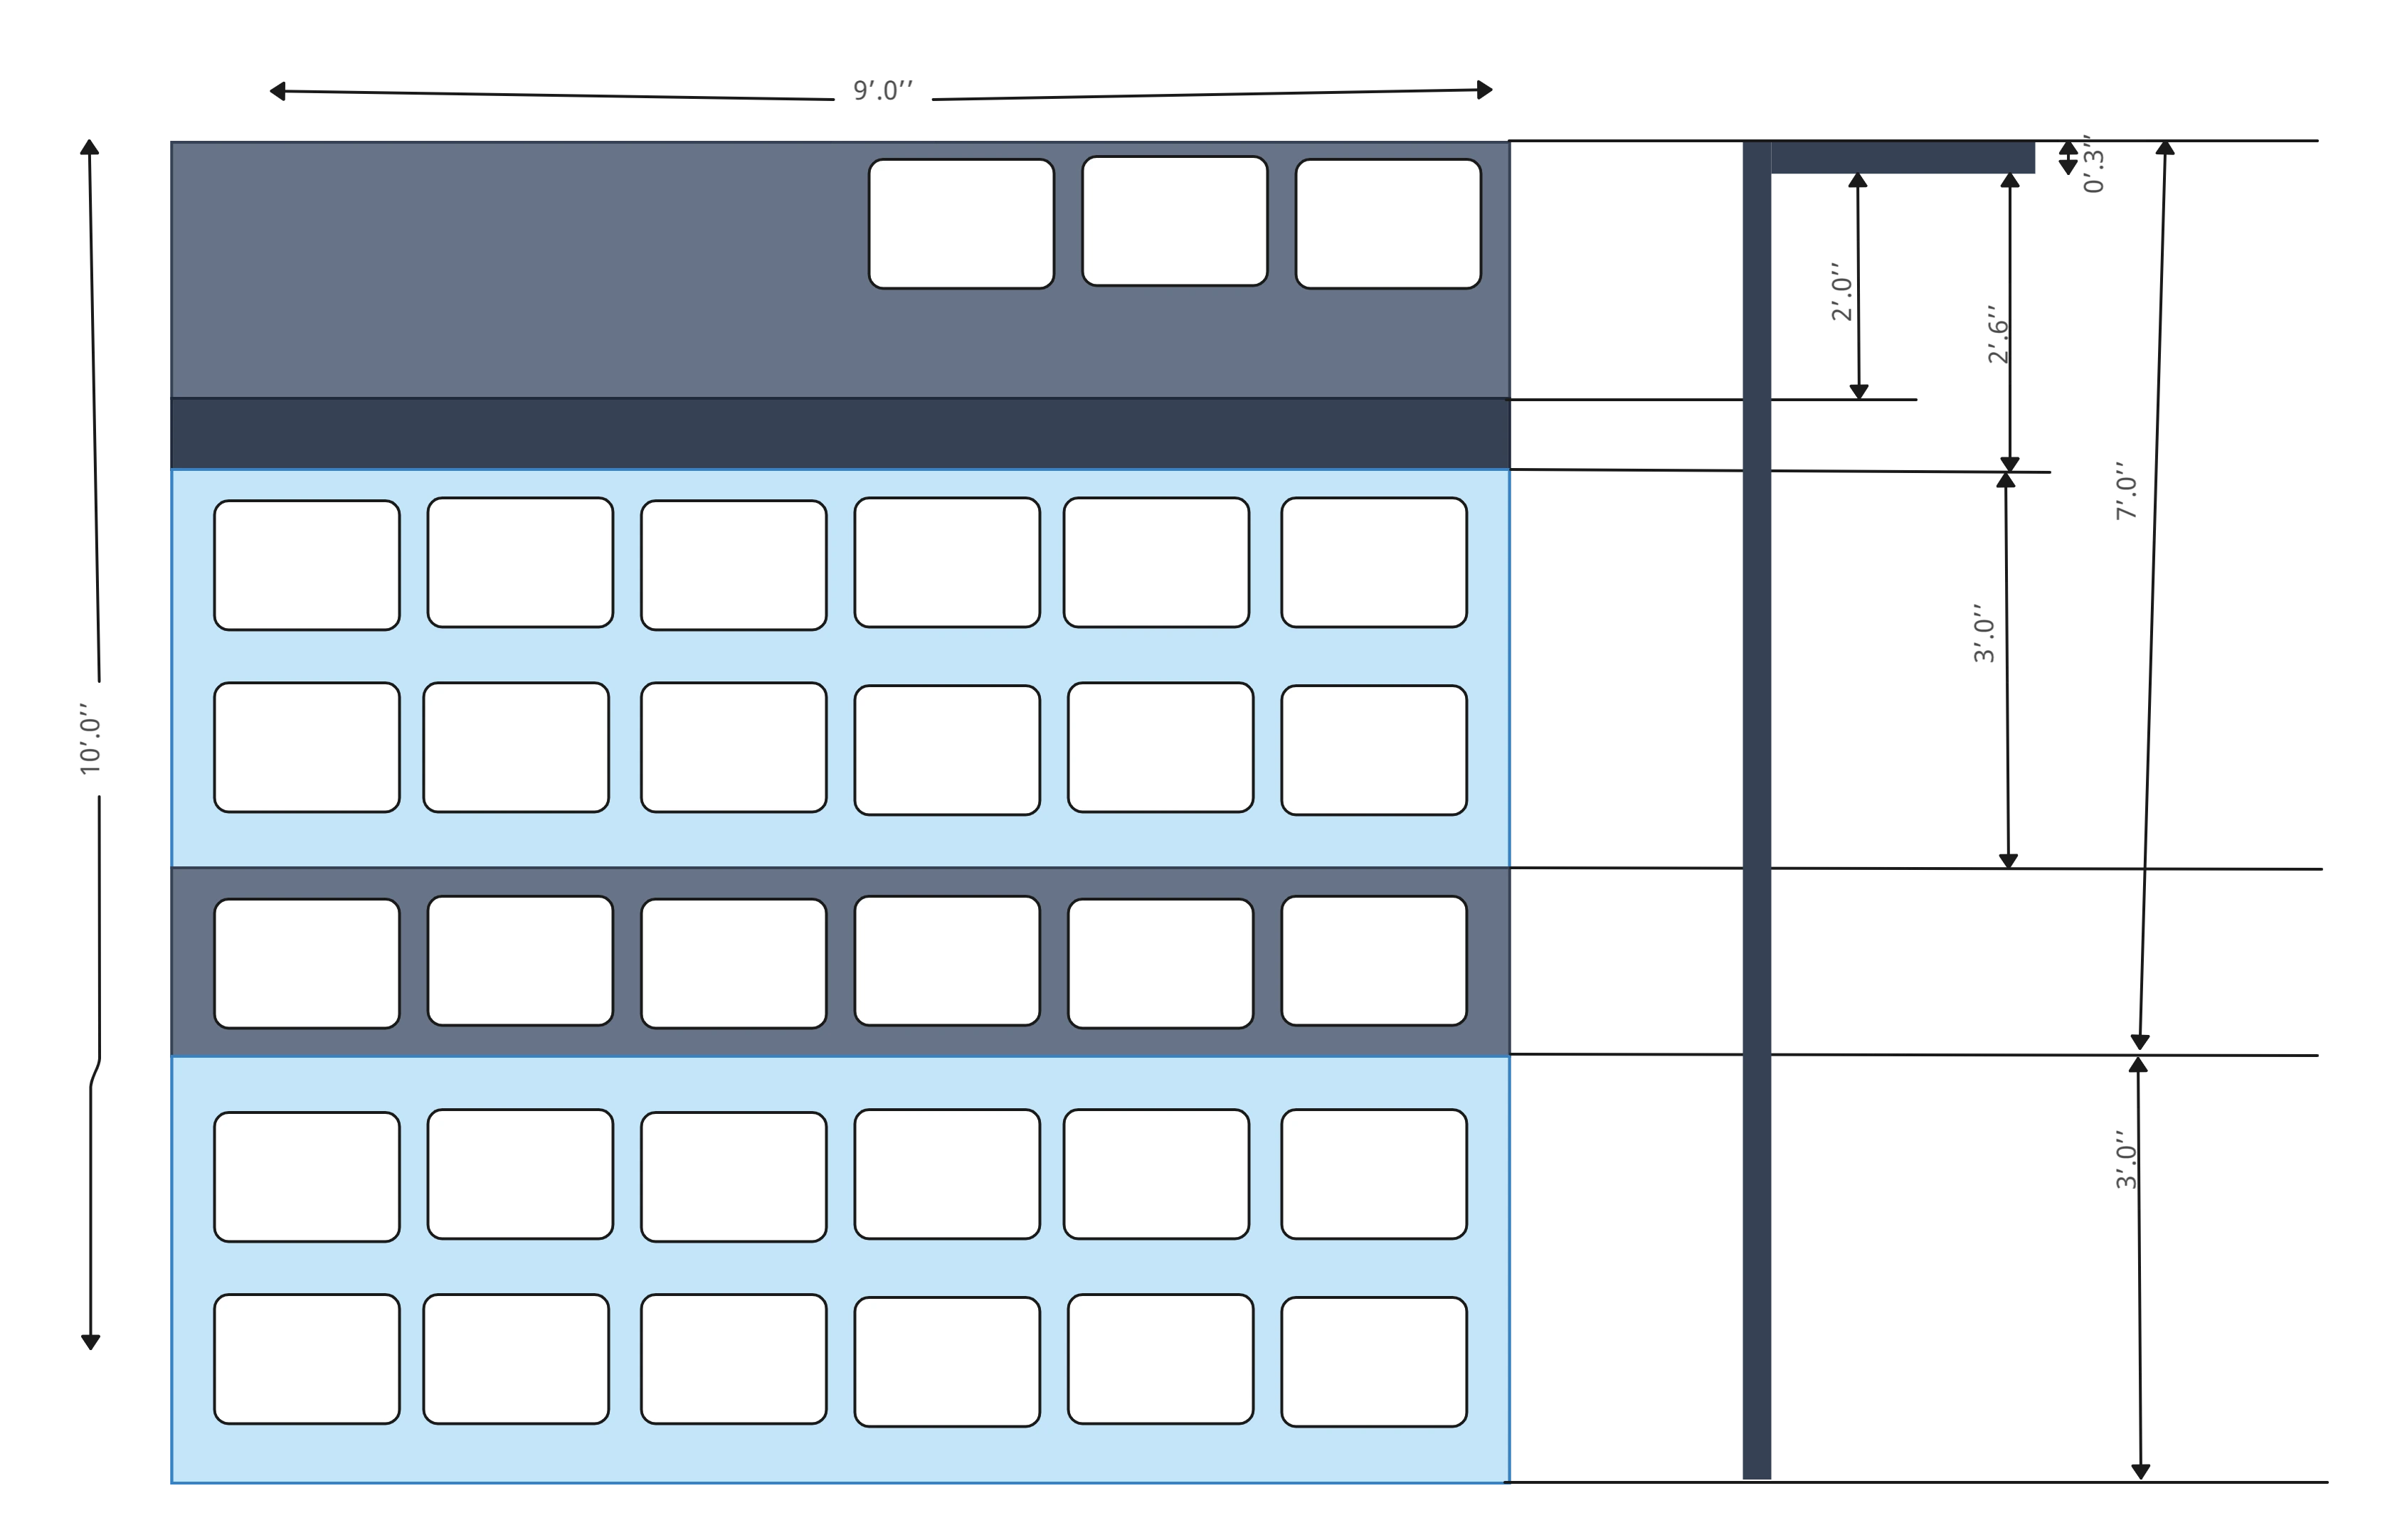
Get a head start on visual merchandising with professionally-designed planogram templates designed for real retail layouts. Use an easy-to-use shape library and flexible shape styling, customize colors, line styles, and text positioning to clearly visualize product display layouts. Apply color themes to quickly differentiate product categories, and use built-in Google image search to find related products instantly without leaving the app.
Centralize Customer Research. Maximize Sales

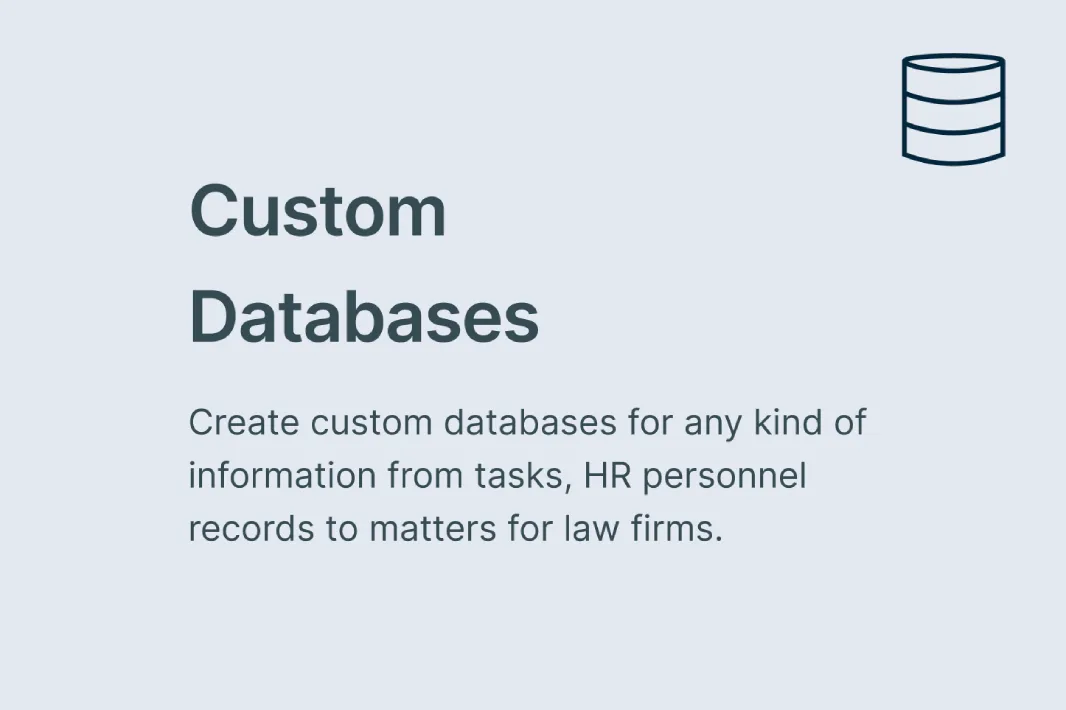
Import customer survey reports and review data with in-app previews to centralize customer research, conduct data analysis, and uncover behavioral patterns before sketching your planogram. Use shape data to store information about product categories, sizes and quantities that should be shelved in each section to create data-rich planograms. Use presentation mode inside the planogram creator to easily share your work with the team or export in JPEG, PNG, PDF or SVG formats to be included in reports and presentation.

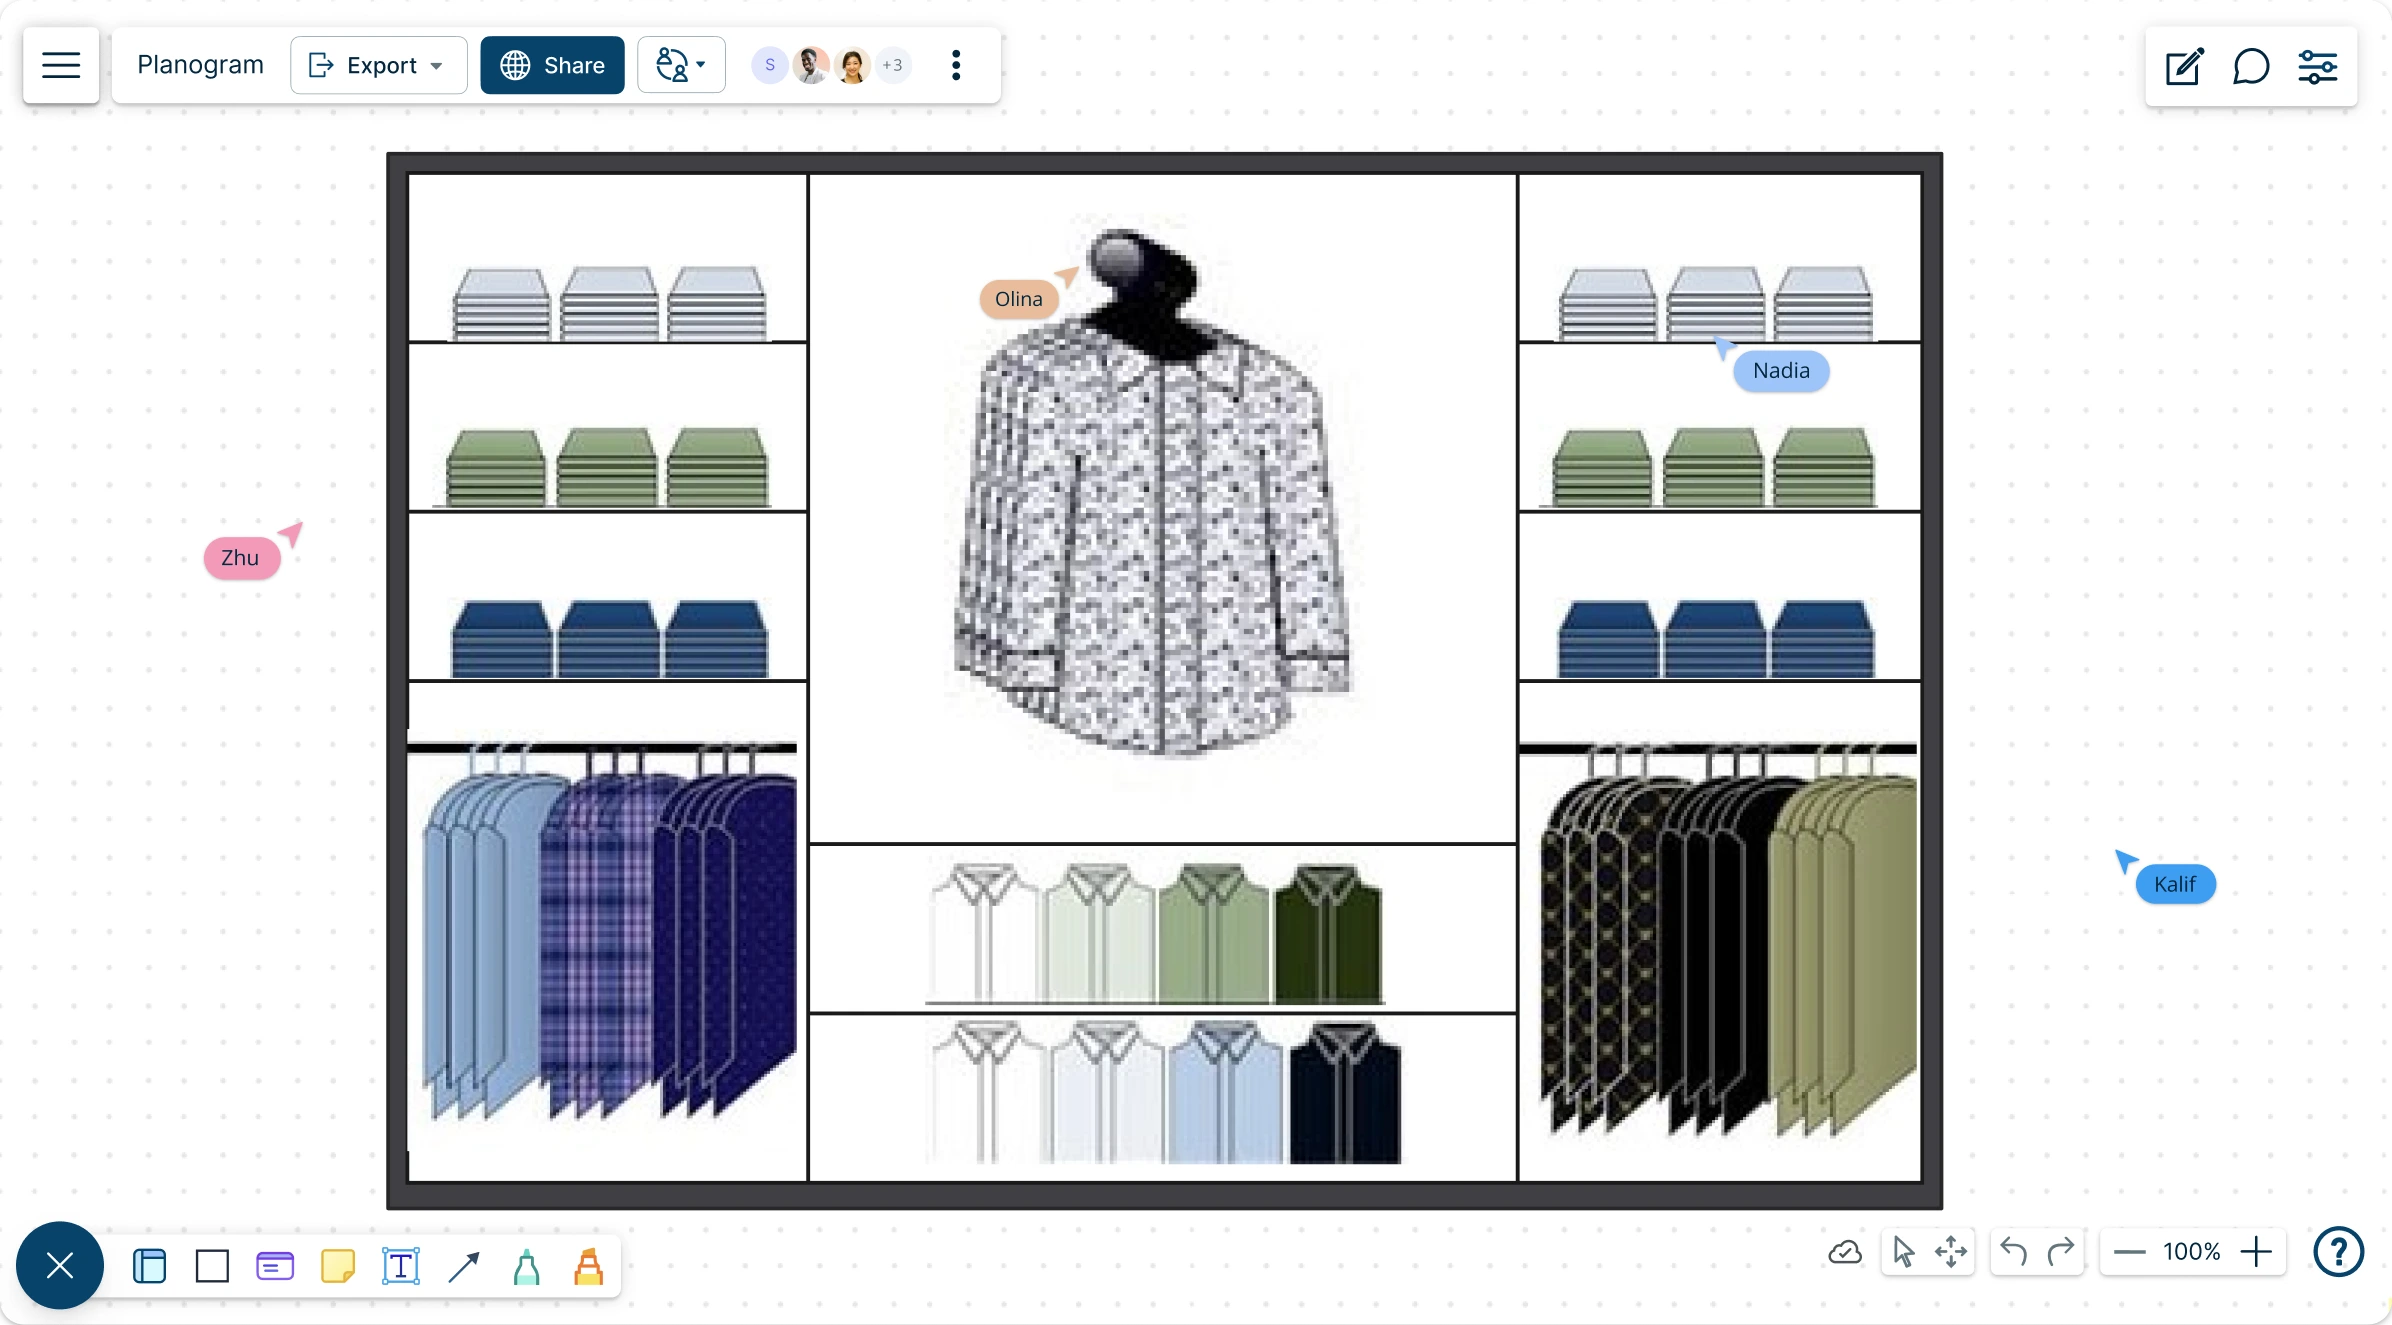
Keep the Team Informed About the Store Layout
Enable team sharing on the online planogram maker to share your workspace with the team and use it as a guide when restocking shelves, so that everyone knows which product goes where. Real-time cursors for any number of participants to collaborate with team members on a shared canvas. Use @mention comments to tag people to get things done or clarify things and comment threads to have discussions and follow-ups on the same canvas.
What Is a Planogram?

How to Create a Planogram?
Open a planogram template:
Start by choosing a ready-made planogram template or a blank canvas in Creately.Add data and references:
Import customer research or survey reports directly onto the canvas. Keep behavioral insights visible as you plan product placement, so decisions are guided by real shopper data.Customize the layout with shapes and images:
Enable the shape library and drag and drop shelves, racks, and product shapes to build your layout. Use built-in Google image search to quickly find product visuals and add them to the planogram.Add details and notes:
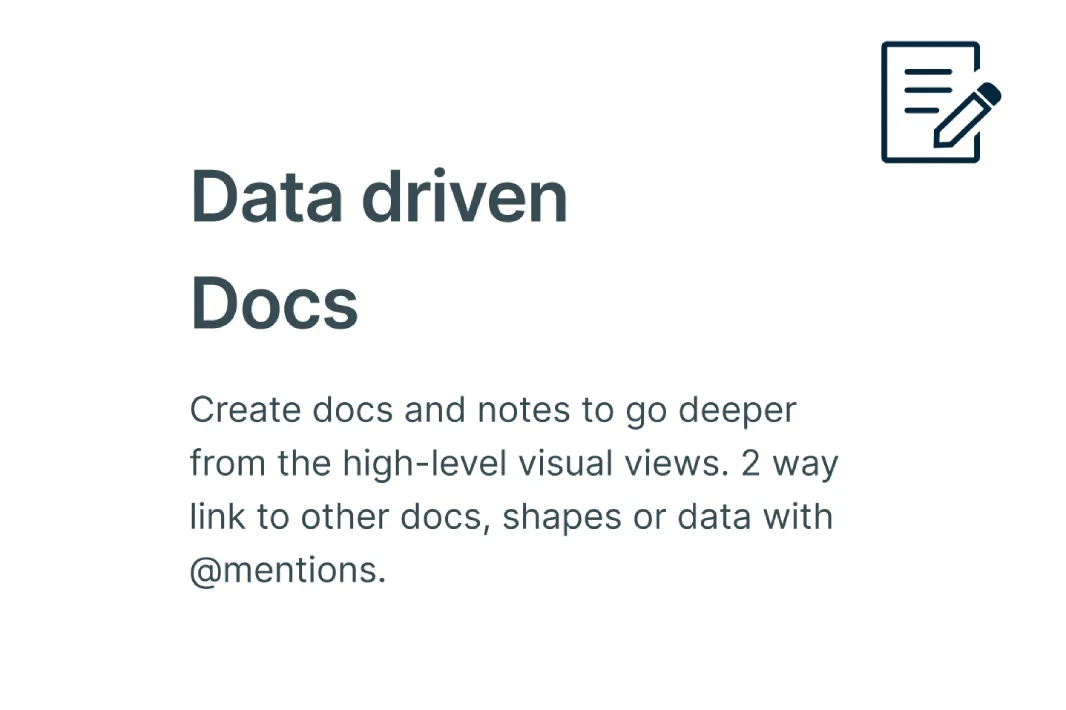
Use shape data, notes, and sticky notes to store details like product quantities, categories, re-shelving dates, and ownership. This turns your planogram into a clear, data-rich reference for the team.Review, collaborate, and share:
Invite team members to collaborate, gather feedback in real time, and refine the layout together. When ready, share via link or export your planogram as JPEG, PNG, PDF, or SVG for reports, presentations, or internal documentation.
More Planogram Examples to Get Started
FAQs about the Planogram Creator
What are Creately’s planogram maker pricing plans?
- Free Plan — $0/month for basic planogram creation and collaboration
- Starter & Team Plans — $8/month or $5/month billed annually
- Business Plan — $149/month or $89/month billed annually
Annual billing helps you save more while unlocking advanced collaboration, workspace management, and enhanced planogram features. You can compare all available plans and features on the Creately Pricing Page.
How can you create planograms faster?
Are there templates for different planogram use cases?
Can teams collaborate on planograms?
Can I add notes, data, and files?
Can I share, present, or export planograms?