State Diagram Maker
Visualize System Behavior with UML State Diagram Generator
Easily illustrate the dynamic states of any complex system in just a few clicks. Create the best state diagrams online to convey an object’s responses to various events and the influence of its past states. Ideal state machine diagram generator supporting accurate modeling of real-world systems.
- Extensive shape library with UML and state diagram shapes
- Customizable templates to quickly start any project
- Seamless real-time collaboration with teams from any location


 Diagramming Visual Collaboration Org Chart


How to Use Creately’s Online State Diagram Tool with Your Team
Launch Creately:
Sign in and open your workspace. Choose a blank canvas or start instantly with a customizable state diagram template.
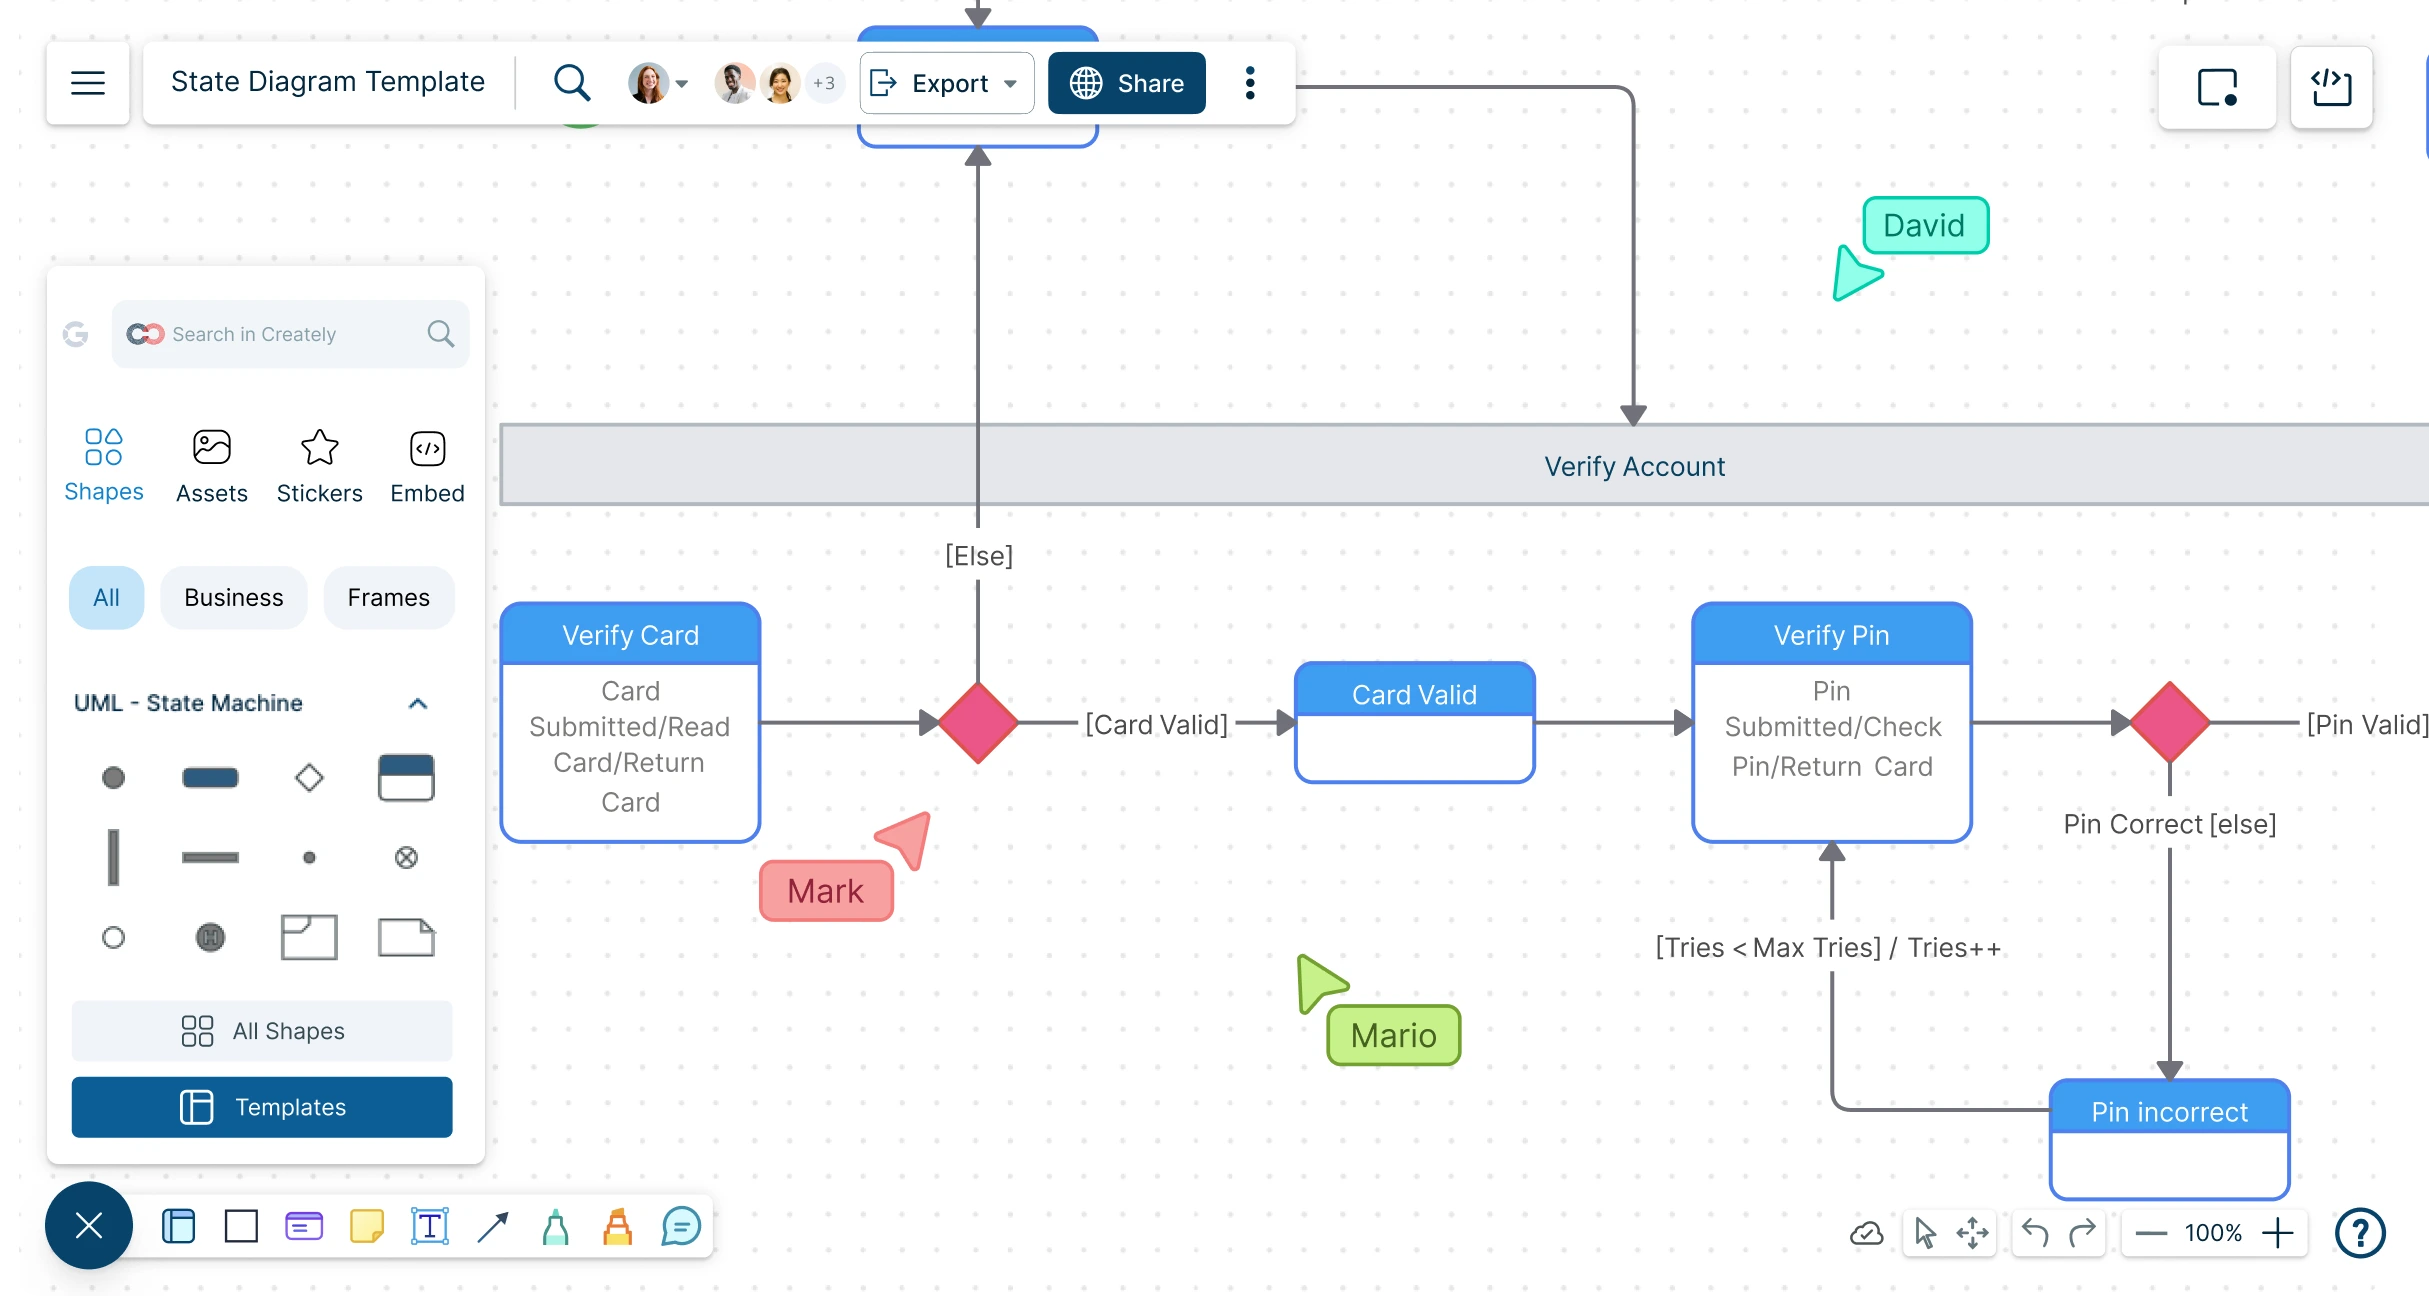
Add States & Transitions:
Use the UML shape library to create your state machine diagram online. Drag and drop states, add transitions with connectors, and label them to show how the system moves between different conditions.
Customize & Organize:
Use text labels, sticky notes, and the notes panel to document system behavior. Group elements, arrange layers, and add multimedia (images, links, docs) for clarity.
Collaborate in Real Time:
Invite teammates to edit or comment directly on your state transition diagram. Share feedback, assign access levels, and brainstorm together, no matter where you are.
Review, Update & Share:
Your work saves automatically in the cloud. Export your state diagrams online as images or PDFs, or share them with a secure link for quick feedback.


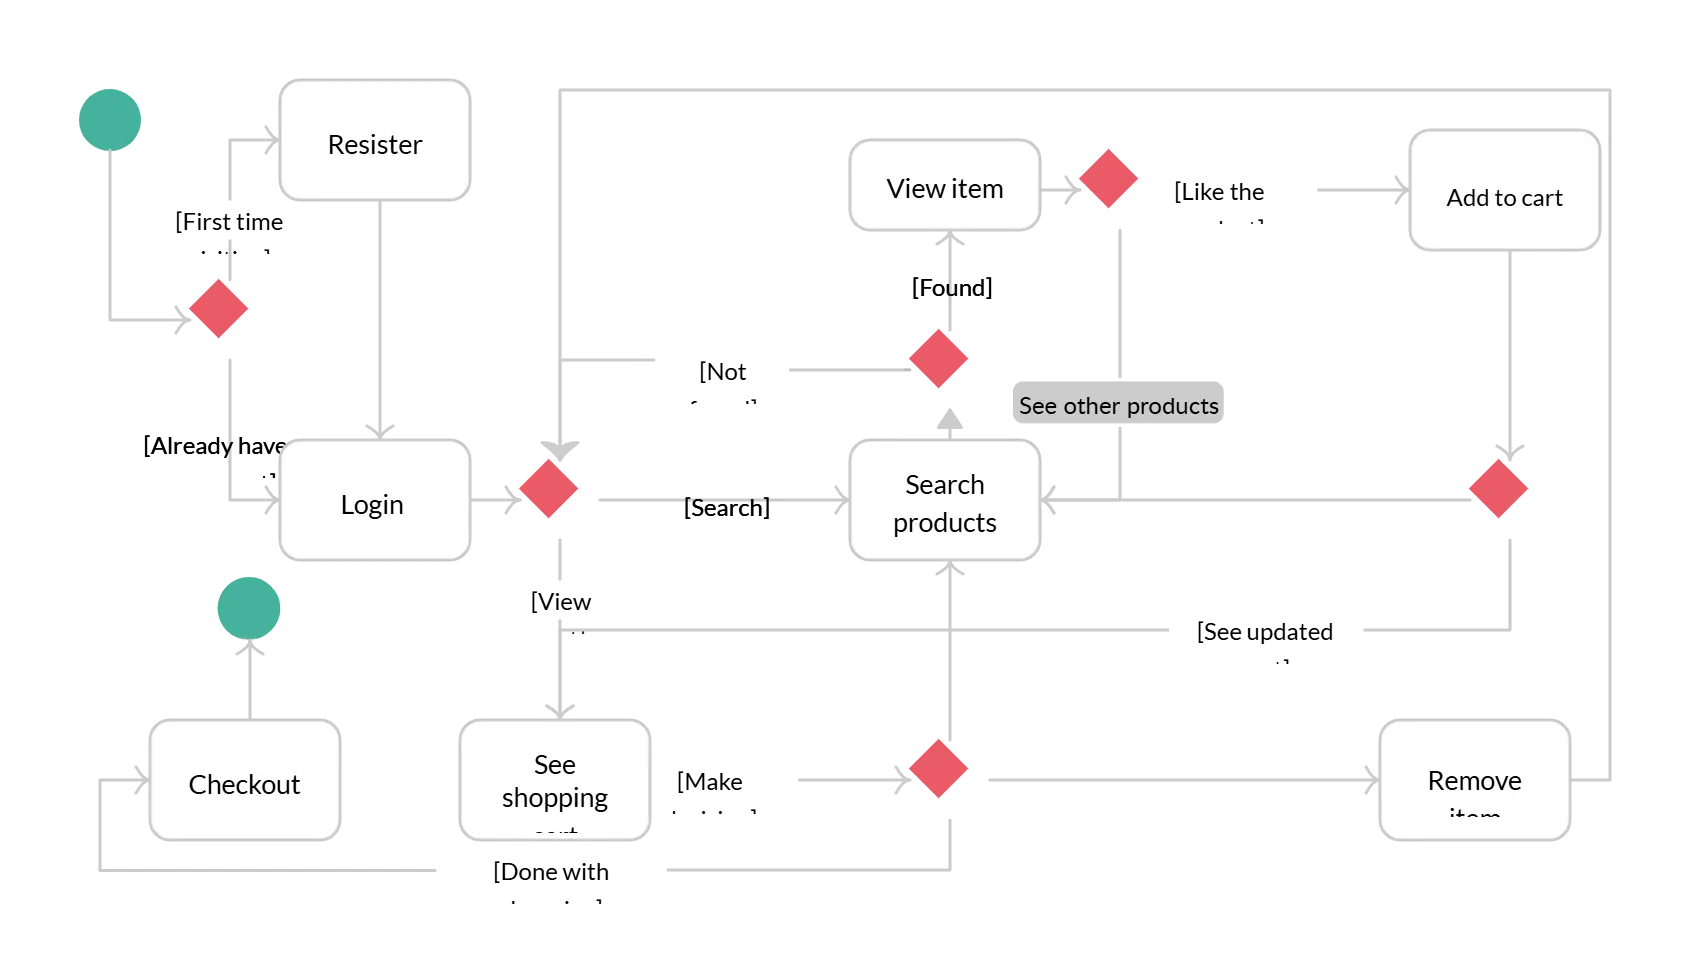
How to Create a State Diagram
Create State Machine Diagrams in Minutes with These Free Editable Templates
Visualize System Behavior and Dynamics with an Online State Diagram Generator

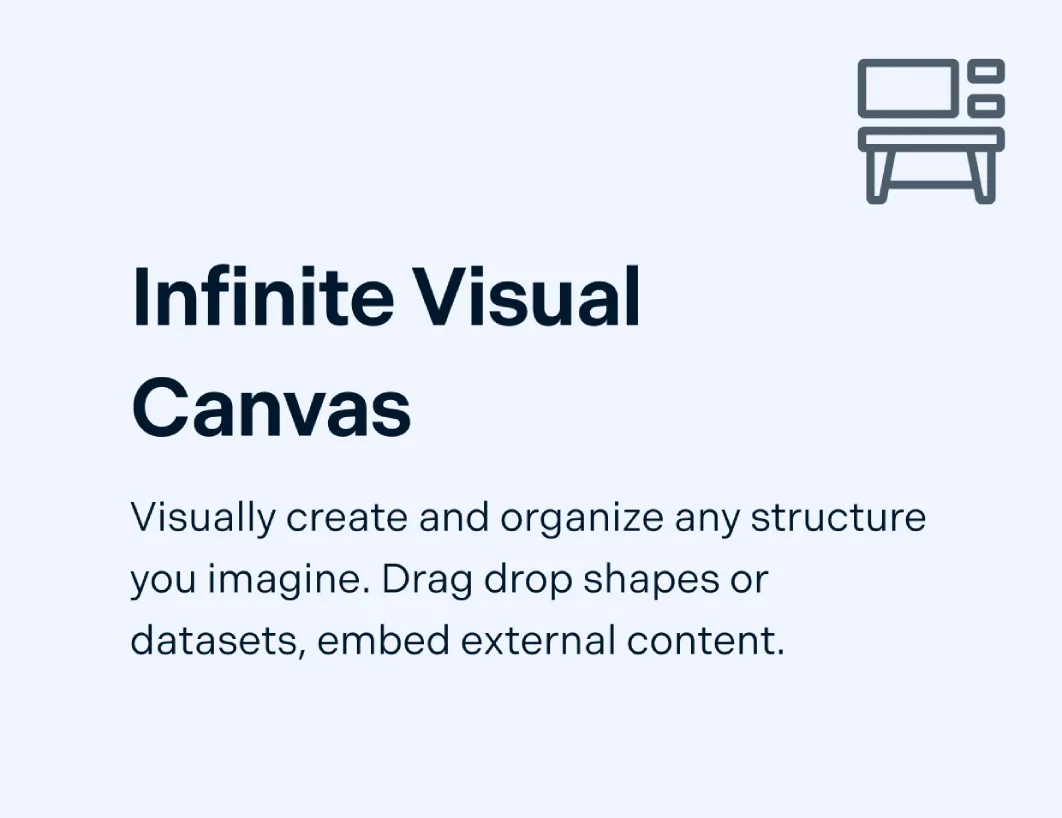
Infinite canvas to draw large, complex state machine diagrams seamlessly with ample space and intuitive navigation tools.
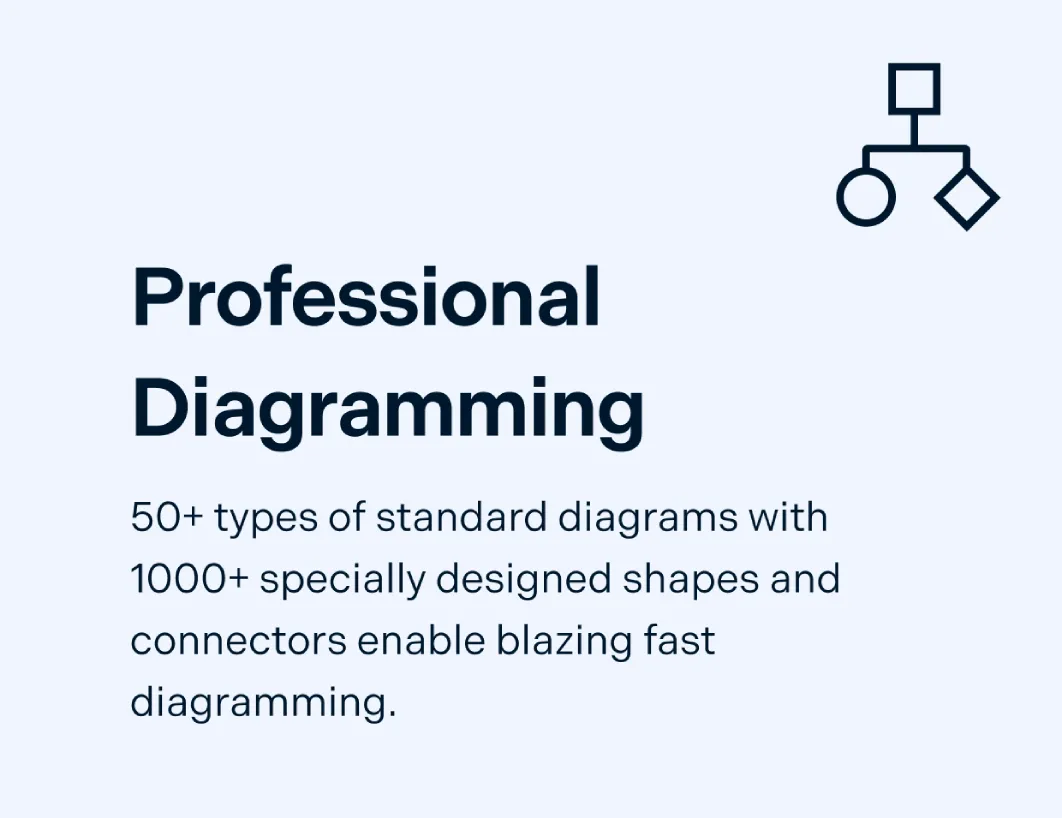
Smart shapes, connectors, and styling options to easily create any UML state diagram type.
Simple drag-and-drop tools and Plus Create feature to quickly map processes, flows, systems, and ideas.
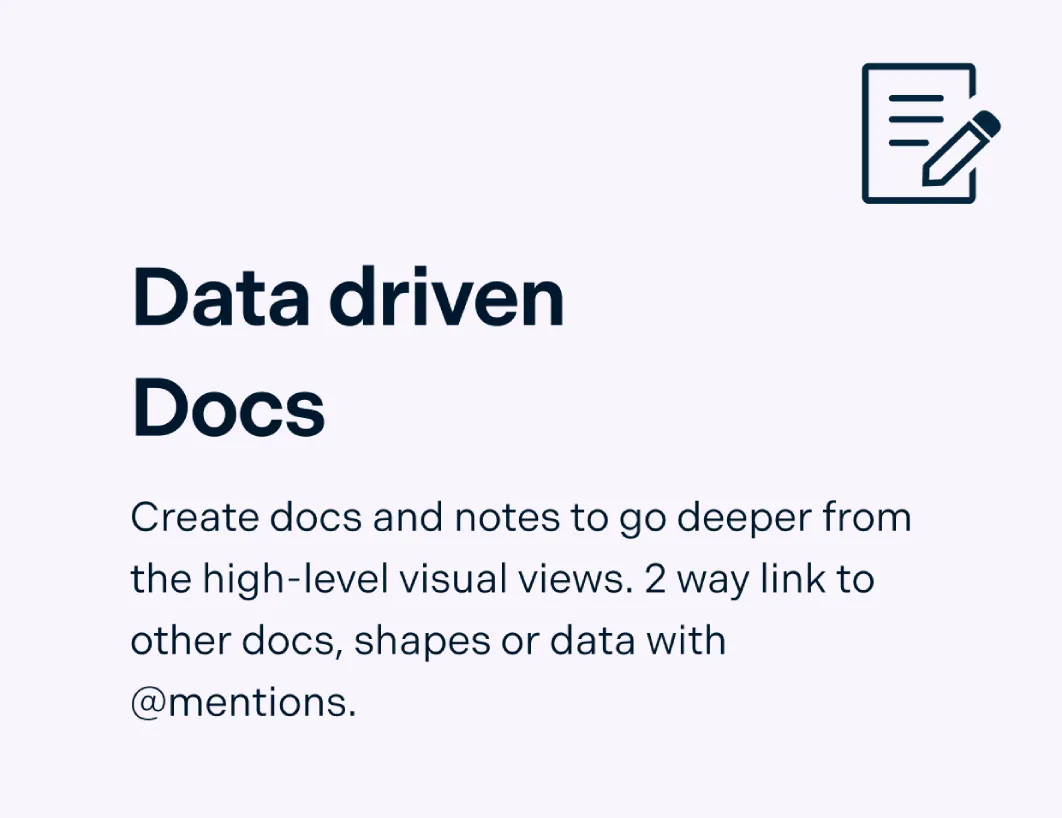
Embed external links to documents and view them directly on the canvas for comprehensive system insights.

Collaborate on State Diagrams Online Like You're in the Same Room
Built-in whiteboarding to connect with teams while working on state machine diagrams together.
Real-time collaboration with live cursors and seamless team discussions for quick feedback and decision-making.
In-line commenting to discuss, highlight, and track feedback with team members directly on the diagram.
Flexible access levels to share securely with customizable roles, allowing viewers, reviewers, and editors as needed.
Take State Machine Diagrams to New Heights

Seamlessly integrate your state machine diagram with popular platforms like GitHub, Slack, Google Workspace, and Confluence.
Enhanced contextual information of your state machine diagram with additional data fields and custom properties for better clarity.
Multiple document status tracking to indicate progress as Draft, In Progress, In Review, Approved, or Final.
Organize canvas frames on the infinite canvas to create Kanban boards, timelines, and grids for organizing multiple state diagrams.
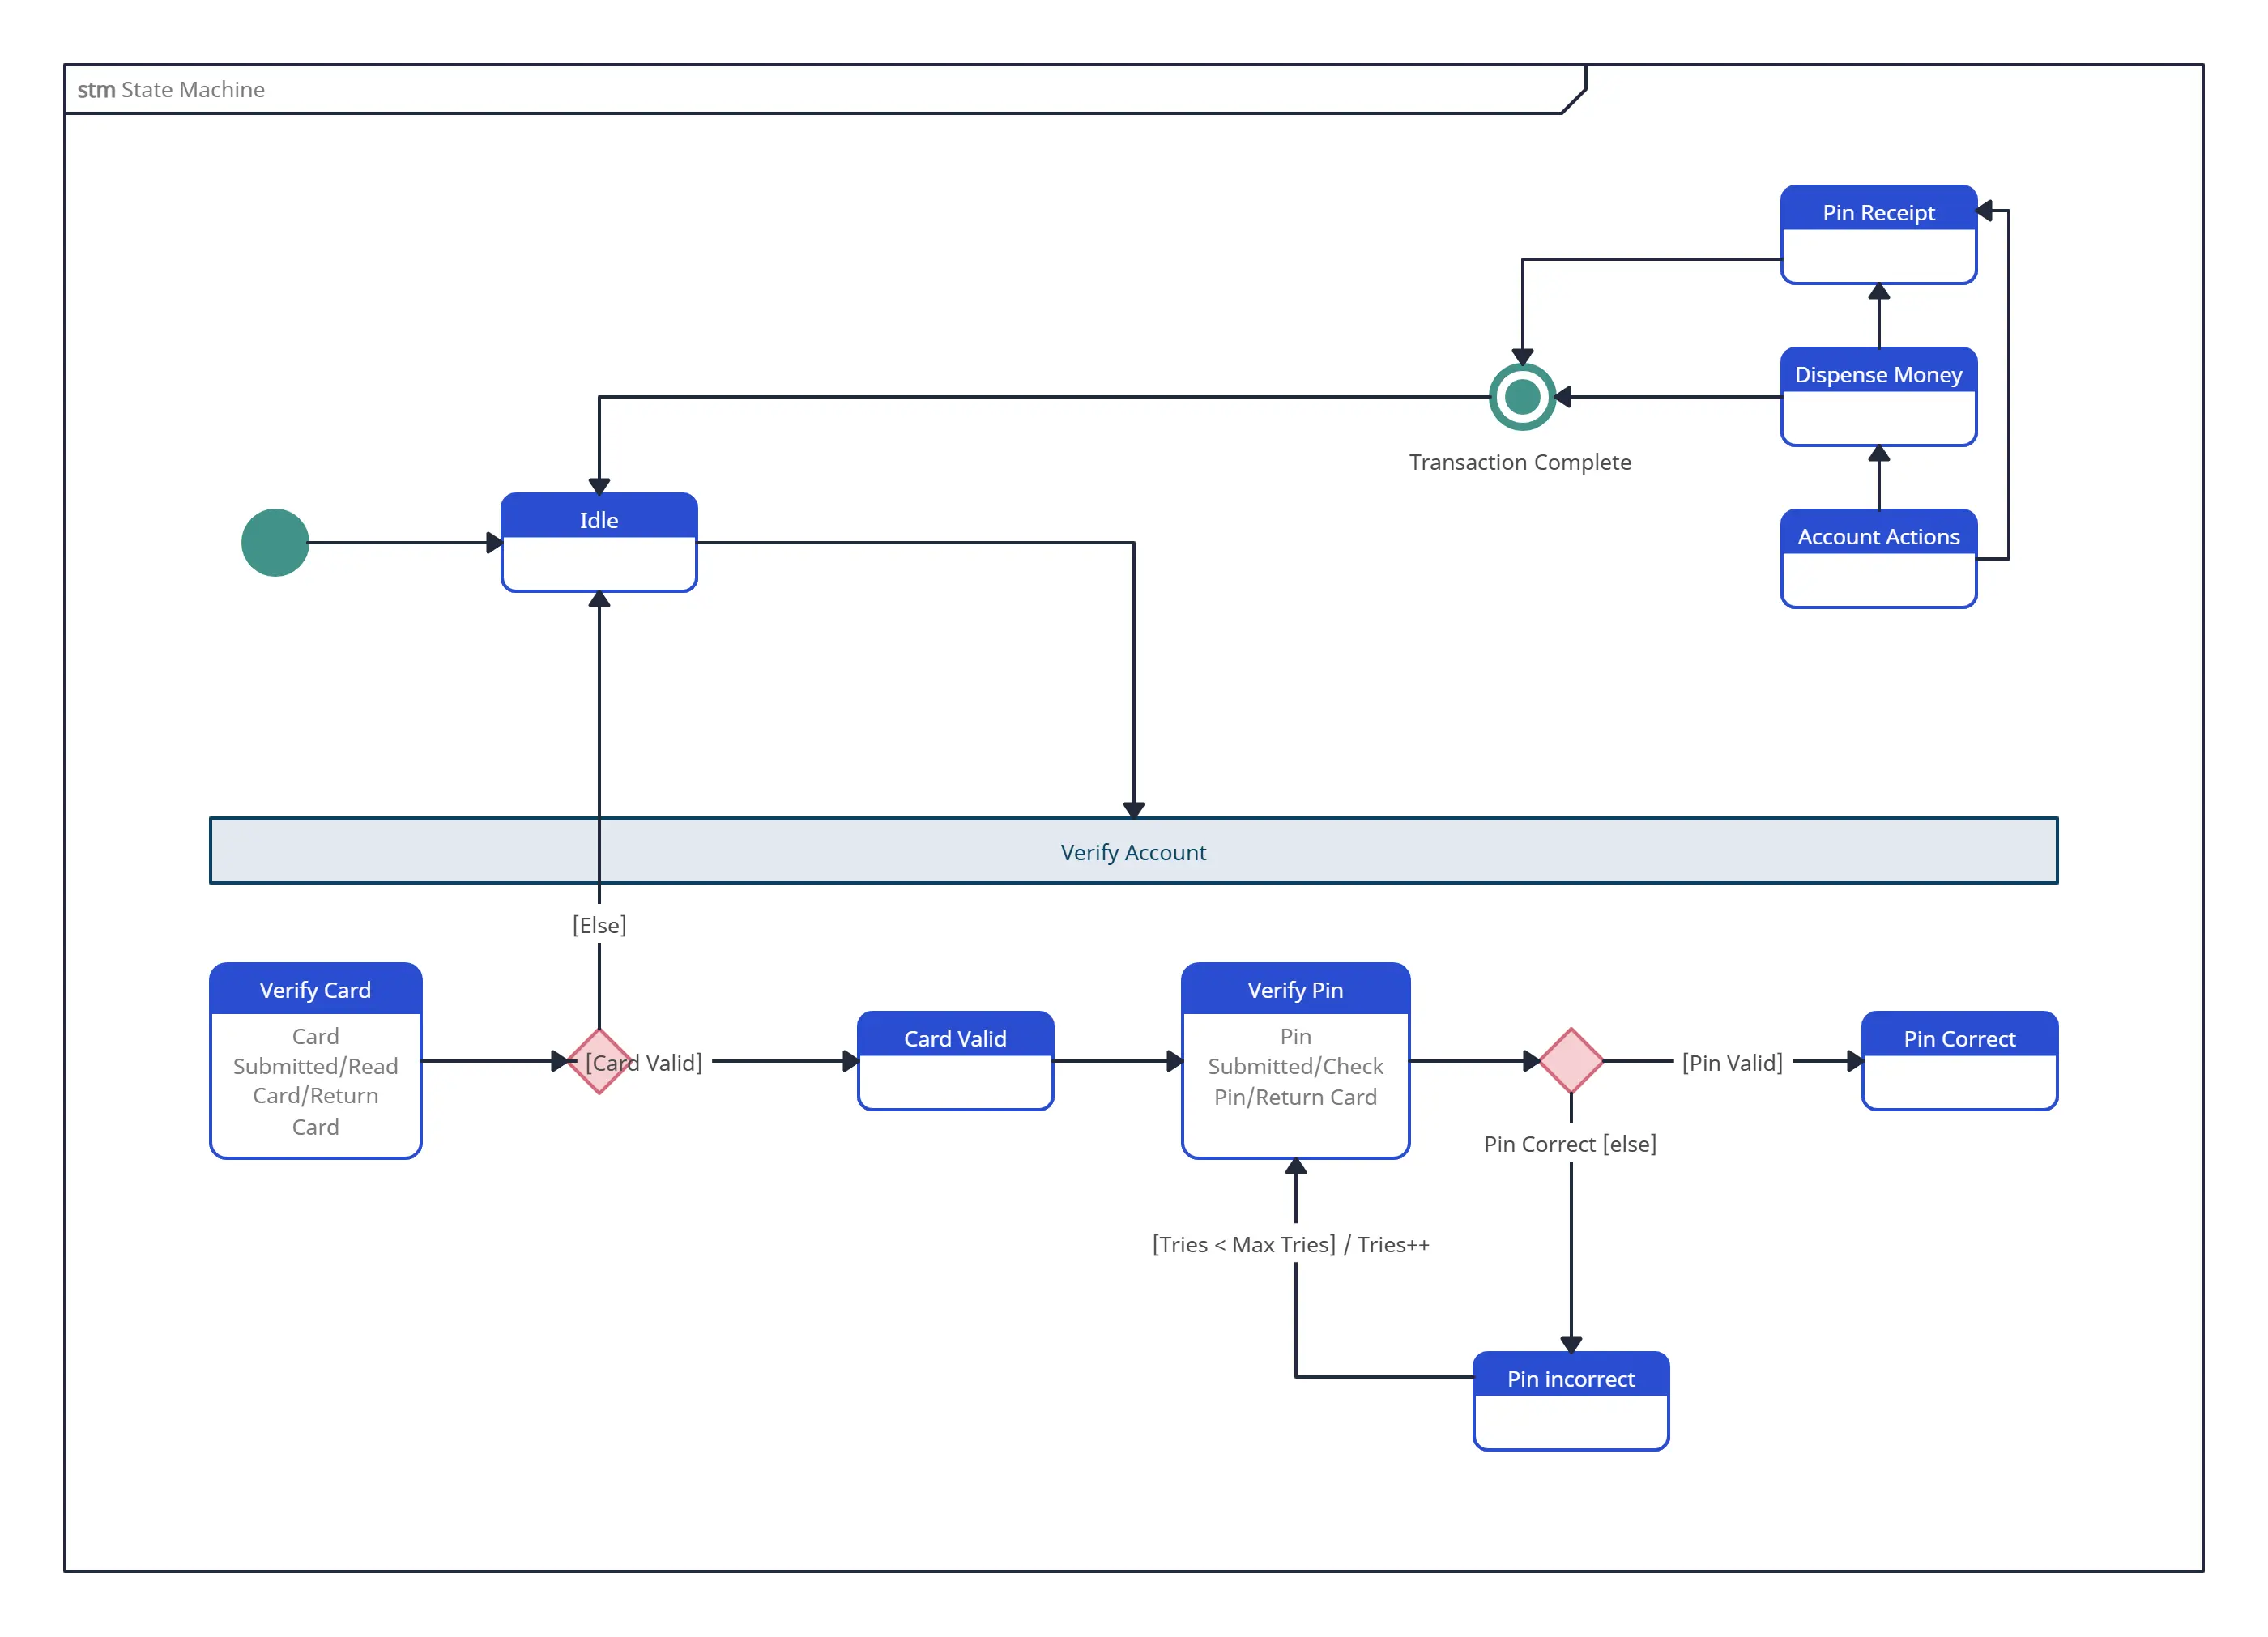
What Is a State Diagram?

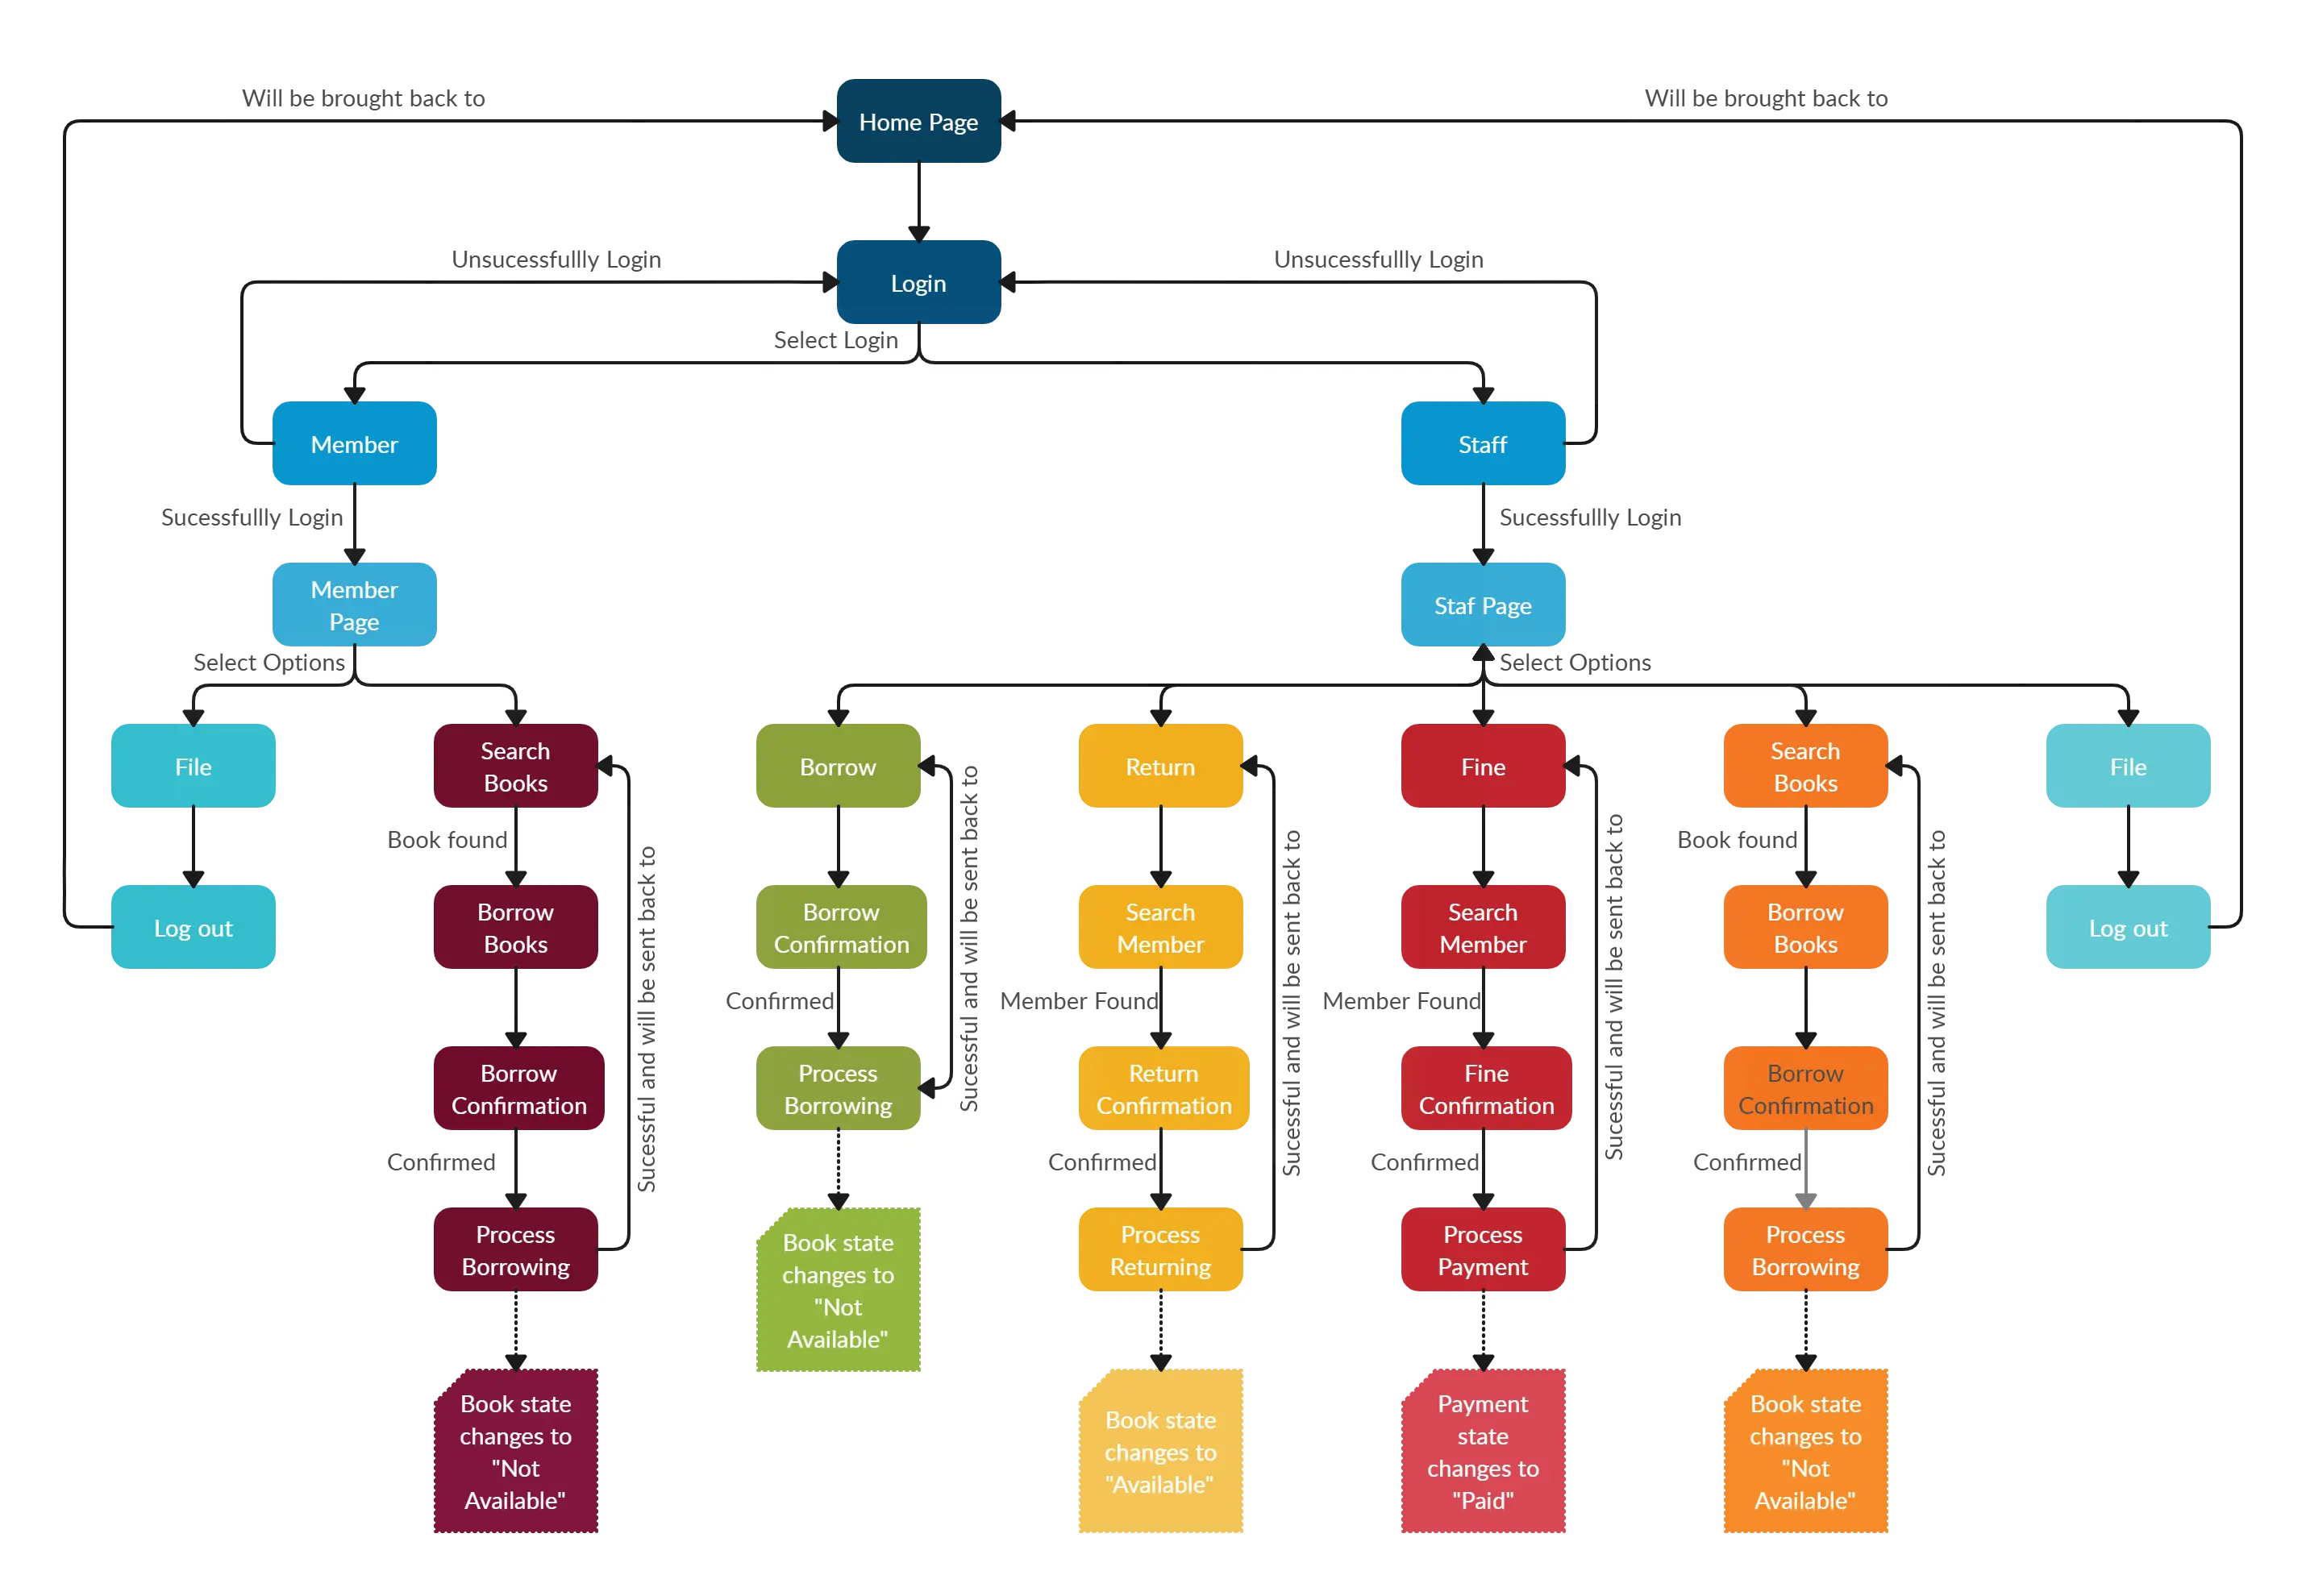
A state diagram, also known as a state machine diagram, is a type of Unified Modeling Language (UML) diagram commonly used in computer science. This diagram illustrates how a system behaves in response to various events by detailing all possible states, transitions, and actions associated with an object.
Utilizing a state diagram creator, users can effectively visualize the dynamic interactions within a system, capturing the complex relationships between different states. By mapping out these transitions, state diagrams help clarify how objects change over time, making them essential tools for developers and engineers looking to design robust systems. These diagrams serve as a powerful means to convey the behavior of systems in a clear and structured manner.
How to Use Creately’s Online State Diagram Tool with Your Team
Launch Creately:
Sign in and open your workspace. Choose a blank canvas or start instantly with a customizable state diagram template.
Add States & Transitions:
Use the UML shape library to create your state machine diagram online. Drag and drop states, add transitions with connectors, and label them to show how the system moves between different conditions.
Customize & Organize:
Use text labels, sticky notes, and the notes panel to document system behavior. Group elements, arrange layers, and add multimedia (images, links, docs) for clarity.
Collaborate in Real Time:
Invite teammates to edit or comment directly on your state transition diagram. Share feedback, assign access levels, and brainstorm together, no matter where you are.
Review, Update & Share:
Your work saves automatically in the cloud. Export your state diagrams online as images or PDFs, or share them with a secure link for quick feedback.
FAQs About Creately's State Diagram Maker
What is the purpose of a state diagram?
What are some common mistakes in state diagrams?
Some frequent mistakes include:
- Drawing unnecessary states,
- Making transitions too complex or
- Forgetting to label transitions and events clearly. These errors can make diagrams confusing instead of clarifying system behavior. Using Creately helps users avoid these issues by starting with pre-made UML state diagram templates, utilizing drag-and-drop shapes for accuracy, and collaborating in real-time with your team to ensure clarity.
What are the best practices for state diagrams?
Good practices include;
- Keeping your diagram simple,
- Clearly labeling states and transitions, and
- Ensuring each state has meaningful entry and exit points. It’s also best to focus only on essential behaviors to avoid clutter. Creately’s state diagram generator supports best practices with features like grouping, layering, and sticky notes, which help keep your diagram organized and easy to understand.
What are the basic elements of a state diagram?
What is the guard condition in a state diagram?
What can I use Creately’s state diagrams for?
State diagrams in Creately are primarily used to model the dynamic behavior of systems. They help visualize how an object transitions between different states in response to various events, making them ideal for:
- System design and analysis
- Software engineering
- Process mapping
- Workflow visualization
- Game development
Who can benefit from using state diagrams in Creately?
Various professionals and teams can find state diagrams useful, including:
- Software Developers and Engineers: To design and document the behavior of applications and systems.
- Project Managers: For visualizing project workflows and understanding system states.
- Business Analysts: To analyze processes and identify areas for improvement.
- Educators and Students: To teach or learn about systems thinking and behavior modeling.
- UX/UI Designers: For understanding user interactions with a system through different states.
Can I collaborate on Creately’s state diagrams in real-time?
How do I export my state diagram?
Is it possible to integrate Creately with other tools?
What features does Creately provide to enhance state diagram creation?
Creately provides a variety of features to enhance your state diagram creation, including:
- Extensive shape libraries specifically for UML diagrams
- Customizable templates for quick starts
- The ability to link external documents for detailed context
- Options for adding multimedia elements to enrich your diagrams
How to draw a state machine diagram?