Free Kinship Diagram Maker
Visualize Lineage and Understand Cultural Relationships
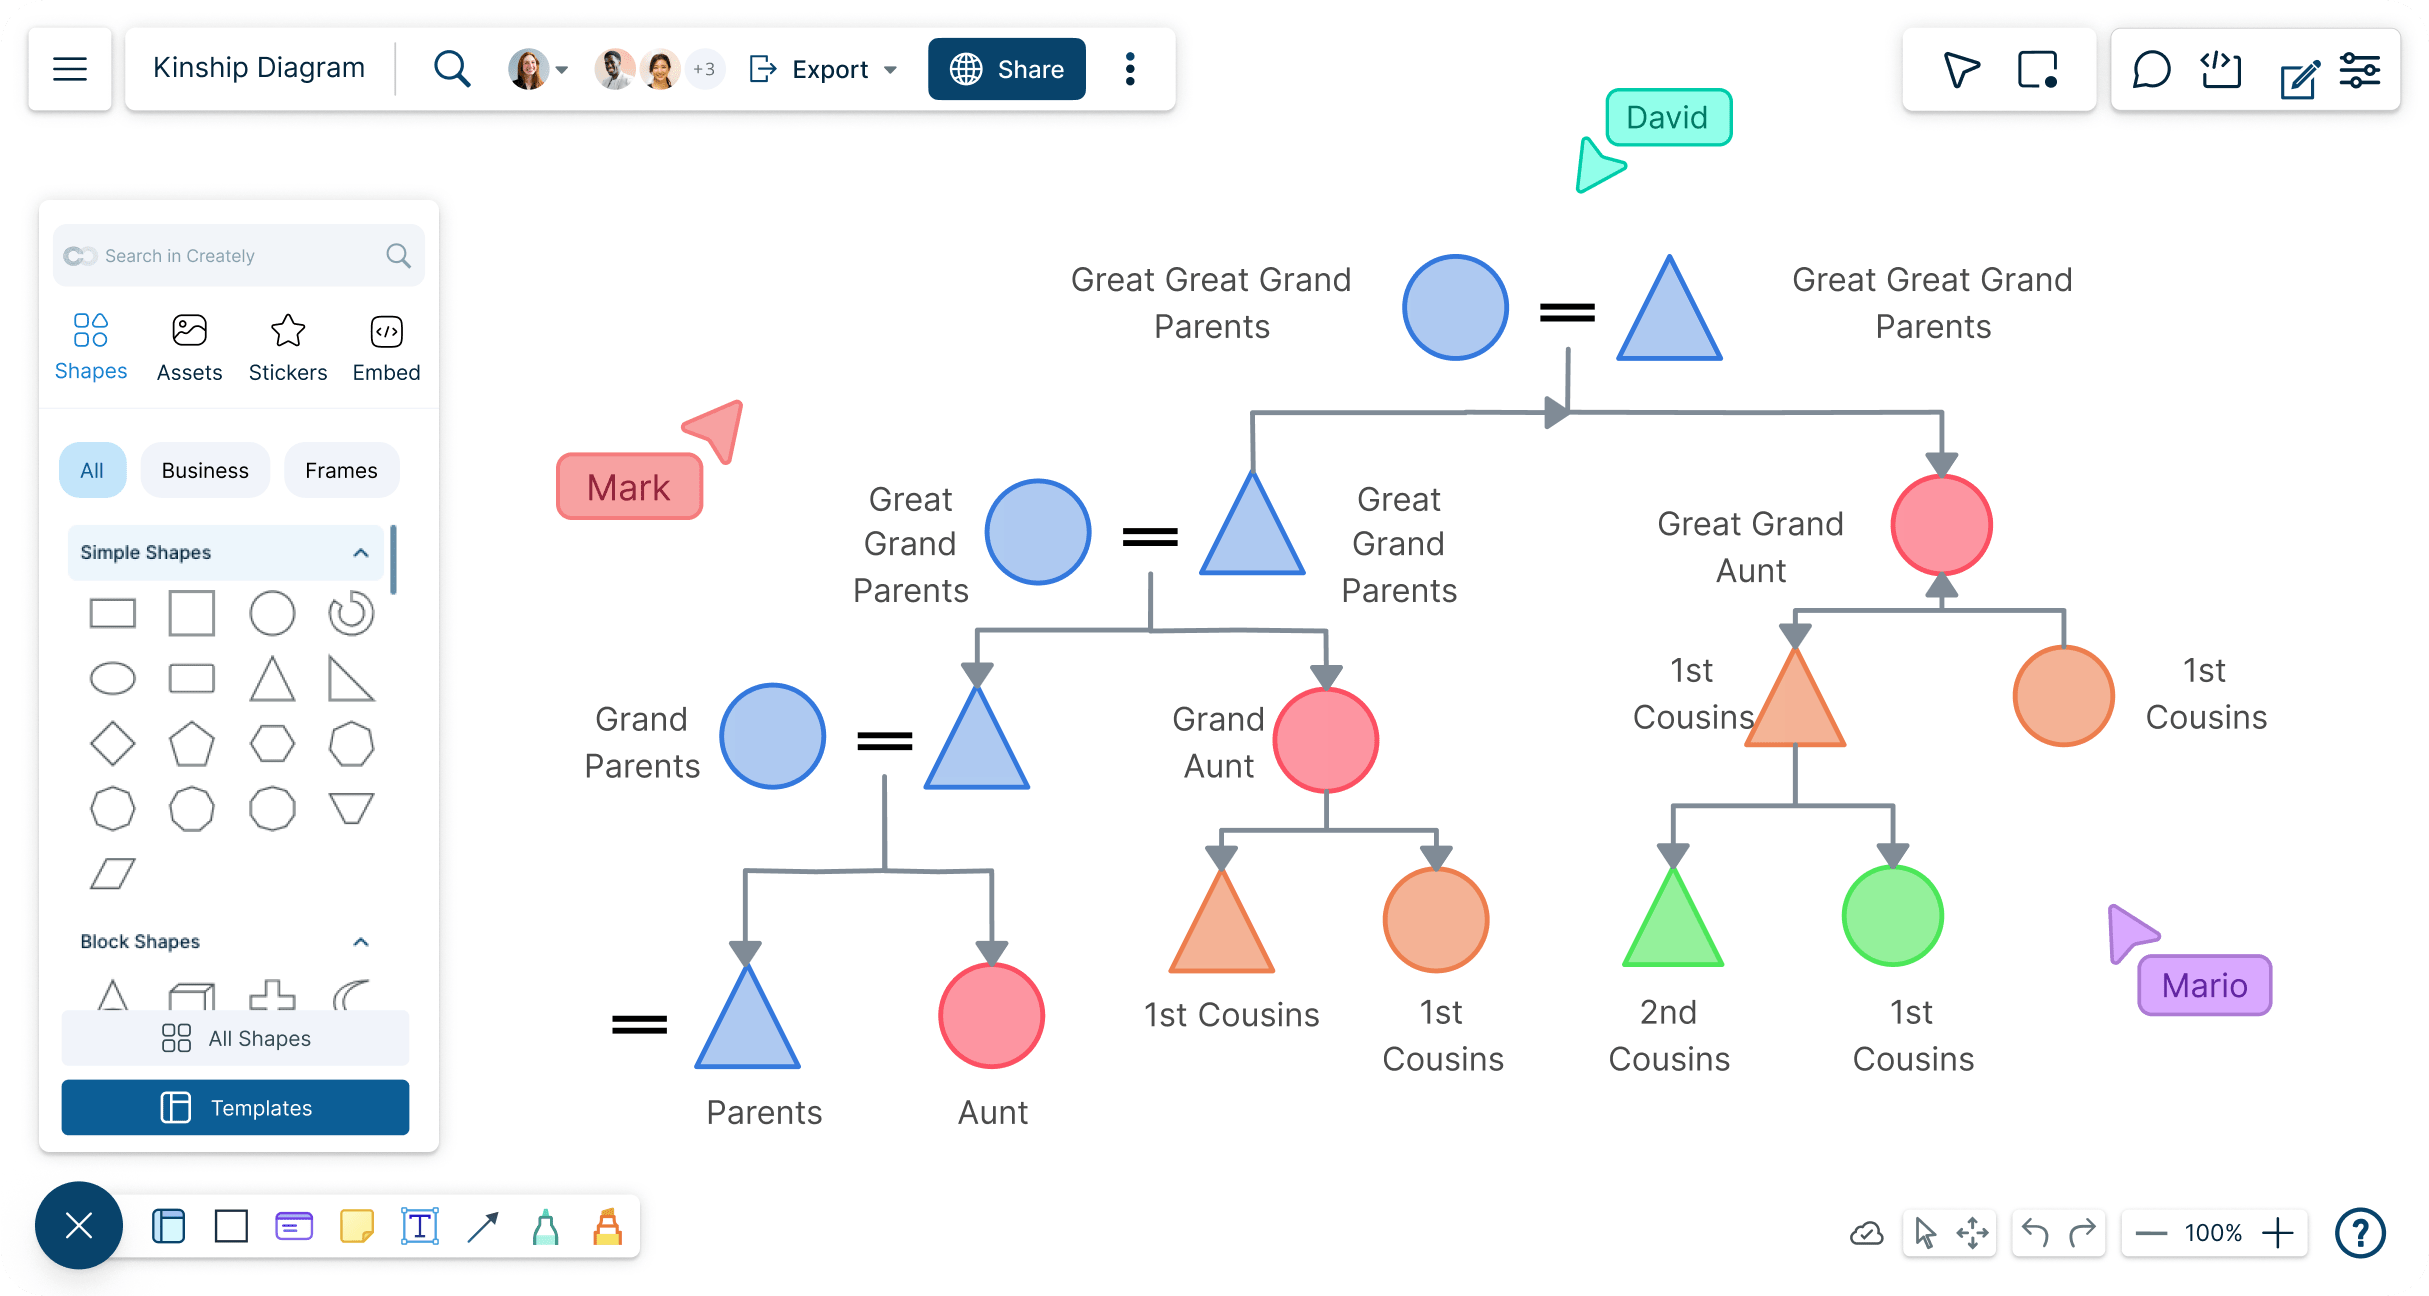
Visualize biological relationships and understand how they translate into social and cultural realities with Creately’s Kinship diagram maker.
- Customizable templates to effectively analyze cultural dynamics
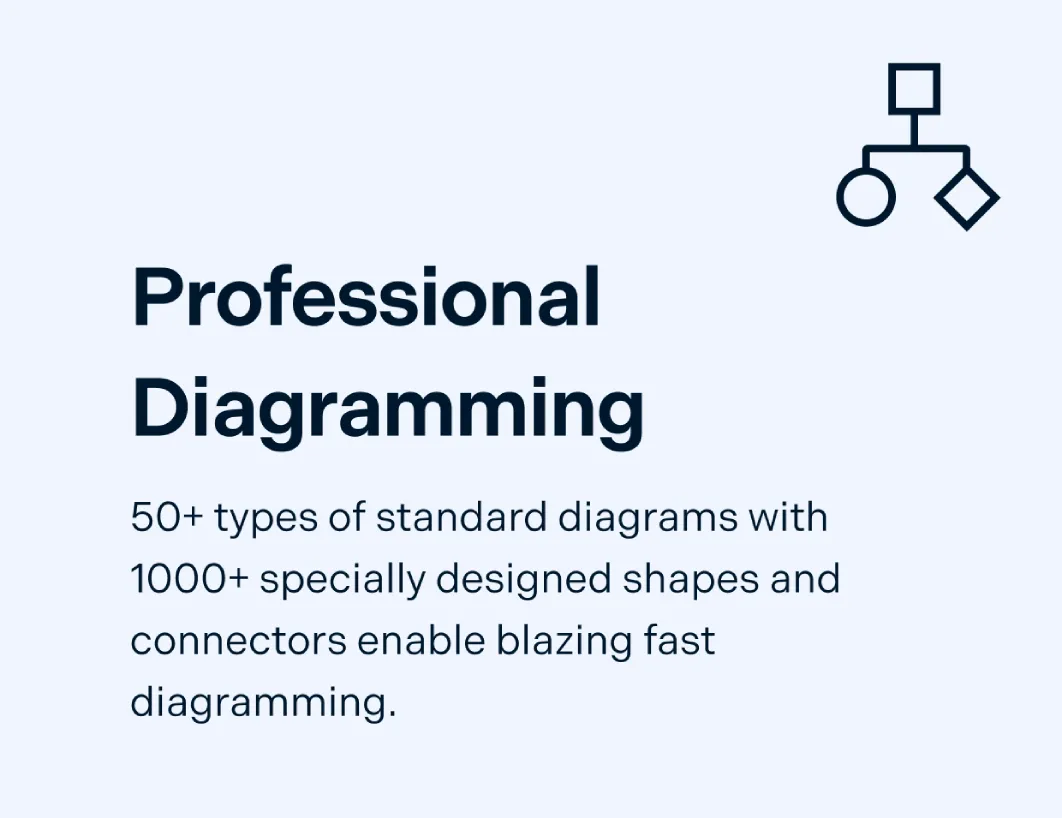
- Specific kinship diagram symbols libraries to show multiple relationship types
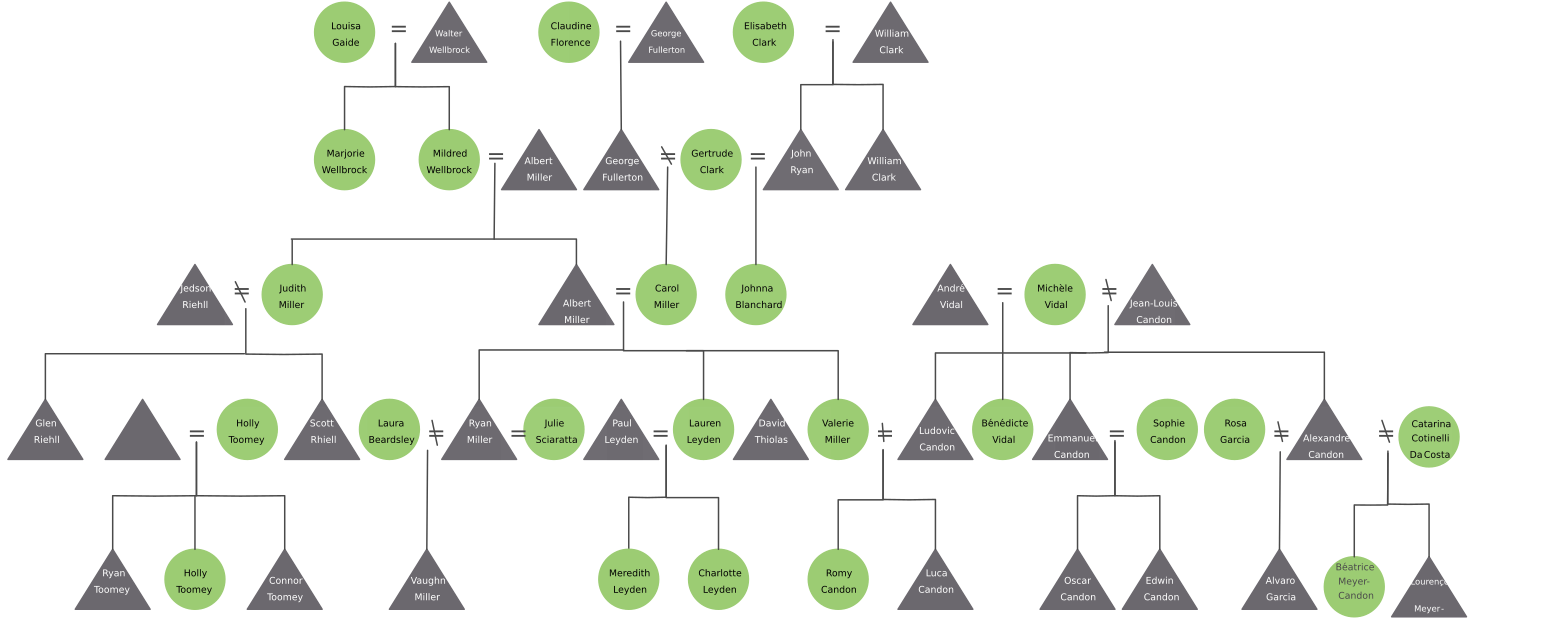
- Represent large societal units and understand relationships at a glance


 Diagramming Visual Collaboration Org Chart


Develop a Better Anthropological Understanding

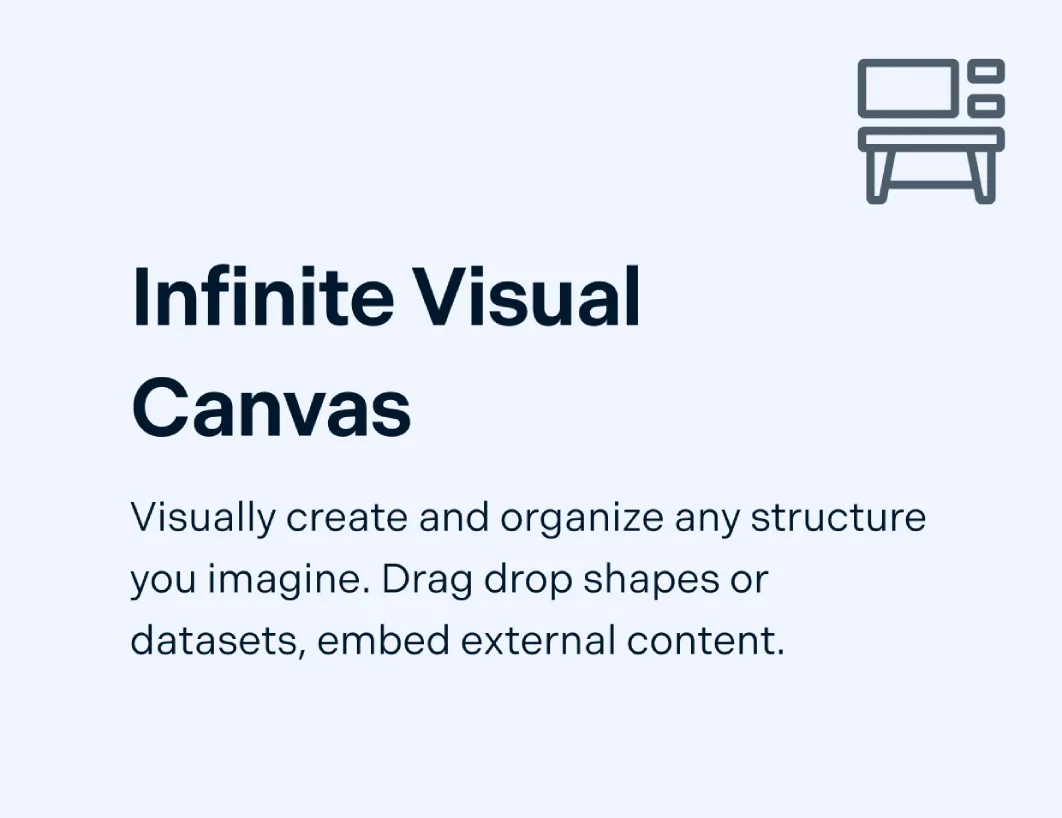
Infinite canvas to represent large societal structures together and represent complex relationships with ease.
Simple to use drag and drop tools to arrange the relationships types and build detailed kinship diagrams.
Specific shape libraries to represent people, marriage and cohabitation, decent and more.
Data enabled shape panel to add additional information to specific symbols in a kinship diagram- to clarify relationship types.

Conduct In-depth Cultural Analysis Together
Collaborative workspaces to connect multiple research participants and interact like you are in the same room.
Multiple access levels and roles to share with relevant members as viewers, reviewers, and editores.
Real-time cursors for any number of participants. Collaborate with other research participants for better understanding.
Pinpoint Comments to receive detailed feedback on kingship diagrams.
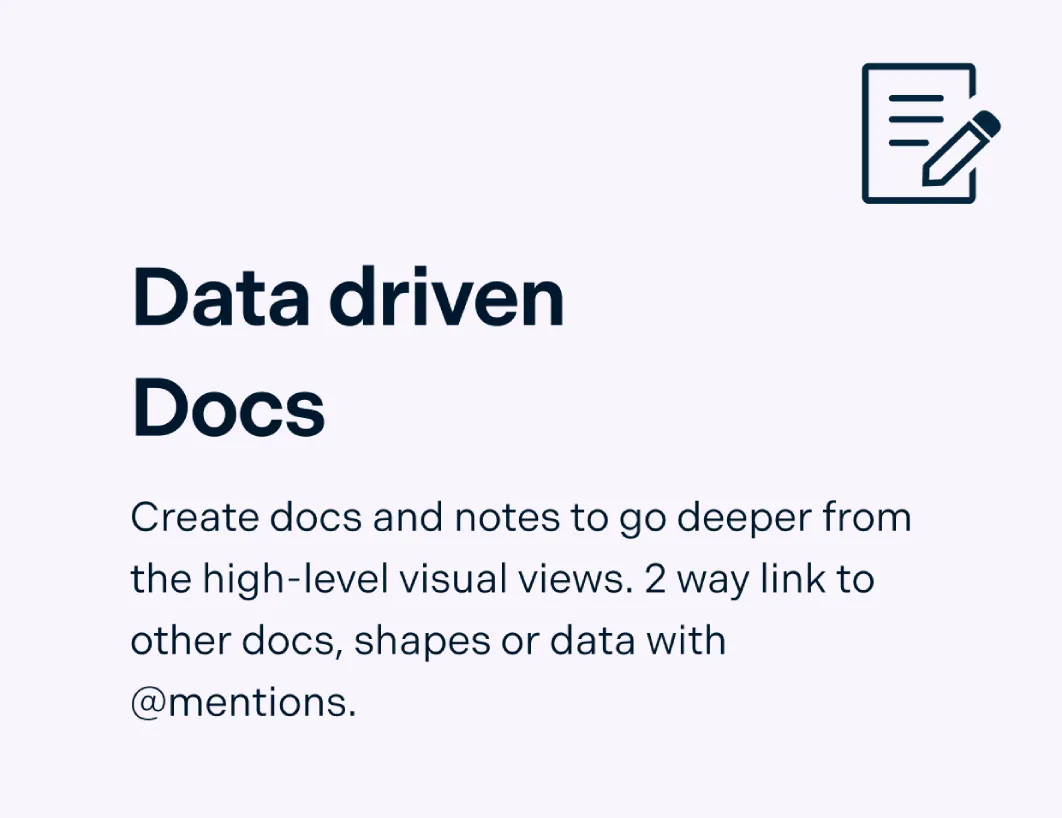
Centralize All Your Findings

Link shapes and workspaces to related diagrams like family trees, skill trees and more.
Import images, vectors, and more into the canvas to create a more holistic view of different cultures and relationships.
Embed documents and reference links to specific research insight, papers and studies right on the canvas.
Export with high-quality formats such as SVG, PNG, JPEG, or PDF.
What is a Kinship Diagram Maker?

How to Make a Kinship Chart with Creately’s Kinship Diagram Maker?
Select a New Kinship Diagram Template
Launch Creately, create a new workspace, and choose a Kinship Diagram template from the library. Add quick context in the Notes Panel or with sticky notes (e.g., culture/society, research goals), and attach any interview notes or source docs for reference.
Add Family Members & Details
Use Drag and drop shapes in the kinship diagram maker to add people—circles for females, squares for males. Click each shape to enter names and other details (age, role, notes). Arrange generations top-to-bottom so older generations sit higher on the canvas.
Map Relationships
Use connectors to draw horizontal lines for marriages/unions and vertical lines for parent–child relationships. Add annotations where needed (e.g., descent rules, residence patterns) and expand the chart by adding extended relatives as your research requires.
Customize the Diagram
Improve readability with colors, fonts, and styles. The kinship chart generator lets you color-code by lineage, clan, or generation and add a small legend/key. Adjust spacing and alignment so relationships are easy to scan at a glance.
Review, Update & Share
Invite collaborators for real-time feedback using comments and mentions, then refine based on input. Share via a secure link with view/edit permissions, or export your kinship chart as PNG, PDF, SVG, or JPEG for printing, publishing, or presentations.
Free Editable Kinship Diagram Templates
FAQs About the Kinship Diagram Maker in Creately
Who can use a kinship diagram?
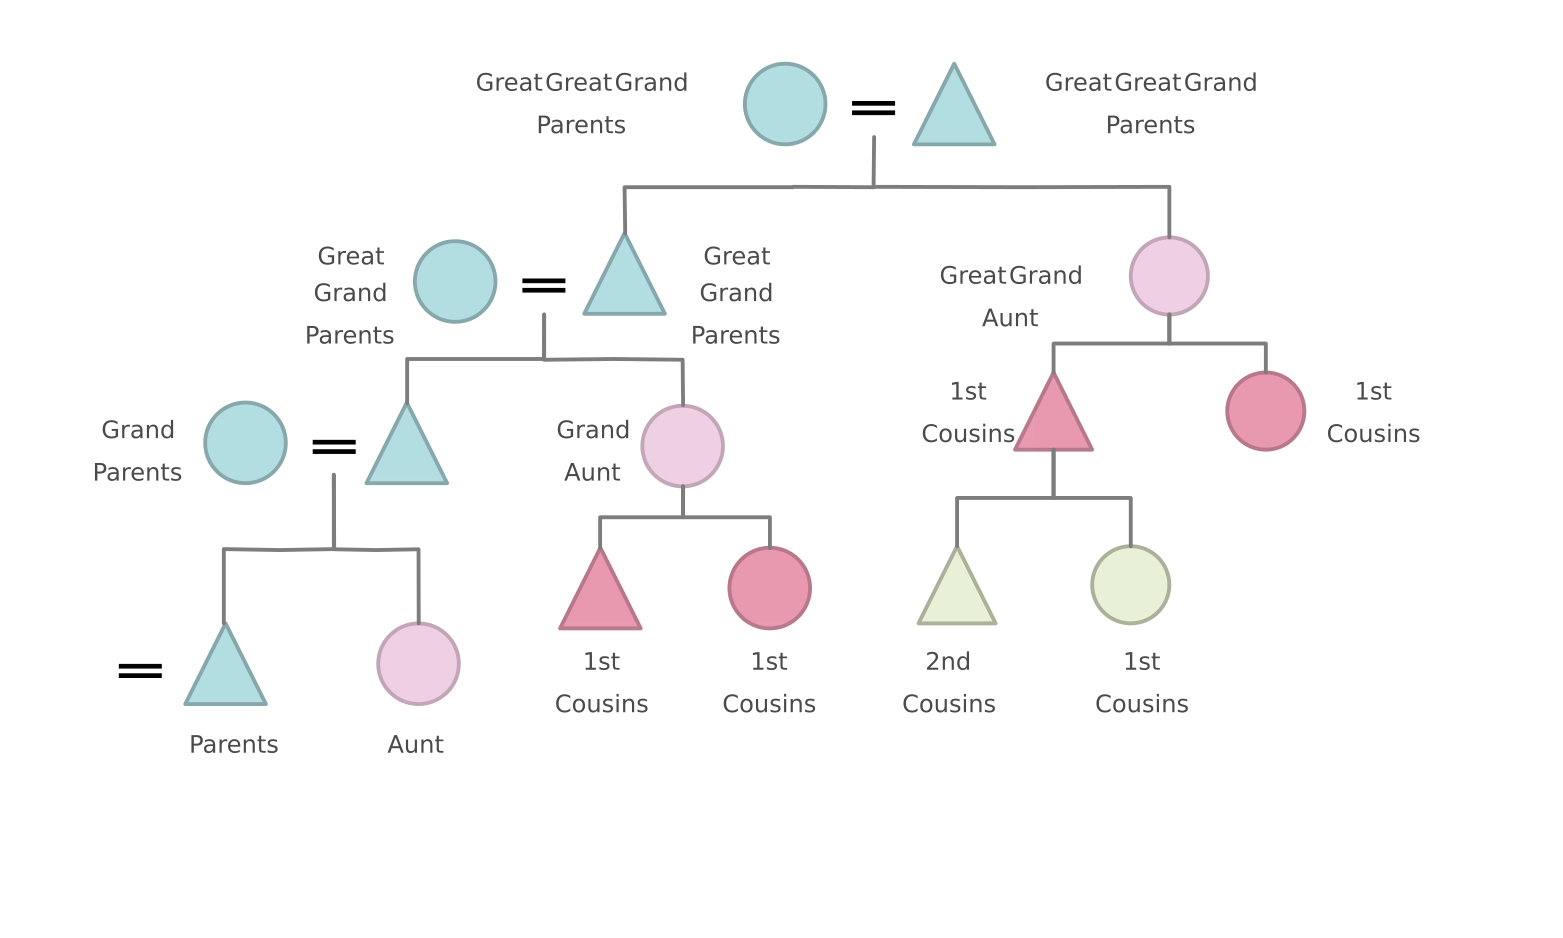
What are the key kinship diagram symbols?
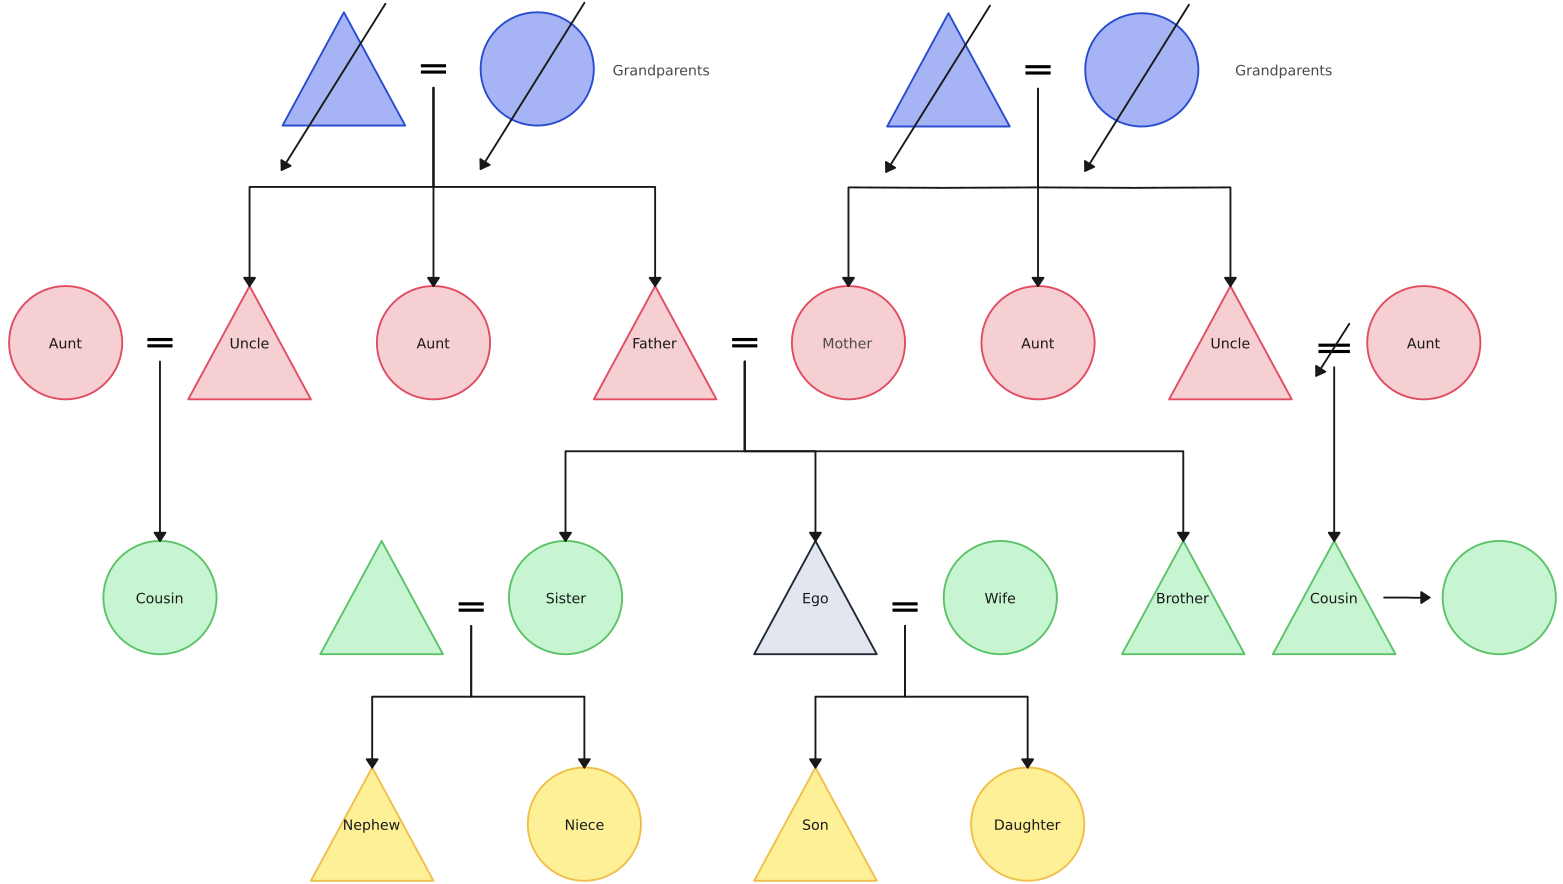
In a kinship diagram, various symbols represent different types of individuals and relationships. Here are the key symbols commonly used:
- Circles: Represent females.
- Tirangle: Represent males.
- Horizontal Lines: Indicate marriages or partnerships between individuals.
- Vertical Lines: Connect parents to their children, showing parent-child relationships.
- Diamonds: Sometimes used to represent individuals whose gender is not specified or to denote a non-binary person.
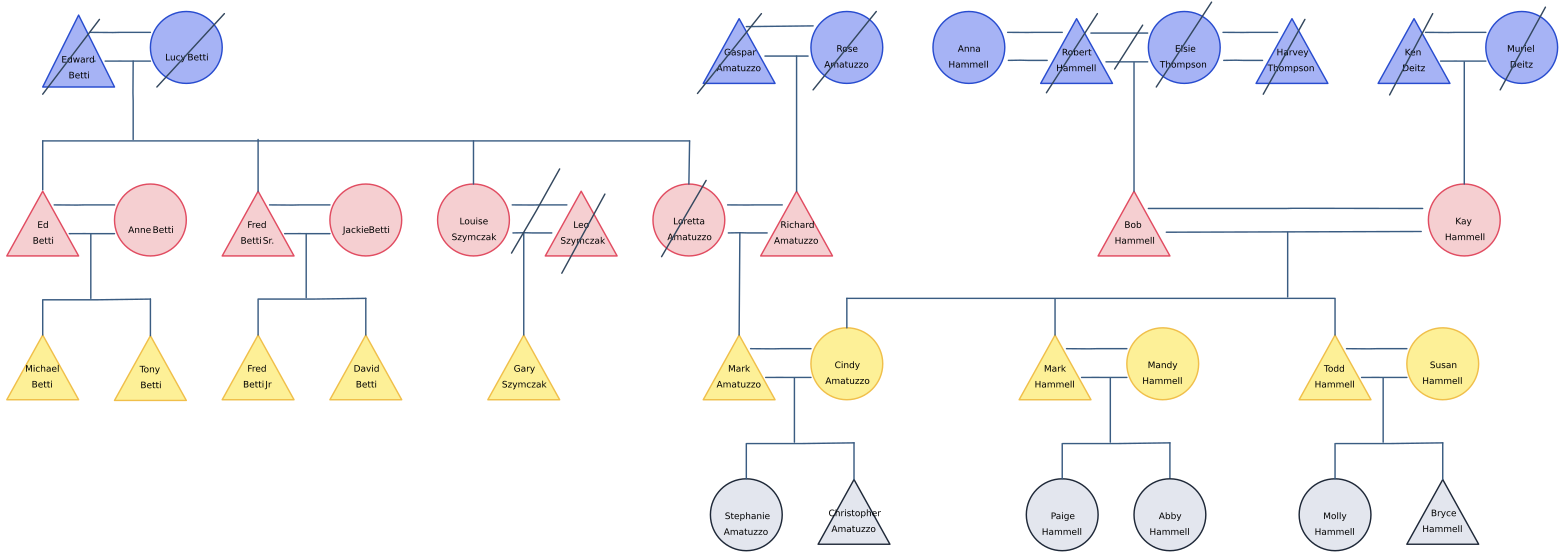
- Double Lines: Indicate a marriage or relationship that involves a divorce or separation.
- Dashed Lines: Often represent informal relationships or adopted relationships.
- Shaded Shapes: May be used to indicate individuals with specific traits or conditions, such as a particular health issue or role within the family.
- Brackets: Group family members together, such as siblings or extended family units.
What is a sample use case that illustrates how I can use a kinship diagram?
What is the Difference Between Family Trees, Genograms and Kinship Diagrams?
Family trees, genograms, and kinship diagrams are tools used to visualize family relationships. Each tool caters to different needs, from genealogical research to understanding family patterns and social networks.
- Family tree: focuses on direct lineage, showing ancestors and descendants in a simple branching format.
- Genogram: provides a detailed view, including information on health, behaviors, and relationships, using symbols and lines to represent various aspects of family dynamics.
- Kinship diagram: illustrates a wider range of relationships, including extended family and social connections, using flexible structures to explore complex familial and social ties.
What are some key tips that I should know before diving into interviews with informants?
The creation of kinship diagrams rely on people. Therefore, to gather the necessary information you will have to talk to family members, patriarchs, matriarchs and many others who will be your informants. It is best to conduct these informant interviews in-person and you should always keep a note taking tool within reach to quickly sketch and visualize.
With Creately’s kinship diagram maker, you can meet your informants anywhere, anytime. You can interview them and draw the diagram at the same time. Make use of the freehand drawing and whiteboarding capabilities to note down information, sketch as you interview and much more.
How can I customize a kinship diagram in Creately’s Kinship diagram maker?
How can I get started in making a kinship diagram in Creately’s Kinship diagram maker?