Euler Diagram Generator
Create and Customize Professional Euler Diagrams Online
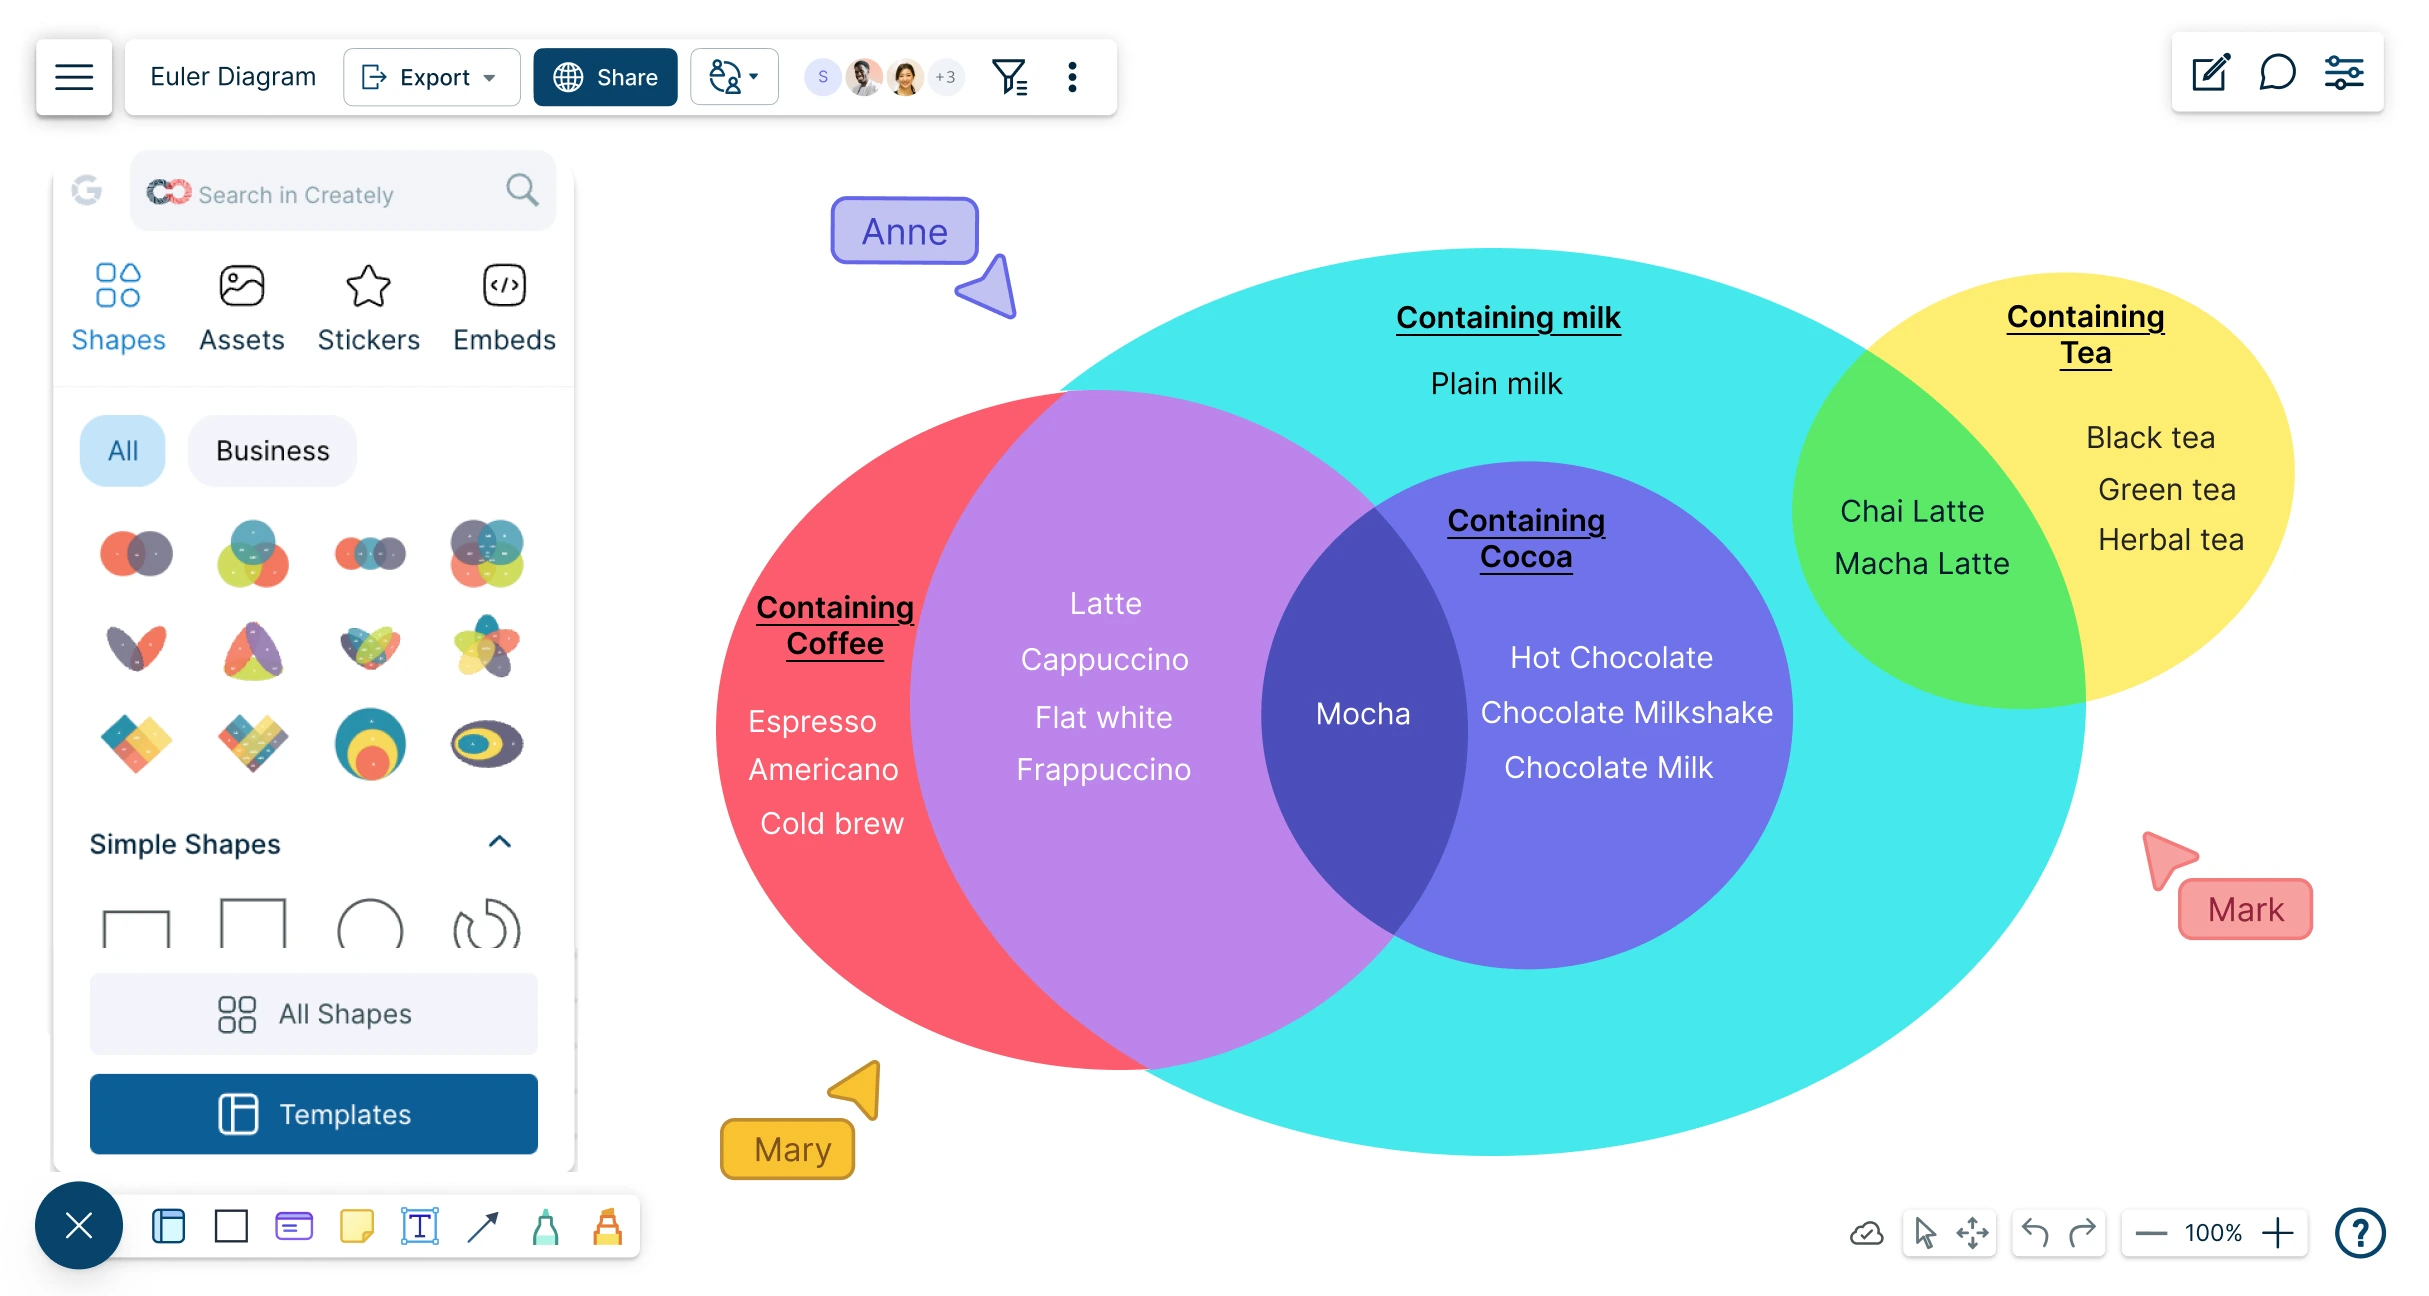
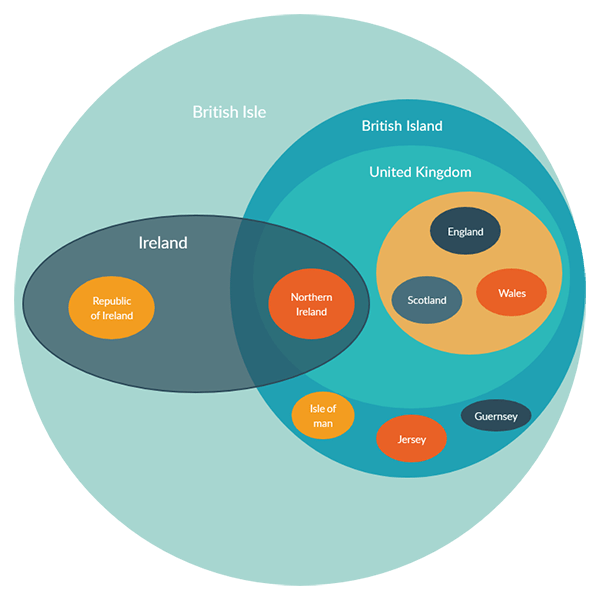
Easily design Euler diagrams to identify relationships between groups and sets. Our powerful online Euler diagram generator lets you visualize overlaps, concepts, and connections with accuracy and ease.
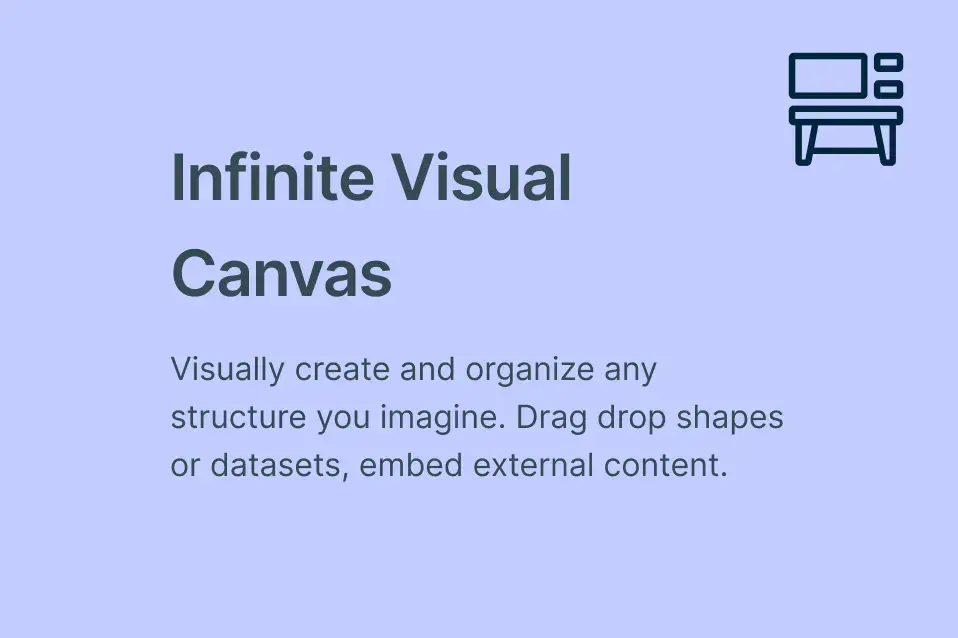
Intuitive visual tools to map relationships between groups & sets.
Ready-to-use Euler diagram templates for quick creation
Customizable colors and styles in our Euler diagram generator


 Diagramming Visual Collaboration Org Chart


How to Make an Euler Diagram?
Create Euler Diagrams Effortlessly with our Interactive Euler Diagram Generator

Access ready-made Euler diagram examples for multiple use cases.
Using custom color themes and fonts, highlight & label contours & zones in our Euler diagram creator.
Freehand tool to draw non-convex contours for complex Euler diagrams.
Import or drag-drop images, graphics, etc., to create visually dynamic Euler diagrams with our customizable Euler diagram generator.

Enhance Your Euler Diagrams with Notes, Links, and Multimedia
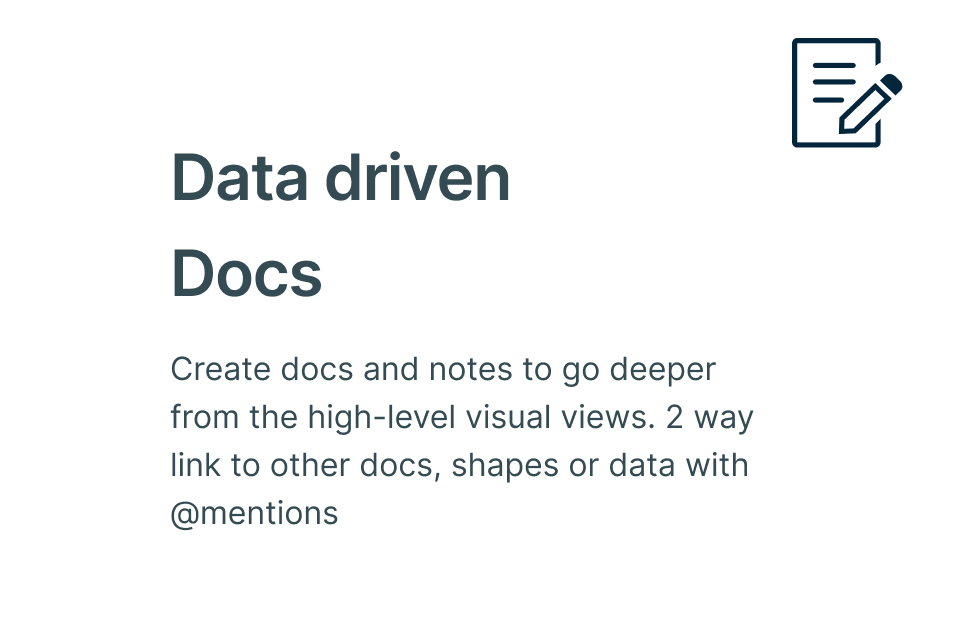
Add more information (links, documents, and multimedia) on various zones with integrated notes.
Access 50+ diagram types and various shape libraries to combine Euler diagrams with other visuals.
Turn Euler diagrams into interactive presentations with frames and view mode.
Collaborate with Others, Anytime, Anywhere Using Our Euler Diagram Maker

Real-time multi-cursor collaboration to work with students or colleagues on a shared canvas.
Comment with context to have discussions & follow-ups on the same canvas. Async!
Use @mentions and contextual comments for clear, focused discussions.
Offline sync to keep your work always synced.
Export your diagrams in multiple image formats (JPEG, SVG, PNG, etc.) for embedding, printing, or sharing.
What Is an Euler Diagram?

How to Create an Euler Diagram Easily Using Creately’s Euler Diagram Maker
Launch Creately
Launch Creately and sign in to open a new workspace in the Euler diagram maker. Invite collaborators with edit access for seamless real-time teamwork using multi-cursors and synced previews.
Choose an Euler Diagram Template and Shapes
Select from our Euler and Venn diagram templates or enable the basic shape library. Drag and drop circles or relevant shapes to represent your groups on the canvas.
Connect and Customize Groups
Link overlapping shapes to visualize relationships between groups. Add labels, color-code areas, and highlight zones to clarify your diagram.
Add Context and Collaborate
Use notes, links, and multimedia to provide additional context. Collaborate with comments, @mentions, and access controls to gather feedback efficiently.
Finalize and Share
Once your diagram is complete, export it in multiple image formats for embedding, printing, or sharing with stakeholders.
Create an Euler DiagramCreate Euler Diagrams Faster with These Free Editable Templates


FAQs about the Euler Diagram Maker
What is an Euler diagram generator?
When to Use an Euler Diagram?
How to use Creately’s Euler diagram maker?
How can I share my Euler diagram with Creately’s Euler diagram maker?
What’s the difference between Euler diagrams and Venn diagrams?
How can Euler diagrams be used collaboratively with your team?
Euler diagrams enable collaborative teamwork by visually mapping relationships between ideas, tasks, and data.
- Brainstorming and Idea Generation: Use Euler diagrams to visualize connections between concepts and stakeholders, identifying common ground and conflicts.
- Decision Making: Euler diagrams support team decisions with clear visual representations of options, outcomes, and relationships.
- Collaborative Planning: Use Euler diagrams to map tasks, resources, and dependencies to manage projects efficiently and uncover potential risks and opportunities.
- Communication and Information Sharing: Use Euler diagrams to visually display connections between data, ideas, and concepts. By simplifying complex information, Euler diagrams improve team communication and make it easier for groups to understand relationships and insights.