Efficient data management is essential for any university to streamline operations like student registration, course enrollment, faculty management, and more. This guide explores the top 10 ER diagrams designed for various university management functions, providing ready-to-use templates to help visualize and optimize database structures. Whether you’re an administrator, IT professional, or faculty member, these ER diagrams will help create a structured and scalable university system.
What Is an ER Diagram for a University Management System?
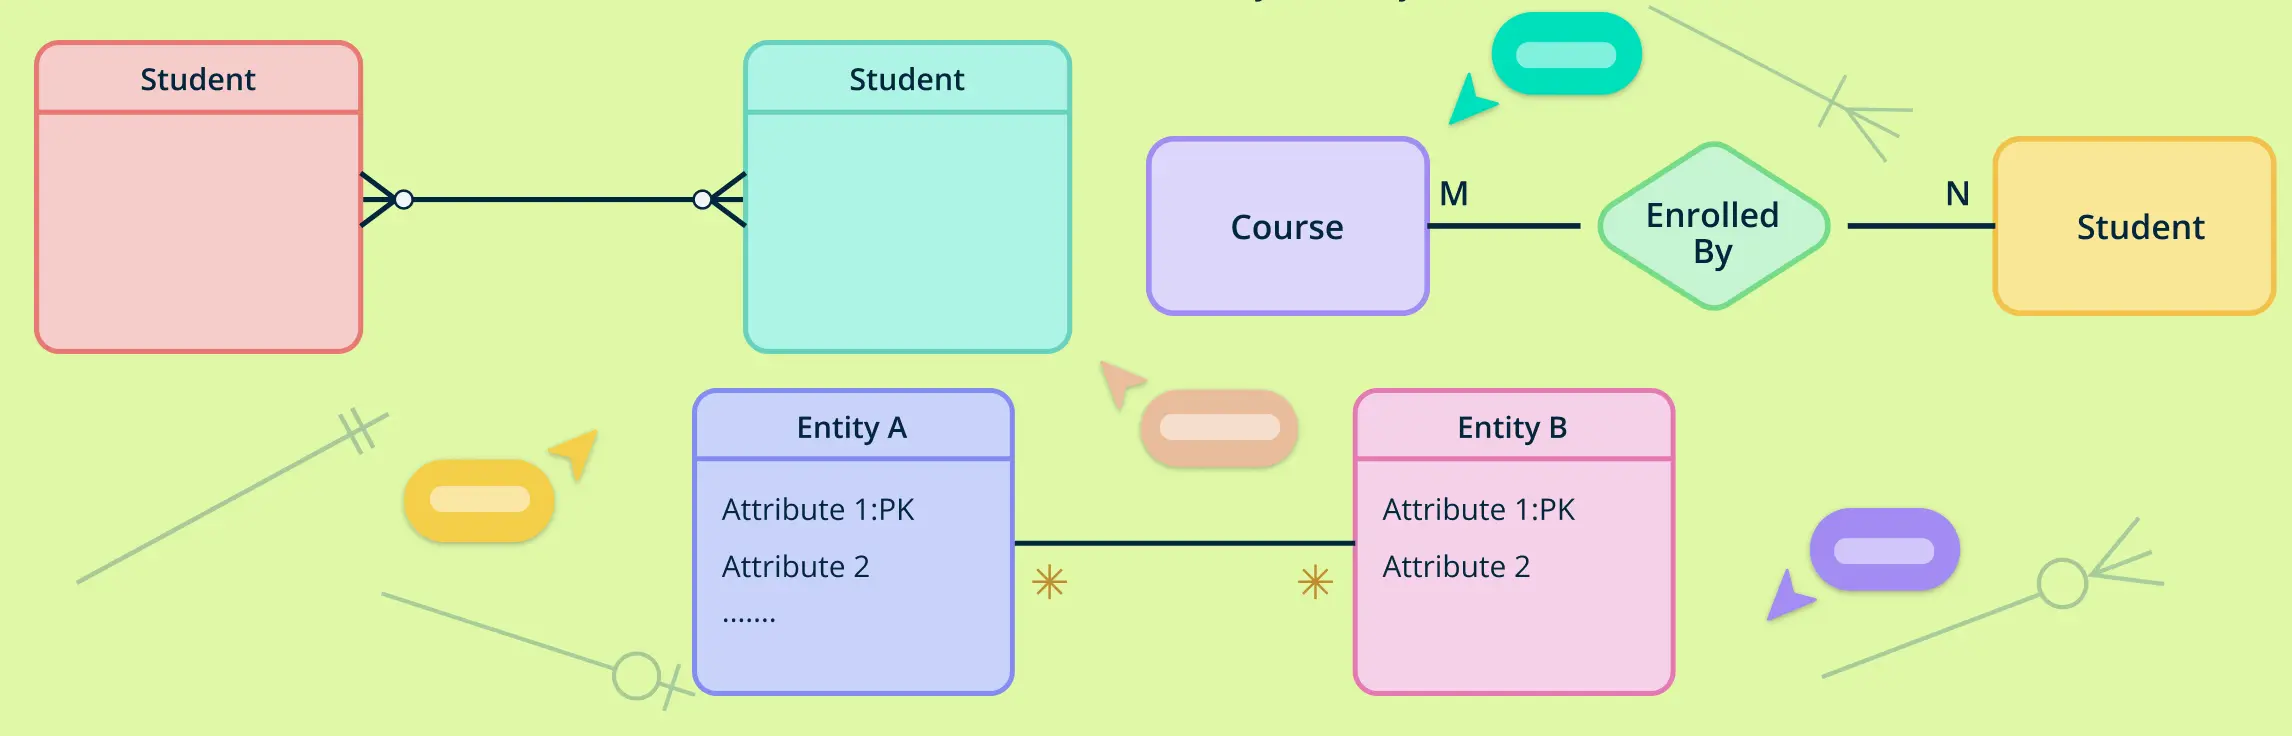
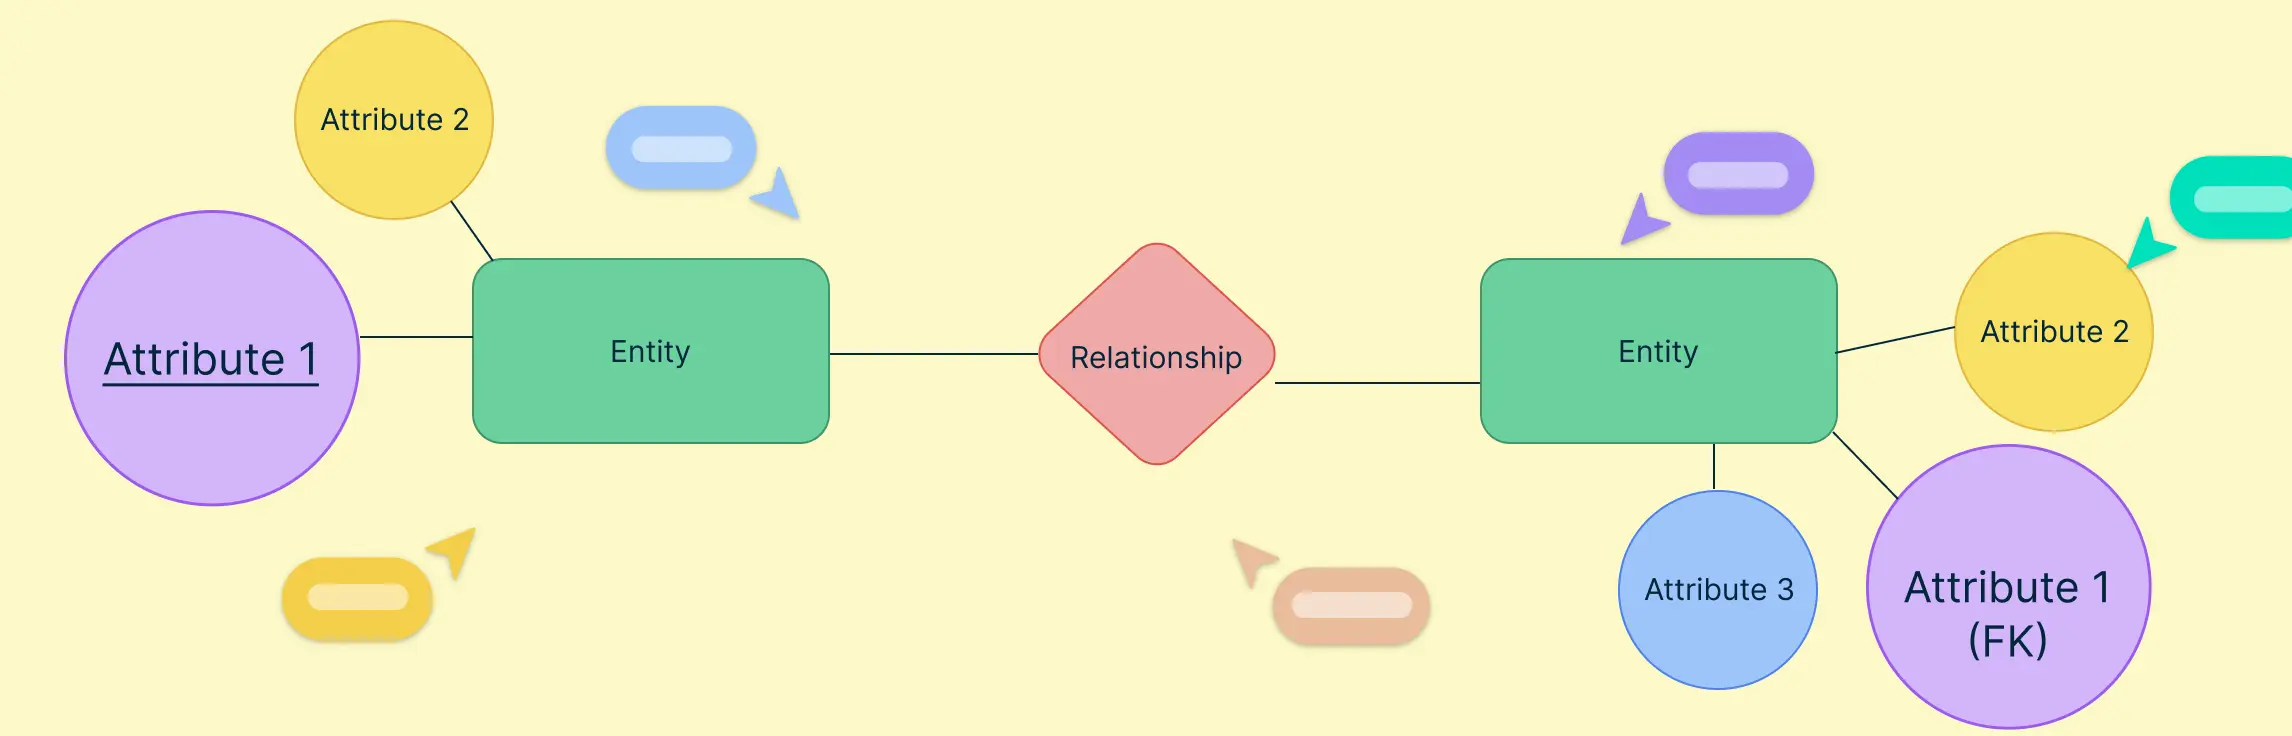
An ER diagram in system design is a graphical representation of entities and their relationships within a database system. It helps in planning and organizing data architecture, ensuring efficient data management and retrieval. By mapping out entities (such as students, courses, faculty, etc.) and their relationships, ER diagrams provide a blueprint for developing and maintaining robust university management systems.
1. ER Diagram for Student Registration System
Managing student registration efficiently is critical for any university. An ER diagram for the student registration system helps visualize how students, courses, and registrations are interconnected.
Example:
- Entities: Student, Course, Registration
- Relationships: Enrolls in, Offers
- Attributes: Student ID, Course Code, Registration Date


2. ER Diagram for Course Enrollment Management
Ensuring seamless course enrollment requires a well-structured database. An ER diagram for course enrollment management outlines how courses, students, prerequisites, and scheduling interact.
Example:
- Entities: Course, Student, Prerequisite, Schedule
- Relationships: Enrolls in, Requires, Scheduled at
- Attributes: Course ID, Student ID, Prerequisite ID, Schedule ID

3. ER Diagram for Faculty Management System
Efficient faculty management involves tracking faculty details, courses taught, research projects, and administrative roles. An ER diagram for faculty management clarifies these relationships.
Example:
- Entities: Faculty, Course, Research Project, Department
- Relationships: Teaches, Leads, Belongs to
- Attributes: Faculty ID, Course ID, Project ID, Department ID

4. ER Diagram for Library Management Integration
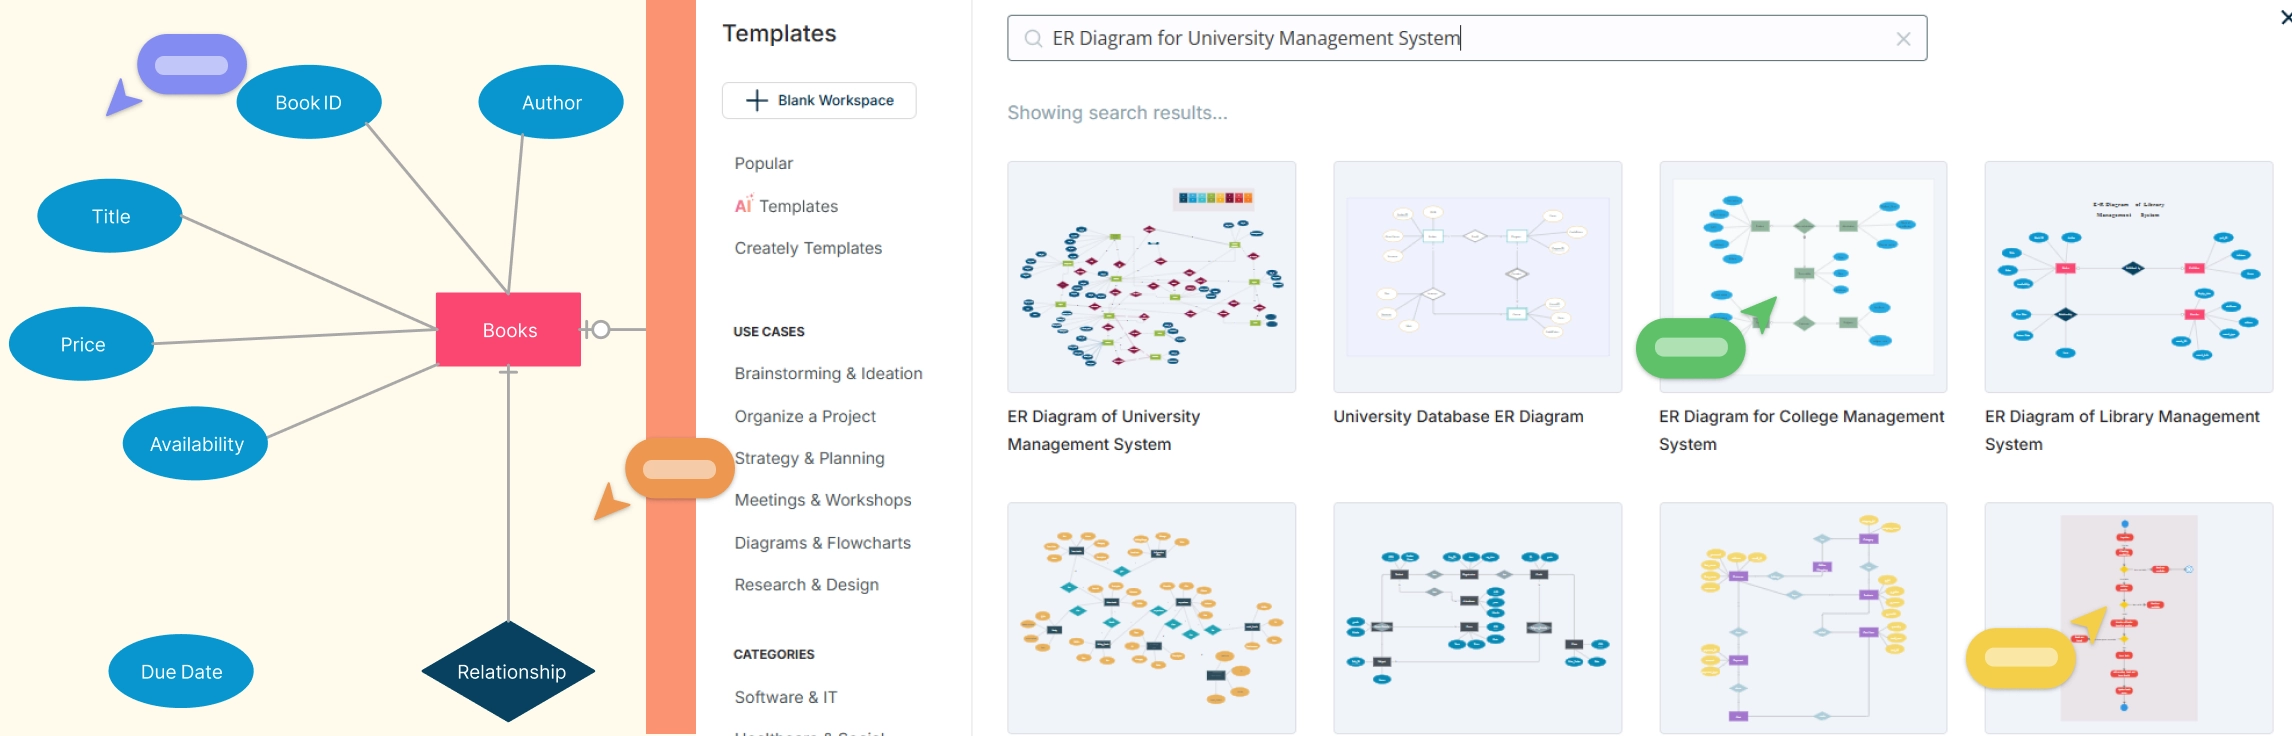
Integrating library resources with student and faculty needs requires careful database design. An ER diagram for library management integrates books, borrowers, transactions, and inventory.
Example
- Entities: Book, Student, Borrowing Record, Inventory
- Relationships: Borrows, Manages, Contains
- Attributes: Book ID, Student ID, Transaction ID, Inventory ID

5. ER Diagram for Exam Scheduling and Results
Managing exams and tracking results demands a robust database structure. An ER diagram for exam scheduling and results links exams, students, grades, and schedules.
Example:
- Entities: Exam, Student, Grade Report, Schedule
- Relationships: Takes, Scheduled for, Receives
- Attributes: Exam ID, Student ID, Grade Report ID, Schedule ID

6. ER Diagram for Financial Aid and Scholarship Management
Administering financial aid and scholarships efficiently requires detailed data management. An ER diagram for financial aid and scholarship management connects donors, recipients, funds, and eligibility criteria.
Example:
- Entities: Donor, Student, Fund, Eligibility Criteria
- Relationships: Donates to, Receives from, Manages
- Attributes: Donor ID, Student ID, Fund ID, Criteria ID

7. ER Diagram for Alumni Network Integration
Engaging alumni effectively involves tracking alumni activities, donations, events, and networking opportunities. An ER diagram for alumni network integration links alumni, events, donations, and networking platforms.
Example:
- Entities: Alumni, Event, Donation, Network Platform
- Relationships: Attends, Donates to, Connects on
- Attributes: Alumni ID, Event ID, Donation ID, Platform ID

8. ER Diagram for Campus Facilities Management
Maintaining campus facilities and resources necessitates organized database architecture. An ER diagram for campus facilities management maps facilities, maintenance schedules, staff assignments, and resource allocation.
Example:
- Entities: Facility, Maintenance Schedule, Staff, Resource
- Relationships: Requires, Assigned to, Manages
- Attributes: Facility ID, Schedule ID, Staff ID, Resource ID

9. ER Diagram for Online Learning Platform Integration
Integrating online learning platforms with course content, assessments, and student progress demands a well-structured database. An ER diagram for online learning platform integration connects courses, content, assessments, and student records.
Example:
- Entities: Course, Content Module, Assessment, Student Record
- Relationships: Includes, Assesses, Records
- Attributes: Course ID, Module ID, Assessment ID, Record ID

10. ER Diagram for Data Analytics and Reporting
Analyzing data for insights and reporting requires a clear data architecture. An ER diagram for data analytics and reporting links data sources, analytics tools, reports, and stakeholders.
Example:
- Entities: Data Source, Analytics Tool, Report, Stakeholder
- Relationships: Sources from, Analyzes with, Reports to
- Attributes: Source ID, Tool ID, Report ID, Stakeholder ID

The Role of ER Diagrams in University System Design
For university administrators, faculty members, and IT teams, managing a university’s operations efficiently is a complex challenge. A university management system involves numerous interconnected processes, including student registrations, course enrollments, faculty management, library integration, and more. Without a well-structured database, managing these operations can be chaotic and inefficient. ER diagrams help:
Streamline data management by visually representing relationships between key entities.
Reduce redundancy through structured entity definitions, ensuring accurate record-keeping.
Improve decision-making by enabling quick insights into university processes, allowing administrators to optimize workflows.
Facilitate integration with other management systems such as online learning platforms, financial aid management, and student portals.
Enhance collaboration by providing a clear visual representation for IT teams, faculty, and administrators to work together efficiently.
By using ER diagrams, university stakeholders can ensure a structured and scalable approach to data management, improving overall institutional efficiency
Simplify University System Design with Creately’s ER Diagram Tools
Creately offers an intuitive platform to design, edit, and share ER diagrams effortlessly. With its powerful features, university administrators, IT teams, and faculty members can collaborate seamlessly to optimize data management. Key capabilities include:
Drag-and-drop ER diagramming with an extensive shape library for faster diagram creation.
Real-time collaboration with faculty and IT teams, enabling multiple users to edit and provide input simultaneously.
Sticky notes and annotations to document key insights and maintain clarity within complex ER models.
Data integration with existing university systems, allowing synchronization of information across platforms.
Presentation mode for showcasing ER diagrams in meetings and strategy discussions without needing third-party tools.
Voting and feedback mechanisms to gather inputs from stakeholders before finalizing the database structure.
Multiple export formats (PDF, PNG, SVG) to easily incorporate diagrams into reports, documentation, and presentations.
With Creately, universities can ensure an efficient, visually structured, and collaborative approach to database management, making administrative processes more seamless and effective.
Conclusion
ER diagrams are crucial in designing organized and efficient university management systems, reducing redundancy, improving decision-making, and enhancing collaboration. With tools like Creately, universities can simplify complex data structures, integrate various operations, and optimize workflows for a seamless administrative experience.