Japan’s postwar quality movement helped shape modern quality management. Kaoru Ishikawa was one of its influential contributors, particularly through his work on company-wide quality control, quality circles, and practical problem-solving tools.
Postwar Japan underwent a major quality revolution. Companies were focused on training their employees in statistical quality control. But soon they realized that the complexity of the subject itself could intimidate most of the workers; so they wanted more basic tools.
Ishikawa emphasized a set of graphical tools that employees could learn without advanced statistical training. These became known as the seven basic quality tools and remain widely used to understand processes, organize data, investigate possible causes, and prioritize improvement work.
This post will describe the 7 basic quality tools, how to use them and give you access to templates that you can use right away.
Quality Tools: What Are They?
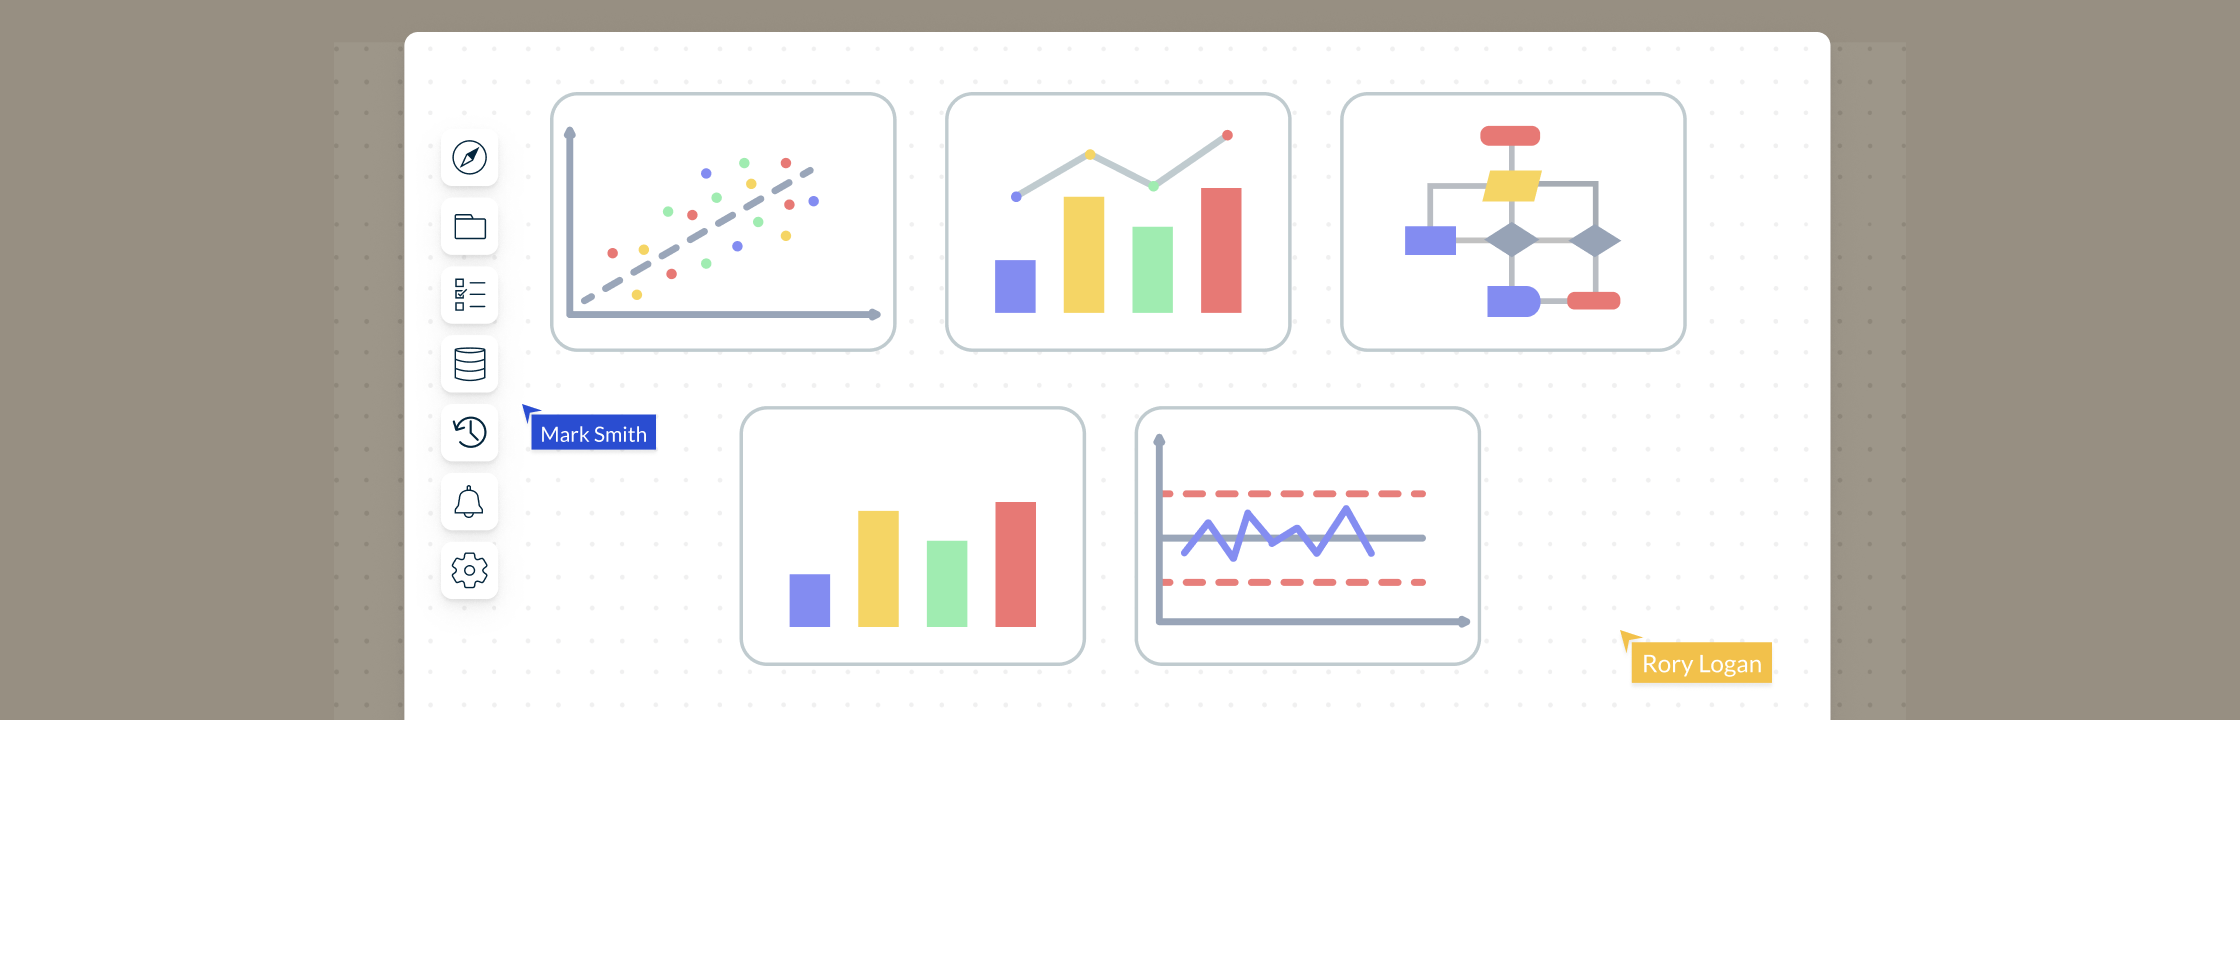
The seven basic tools of quality, also called the seven QC tools, are graphical techniques used to understand and improve quality-related processes. Recognized lists vary slightly: classic lists include stratification, while many current lists use a flowchart or, in some cases, a run chart as the seventh tool.
They are called basic quality tools because they can be easily learned by anyone even without any formal training in statistics. Dr. Kaoru Ishikawa played the leading role in the development and advocacy of using the 7 quality tools in organizations for problem-solving and process improvement.
This guide uses the following seven-tool set:
- Flowchart
- Histogram
- Cause-and-effect diagram
- Scatter diagram
- Check sheet
- Control chart
- Pareto chart
Kaoru Ishikawa highlighted the seven tools in his Guide to Quality Control and advocated their use in company-wide problem-solving. Their accessible visual formats helped employees collect and interpret quality data without requiring advanced statistical expertise.
How Can Teams and Organizations Use the 7 Basic Quality Tools?
Quality tools are used to understand processes, collect and analyze data, investigate possible causes, prioritize problems, and monitor results. Creately’s Six Sigma tools and templates provide visual starting points for common quality-analysis activities. Teams can also use Creately’s process mapping software to keep process maps, quality diagrams, supporting notes, and relevant files connected in a shared workspace. Real-time editing and contextual comments help operators, process owners, and reviewers examine findings together. The visual can then be updated as evidence or the process changes, while the organization’s operational system remains the source of record for executing corrective actions where applicable.
- Structured approach: They provide a systematic approach to problem-solving and process improvement, ensuring that efforts are well-organized and focused.
- Data-driven decision making: The tools enable data collection, analysis, and visualization, empowering teams to make informed decisions based on evidence.
- Improved communication and collaboration: Visual representations and structured tools facilitate effective communication and collaboration among team members, leading to shared understanding and alignment.
- Problem identification and prioritization: The tools help identify and prioritize problems or improvement opportunities, enabling teams to allocate resources efficiently and address critical issues first.
- Continuous improvement: By using these tools, teams can establish a culture of continuous improvement, as they provide a framework for ongoing monitoring, analysis, and refinement of processes.
7 Basic Quality Tools Explained with Templates
The 7 quality tools can be applied across any industry. They help teams and individuals analyze and interpret the data they gather and derive maximum information from it.
Flowchart
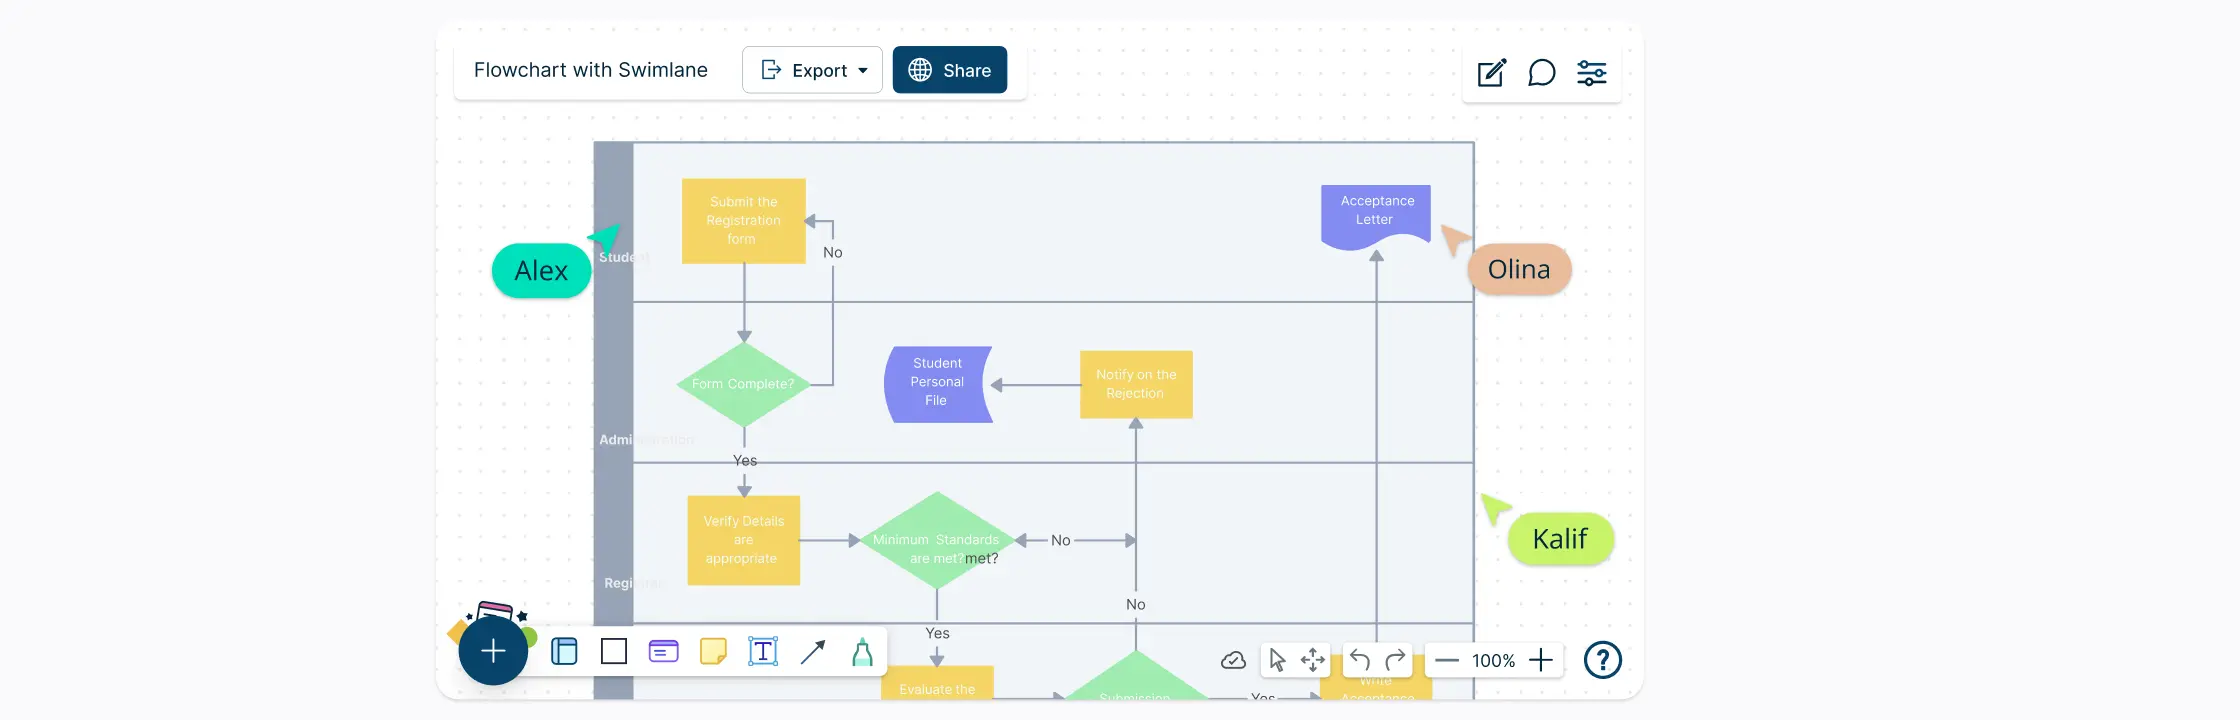
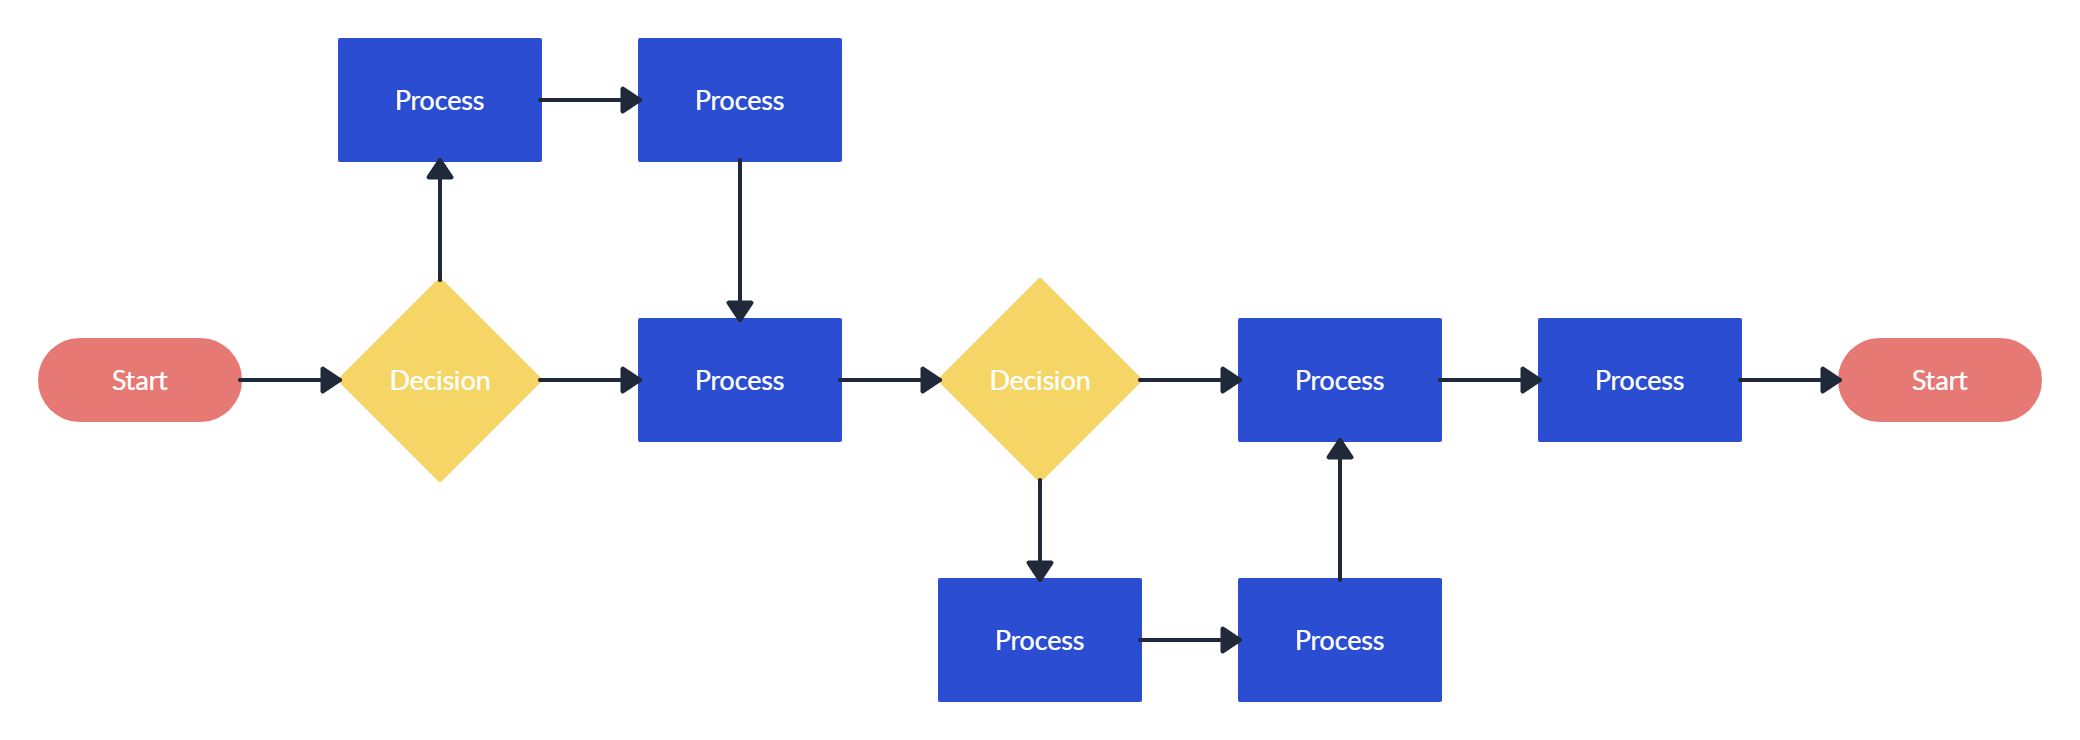
Flowcharts are perhaps the most popular out of the 7 quality tools. This tool is used to visualize the sequence of steps in a process, event, workflow, system, etc. In addition to showing the process as a whole, a flowchart also highlights the relationship between steps and the process boundaries (start and end).
Flowcharts use a standard set of symbols, and it’s important to standardize the use of these symbols so anyone can understand and use them easily. Here’s a roundup of all the key flowchart symbols.
Uses
- To build a common understanding of a process.
- To analyze processes and discover areas of issues, inefficiencies, blockers, etc.
- To standardize processes by leading everyone to follow the same steps.
Real-world examples of usage
- Documenting and analyzing the steps involved in a customer order fulfillment process.
- Mapping out the workflow of a software development lifecycle.
- Visualizing the process flow of patient admissions in a hospital.
Benefit
Enhances process understanding, highlights bottlenecks or inefficiencies, and supports process optimization and standardization efforts.
How to use a flowchart
- Gather a team of employees involved in carrying out the process for analyzing it.
- List down the steps involved in the process from its start to end.
- If you are using an online tool like Creately, you can first write down the process steps and rearrange them later on the canvas as you identify the flow.
- Identify the sequence of steps; when representing the flow with your flowchart, show it from left to right or from top to bottom.
- Connect the shapes with arrows to indicate the flow.
Who can use it?
- Process improvement teams mapping and documenting existing processes for analysis.
- Business analysts or consultants analyzing workflow and process optimization opportunities.
- Software developers or system designers documenting the flow of information or interactions in a system.
To learn more about flowcharts, refer to our Ultimate Flowchart Tutorial.
Histogram
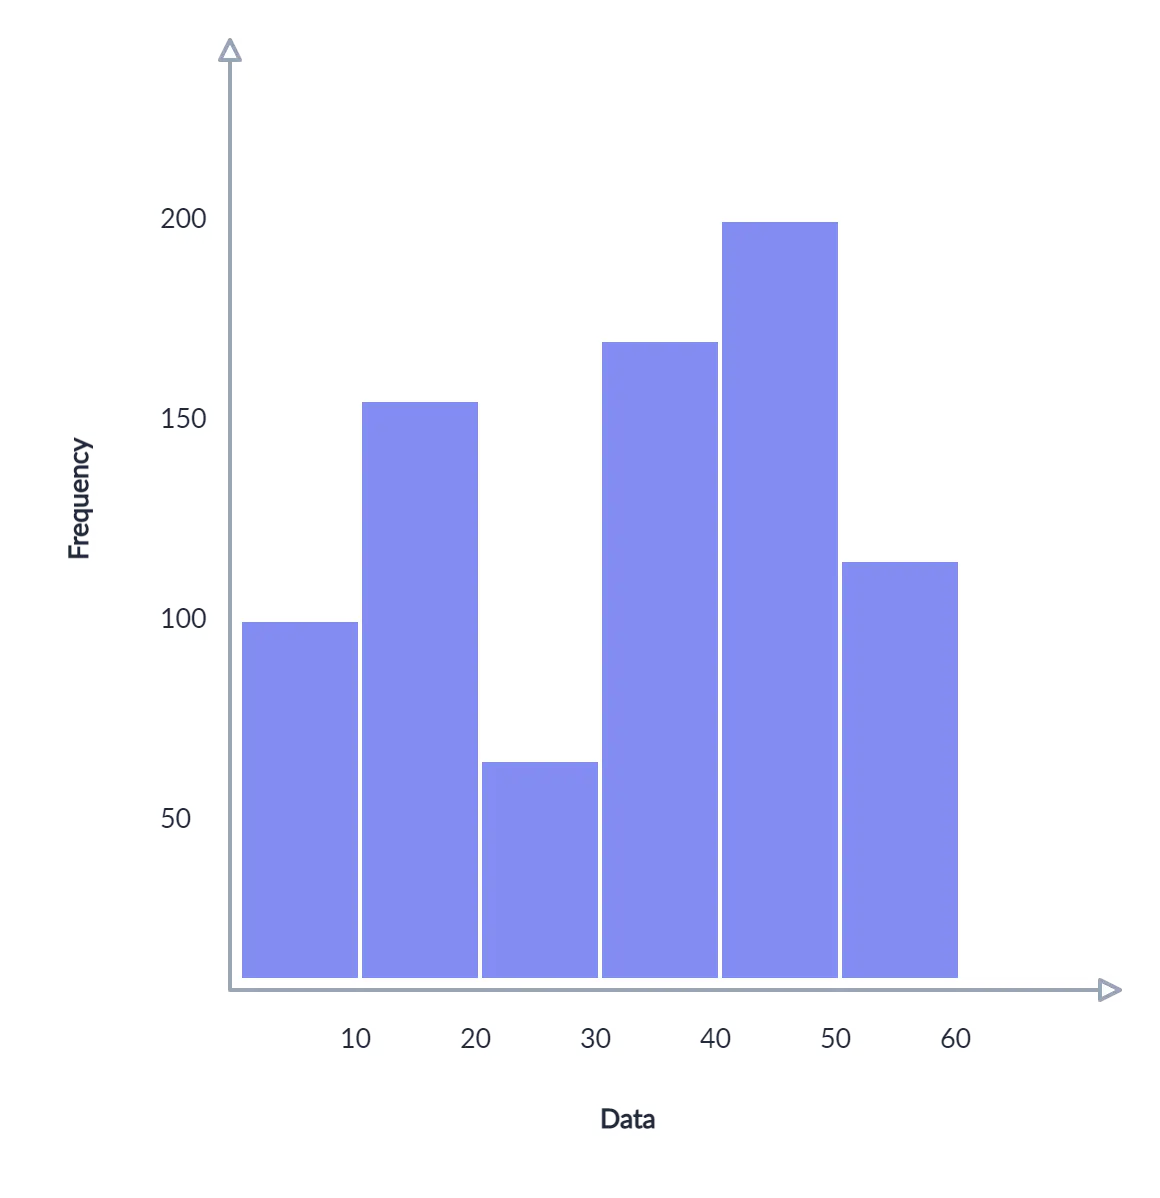
A histogram is a type of bar chart that visualizes the distribution of numerical data. It groups numbers into ranges and the height of the bar indicates how many fall into each range.
It is a quality analysis tool that helps teams understand the center, spread, shape, and variation of a numerical data set.
Uses
- To easily interpret a large amount of data and identify patterns.
- To assess the distribution and variation of process measurements.
- To identify patterns that may warrant further investigation with another quality tool.
Real-world examples of usage
- Analyzing the distribution of call wait times in a call center.
- Assessing the distribution of product weights in a manufacturing process.
- Examining the variation in delivery times for an e-commerce business.
Benefit
Provides insights into process performance and variation, enabling teams to target areas for improvement and make data-driven decisions.
How to make a histogram
- Collect data for analysis. Record occurrences of specific ranges using a tally chart.
- Analyze the data at hand and split the data into intervals or bins.
- Count how many values fall into each bin.
- On the graph, indicate the frequency of occurrences for each bin with the area (height) of the bar.
Who can use it?
- Process engineers or data analysts examining process performance metrics.
- Financial analysts analyzing expenditure patterns or budget variances.
- Supply chain managers assessing supplier performance or delivery times.
Here’s a useful article to learn more about using a histogram for quality improvement in more detail.
Cause and Effect Diagram
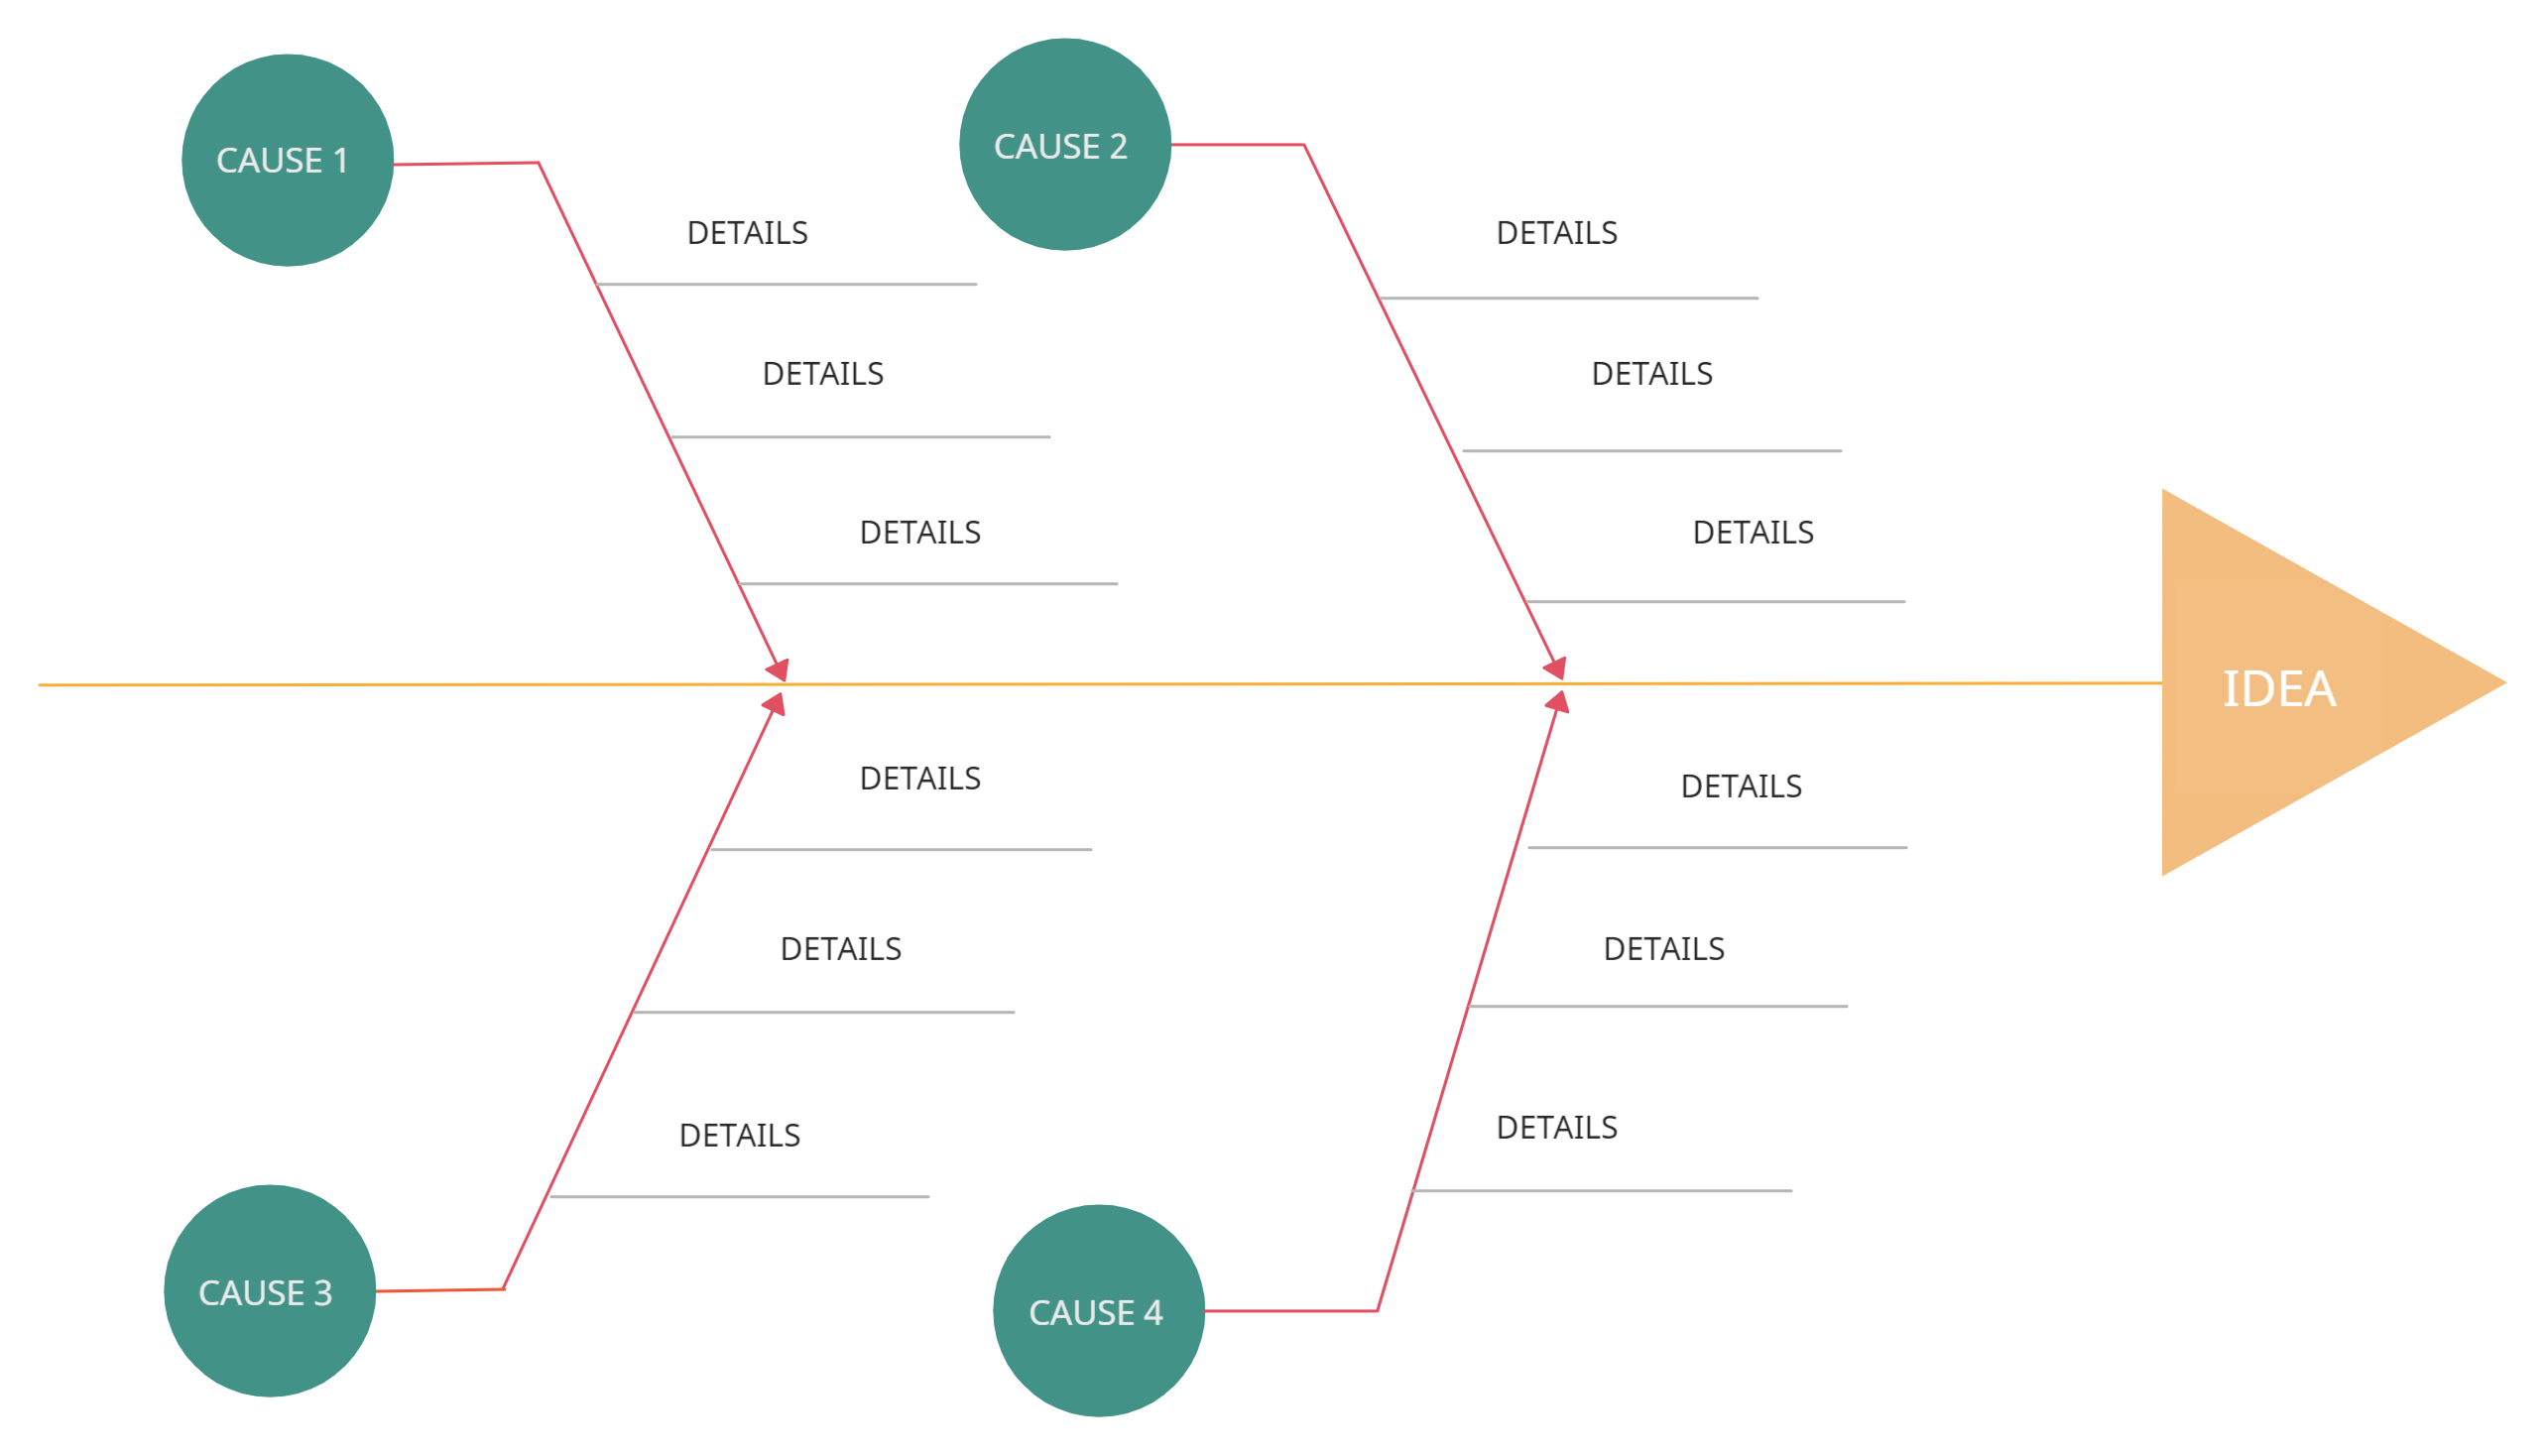
This tool was developed by Kaoru Ishikawa and is also known as the fishbone diagram because it is shaped like a fish skeleton, or as an Ishikawa diagram.
It helps teams organize possible factors that may contribute to an issue or effect. The diagram supports root cause investigation, but the proposed causes should be verified with evidence before the team selects a corrective action.
Uses
- Problem-solving; finding root causes of a problem.
- Uncovering the relationships between different causes leading to a problem.
- During group brainstorming sessions to gather different perspectives on the matter.
Real-world examples of usage
- Investigating the potential causes of low employee morale or high turnover rates.
- Analyzing the factors contributing to product defects in a manufacturing process.
- Identifying the root causes of customer complaints in a service industry.
Benefit
Enhances problem-solving by systematically identifying and organizing possible causes, allowing teams to address root causes rather than symptoms.
How to use the cause and effect diagram
- Identify the problem area that needs to be analyzed and write it down at the head of the diagram.
- Identify the main causes of the problem. These are the labels for the main branches of the fishbone diagram. These main categories can include methods, material, machinery, people, policies, procedures, etc.
- Identify plausible sub-causes of the main causes and attach them as sub-branches to the main branches.
- Referring to the diagram you have created, do a deeper investigation of the major and minor causes.
- Once you have identified the root cause, create an action plan outlining your strategy to overcome the problem.
Who can use it?
- Cross-functional improvement teams working on complex problems or process improvement projects.
- Quality engineers investigating the root causes of quality issues.
- Product designers or engineers seeking to understand the factors affecting product performance.
Scatter Diagram
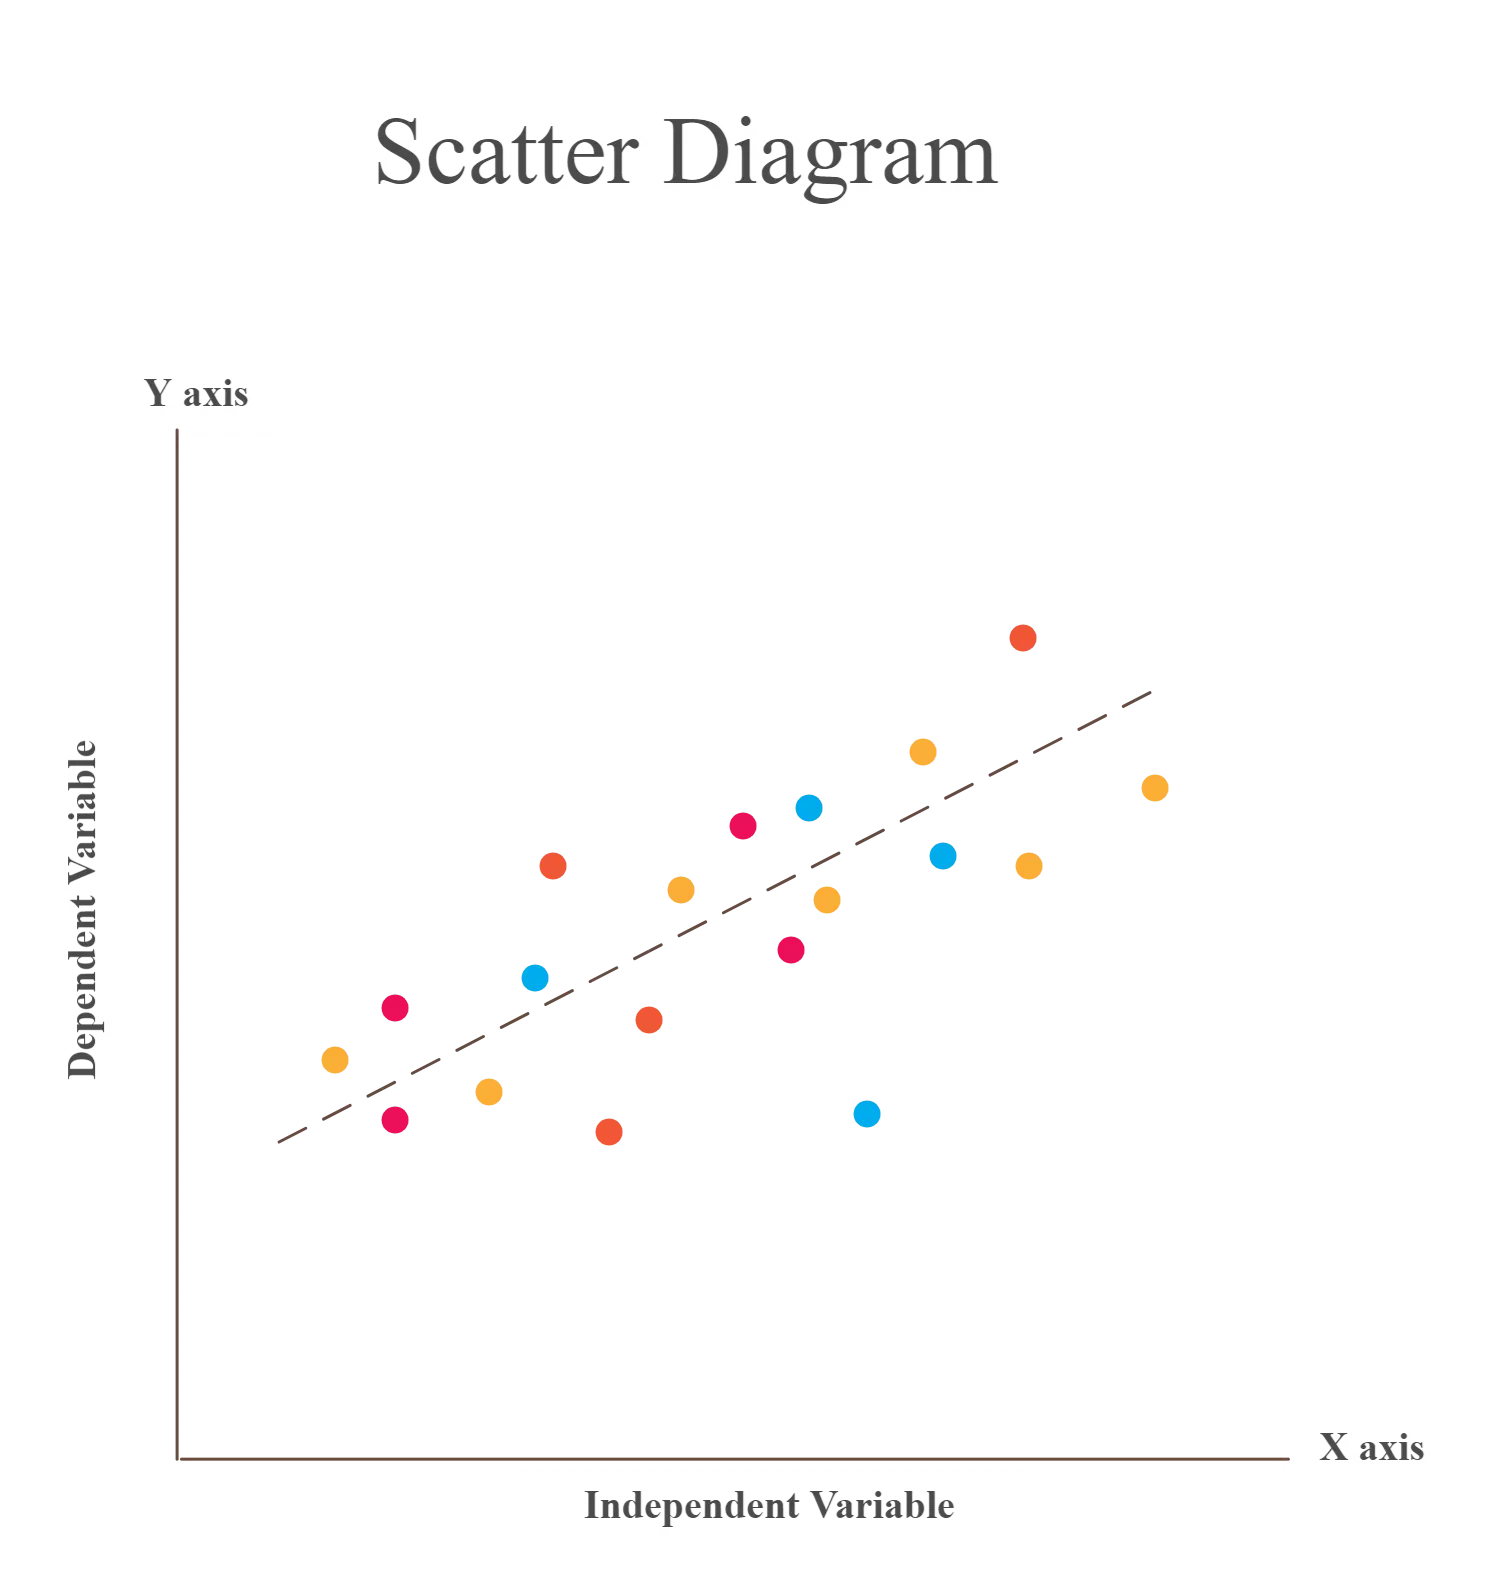
The scatter diagram (scatter charts, scatter plots, scattergrams, scatter graphs) is a chart that helps you identify how two variables are related.
The scatter diagram shows the values of the two variables plotted along the two axes of the graph. The pattern of the resulting points will reveal the correlation.
Uses
- To examine whether two variables may be related.
- To identify patterns that may help guide further investigation into poor performance.
- To assess the direction and strength of an observed relationship between variables.
Real-world examples of usage
- Exploring the relationship between advertising expenditure and sales revenue.
- Analyzing the correlation between employee training hours and performance metrics.
- Investigating the connection between temperature and product quality in a production line.
Benefit
Helps identify correlations or patterns between variables and guides further analysis. Correlation alone does not establish that one variable causes the other.
How to make a scatter diagram
- Collect paired observations for the two variables you want to compare.
- Plot the potential input or explanatory variable on the horizontal axis and the response variable on the vertical axis.
- Label both axes and plot each data pair. Add a trend line only when it is appropriate for the data and analysis.
- Examine the direction, form, strength, and unusual points in the pattern. Use an appropriate statistical measure when a numerical assessment of correlation is required.
Who can use it?
- Data analysts exploring relationships between variables in research or analytics projects.
- Manufacturing engineers investigating the correlation between process parameters and product quality.
- Sales or marketing teams analyzing the relationship between marketing efforts and sales performance.
Check Sheets
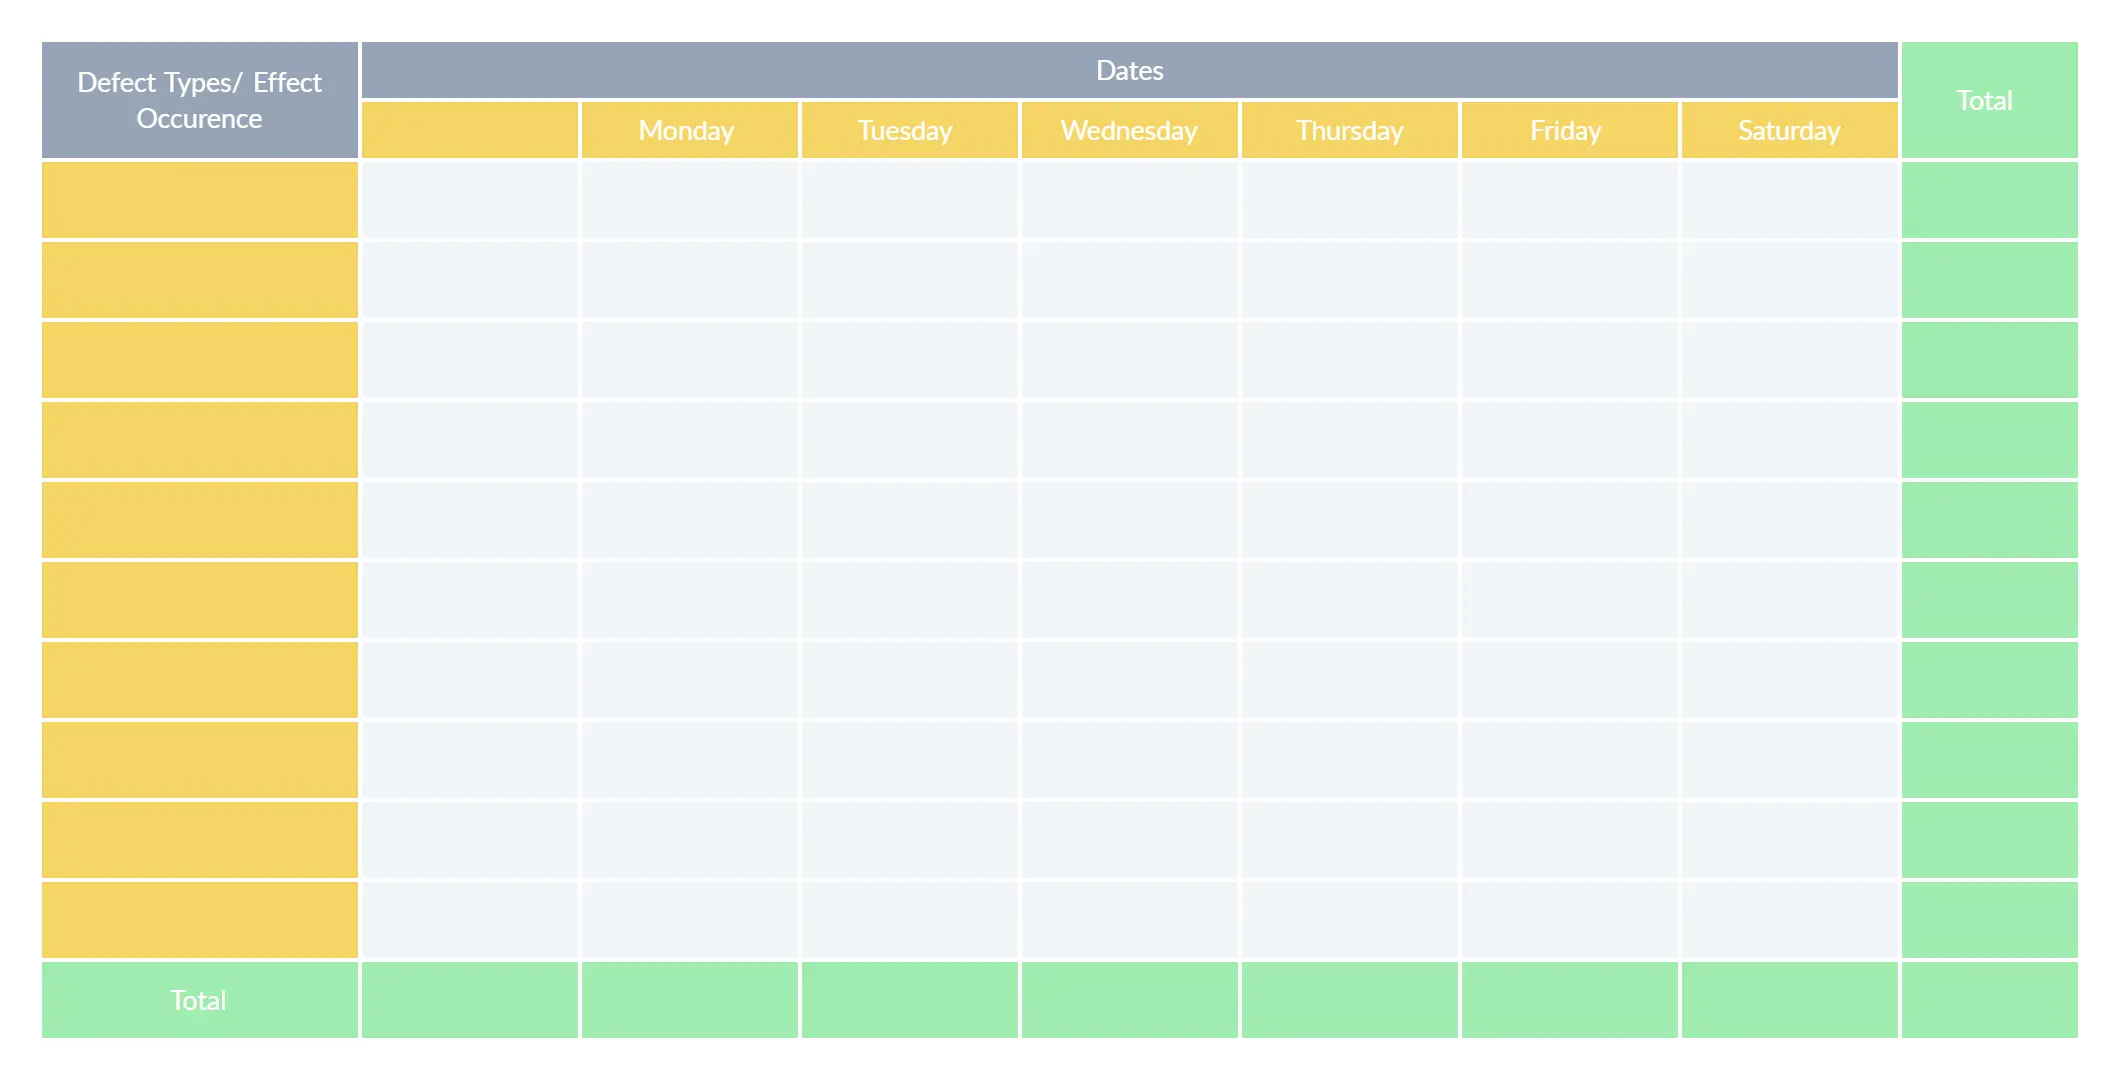
Check sheets provide a systematic way to collect, record and present quantitative and qualitative data about quality problems. A check sheet used to collect quantitative data is known as a tally sheet.
It is one of the most popular QC tools and it makes data gathering much simpler.
Uses
- To check the shape of the probability distribution of a process
- To quantify defects by type, by location or by cause
- To record how frequently defined events, defects, or conditions occur.
Real-world examples of usage
- Tracking the number of defects or errors in a manufacturing process.
- Recording customer complaints or inquiries to identify common issues.
- Monitoring the frequency of equipment breakdowns or maintenance needs.
Benefit
Provides a structured approach for data collection, making it easier to identify trends, patterns, and areas for improvement.
How to make a checksheet
- Identify the needed information.
- Why do you need to collect the data?
- What type of information should you collect?
- Where should you collect the data from?
- Who should collect the data?
- When should you collect the data?
- How should you measure the data?
- How much data is essential?
Construct your sheet based on the title, source information and content information (refer to the example below).
Test the sheets. Make sure that all the rows and columns in it are required and relevant and that the sheet is easy to refer to and use. Test it with other collectors and make adjustments based on feedback.
Who can use it?
- Quality inspectors or auditors who need to collect data on defects or issues.
- Process operators or technicians responsible for tracking process parameters or measurements.
- Customer service representatives who record customer complaints or inquiries.
Control Chart
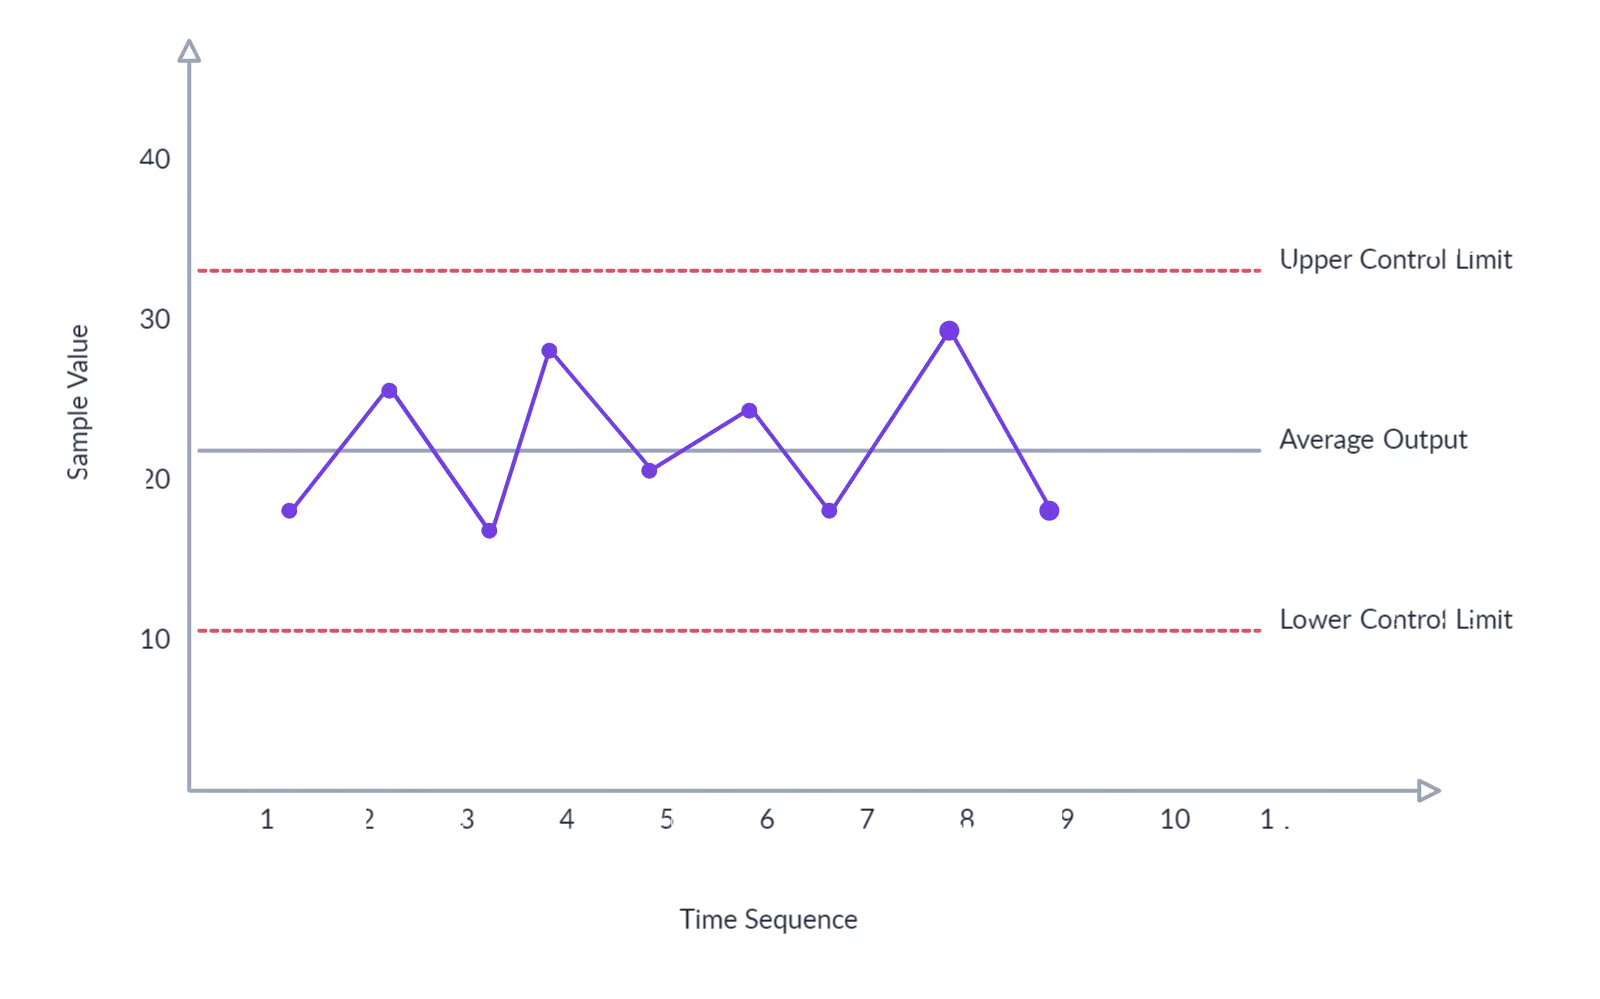
A control chart is a time-sequenced chart with a center line and statistically calculated upper and lower control limits. It is used to study process variation over time and identify signals associated with common or special causes.
The chart visualizes variation over time and helps determine whether a process appears statistically stable. Its control limits are calculated from process data and should not be confused with specification limits or customer requirements. Control charts can track measures such as defect rates, production time, or response time.
Control charts are used in manufacturing and service processes, including improvement approaches such as Six Sigma.
Uses
- To determine whether a process is stable.
- To monitor processes and learn how to improve poor performance.
- To recognize abnormal changes in a process.
Real-world examples of usage
- Monitoring the variation in product dimensions during a manufacturing process.
- Tracking the number of customer complaints received per day.
- Monitoring the average response time of a customer support team.
Benefit
Helps teams monitor process stability over time and distinguish common-cause variation from signals that warrant investigation.
How to create a control chart
- Gather data on the characteristic of interest.
- Calculate mean and upper/lower control limits.
- Create a graph and plot the collected data.
- Add lines representing the mean and control limits to the graph.
- Look for patterns, trends, or points beyond control limits.
- Determine if the process is in control or out of control.
- Investigate and address causes of out-of-control points.
- Regularly update the chart with new data and analyze for ongoing improvement.
Who can use it?
- Production supervisors or operators monitoring process performance on the shop floor.
- Quality control or assurance personnel tracking variation in product quality over time.
- Service managers observing customer satisfaction levels and service performance metrics.
Pareto Chart
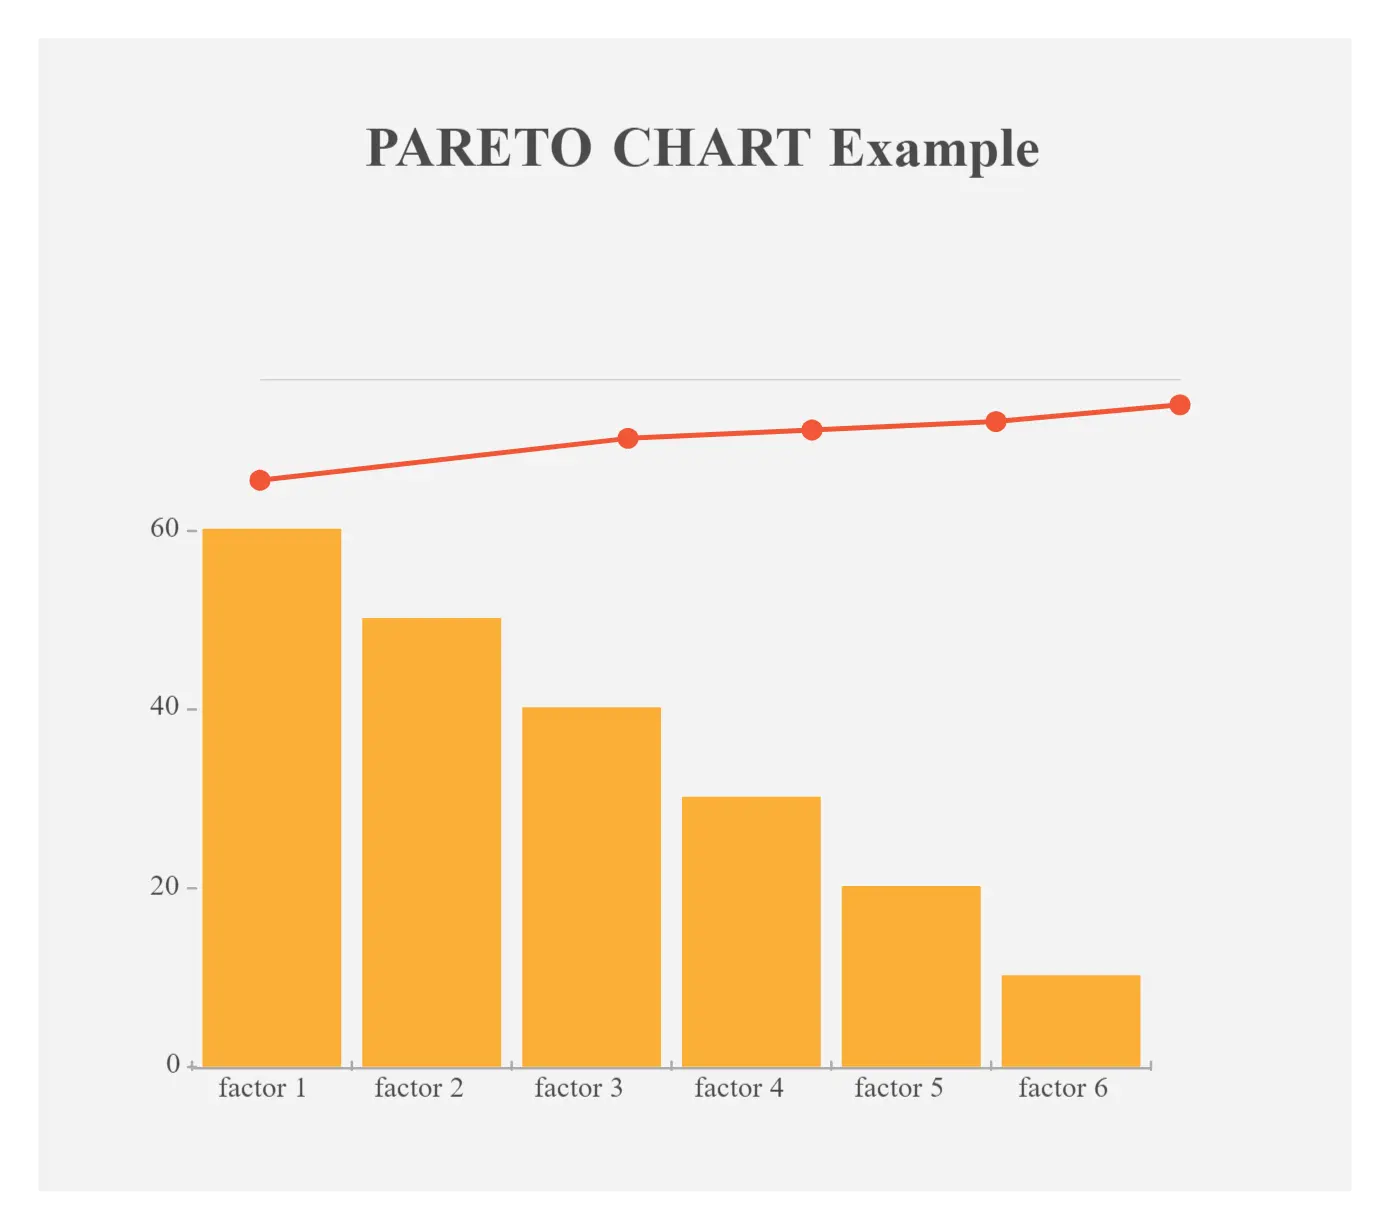
The Pareto chart is a combination of a bar graph and a line graph. It helps identify the facts needed to set priorities.
The Pareto chart organizes and presents information in such a way that makes it easier to understand the relative importance of various problems or causes of problems. It comes in the shape of a vertical bar chart and displays the defects in order (from the highest to the lowest) while the line graph shows the cumulative percentage of the defect.
Uses
- To identify the relative importance of the causes of a problem.
- To help teams prioritize the categories contributing most to a measured problem.
- To compare the frequency or magnitude of defect categories.
Real-world examples of usage
- Analyzing customer feedback to identify the most common product or service issues.
- Prioritizing improvement efforts based on the frequency of quality incidents.
- Identifying the major causes of delays in project management.
Benefit
Helps focus improvement efforts on the most significant factors or problems, leading to effective allocation of resources and improved outcomes.
How to create a Pareto chart
- Select the problem for investigation. Also, select a method and time for collecting information. If necessary create a check sheet for recording information.
- Once you have collected the data, go through them and sort them out to calculate the cumulative percentage.
- Draw the graph, bars, cumulative percentage line and add labels (refer to the example below).
- Analyze the chart to identify the categories contributing most to the measured outcome. The 80/20 rule is a prioritization principle, not a guarantee that every data set follows an exact 80/20 split. Investigate the leading categories before planning corrective action.
Who can use it?
- Quality managers or improvement teams looking to prioritize improvement initiatives.
- Project managers seeking to identify and address the most critical project risks.
- Sales or marketing teams analyzing customer feedback or product issues.
What’s Your Favorite Out of the 7 Basic Quality Tools?
You can use the seven basic quality tools individually or in combination to understand a process, examine data, investigate possible causes, and prioritize improvements. Select the tool that matches the question and the available data, involve people who understand the process, and verify findings before implementing a corrective action. Keep the resulting diagrams and evidence available for review so process owners can update the documentation as conditions change.