Causal Loop Diagram Template
Gain Clarity on Complex Systems
Use Causal Loop Diagram template to identify patterns, relationships, and feedback loops within complex systems. Understand how variables interact and impact each other.
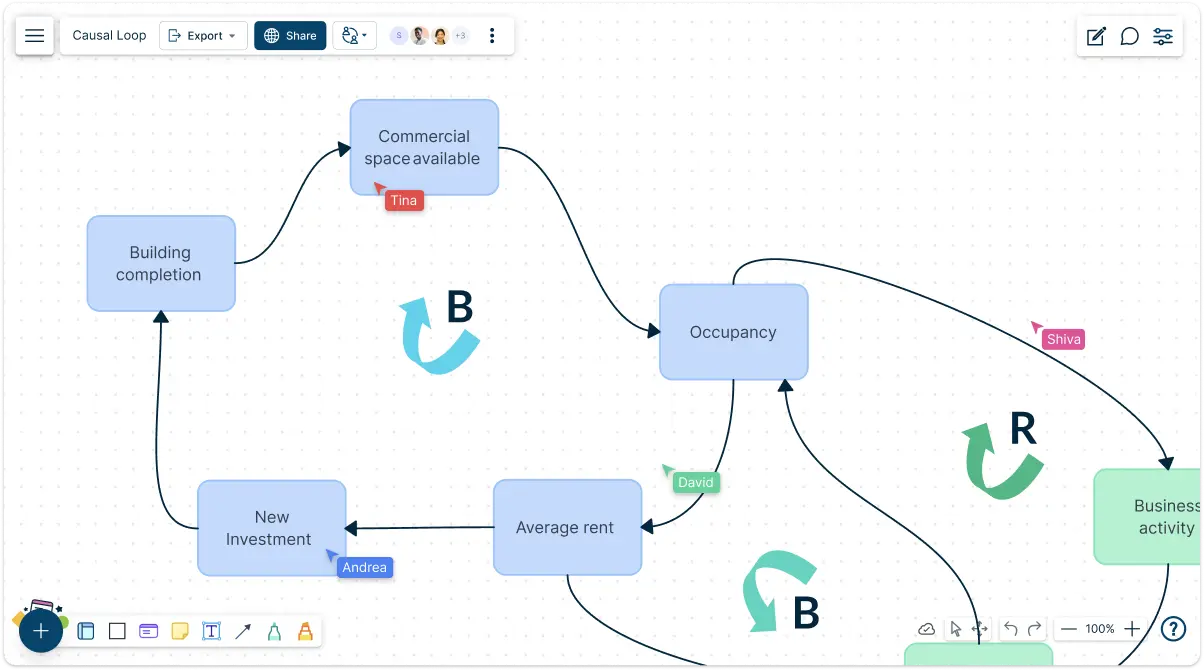
- Customizable causal loop diagram templates to fit your project needs
- Collaborate in real-time to analyze systems more effectively using causal loop diagram templates
- Visually represent cause and effect dynamics with ease using CLD Templates
Over 10 Million people and 1000s of teams already use Creately

Start Quickly with Premade Causal Loop Diagram Templates

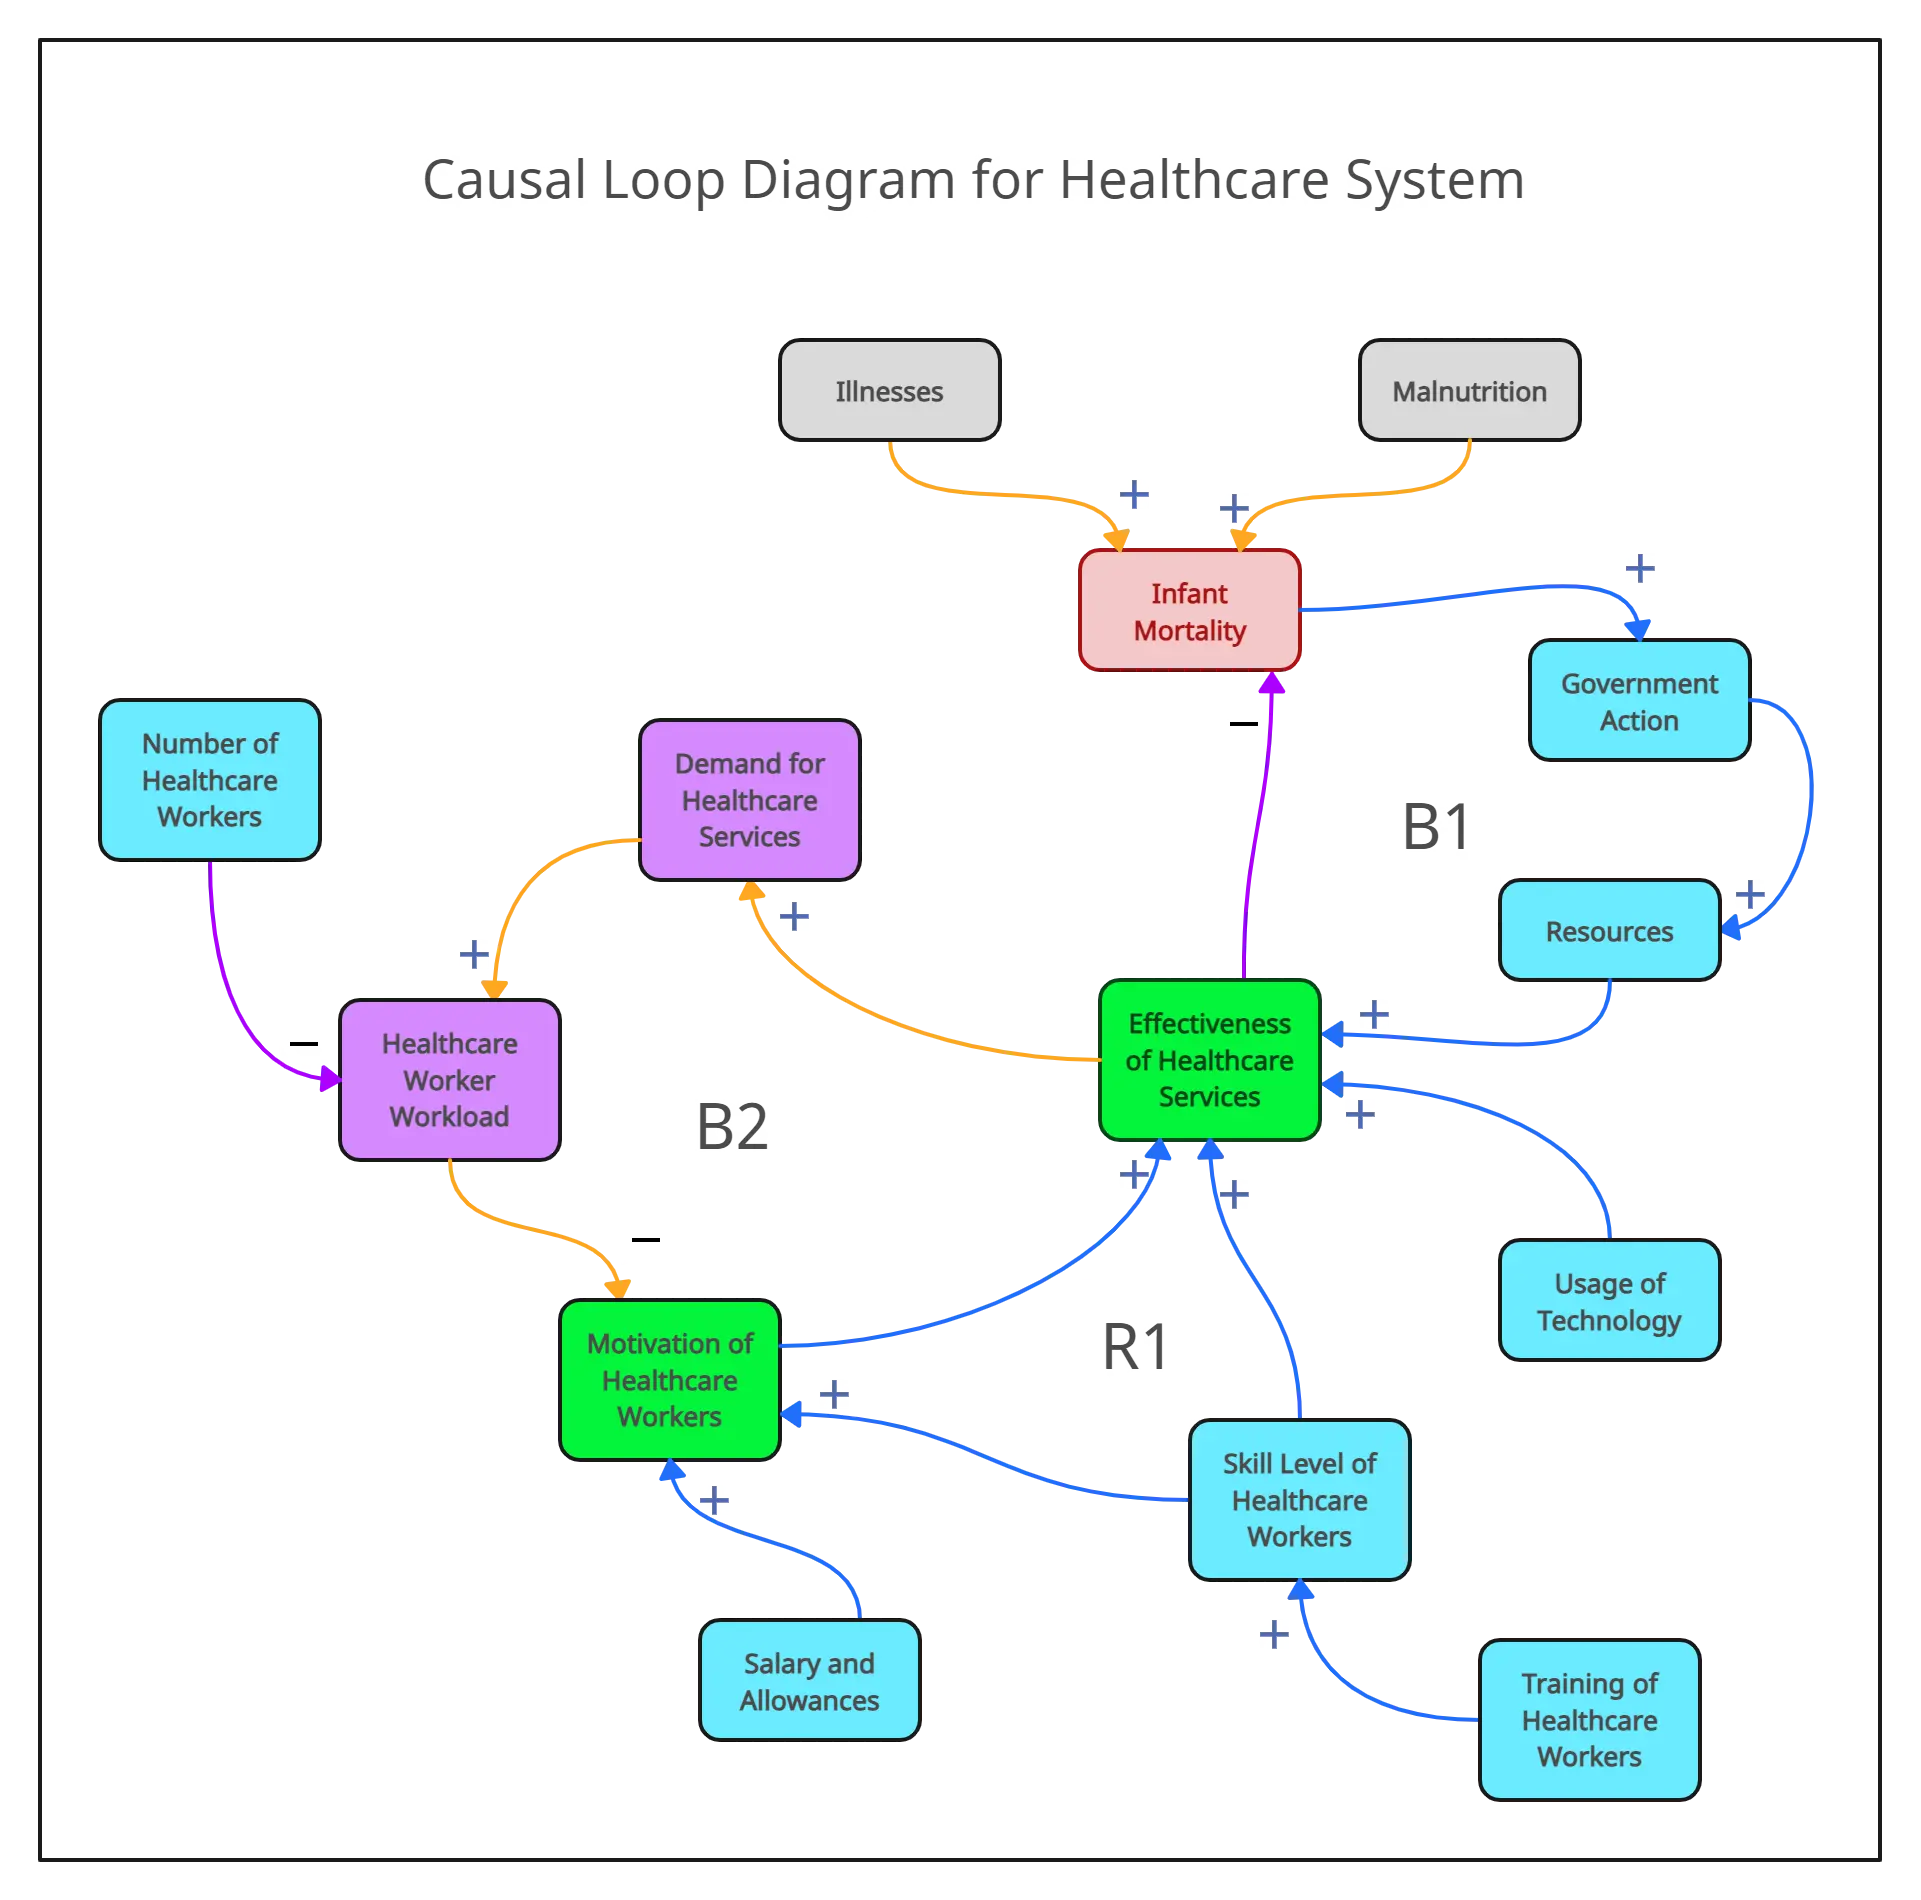
Map Out Complex Interactions for Better Understanding
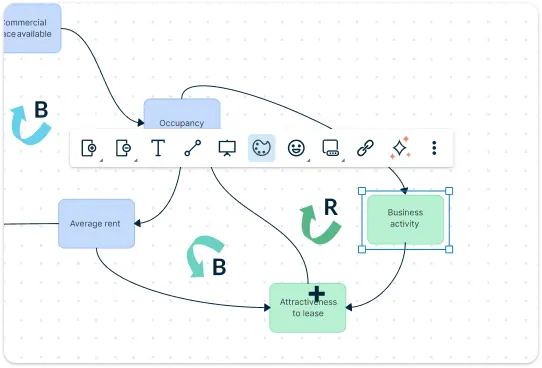
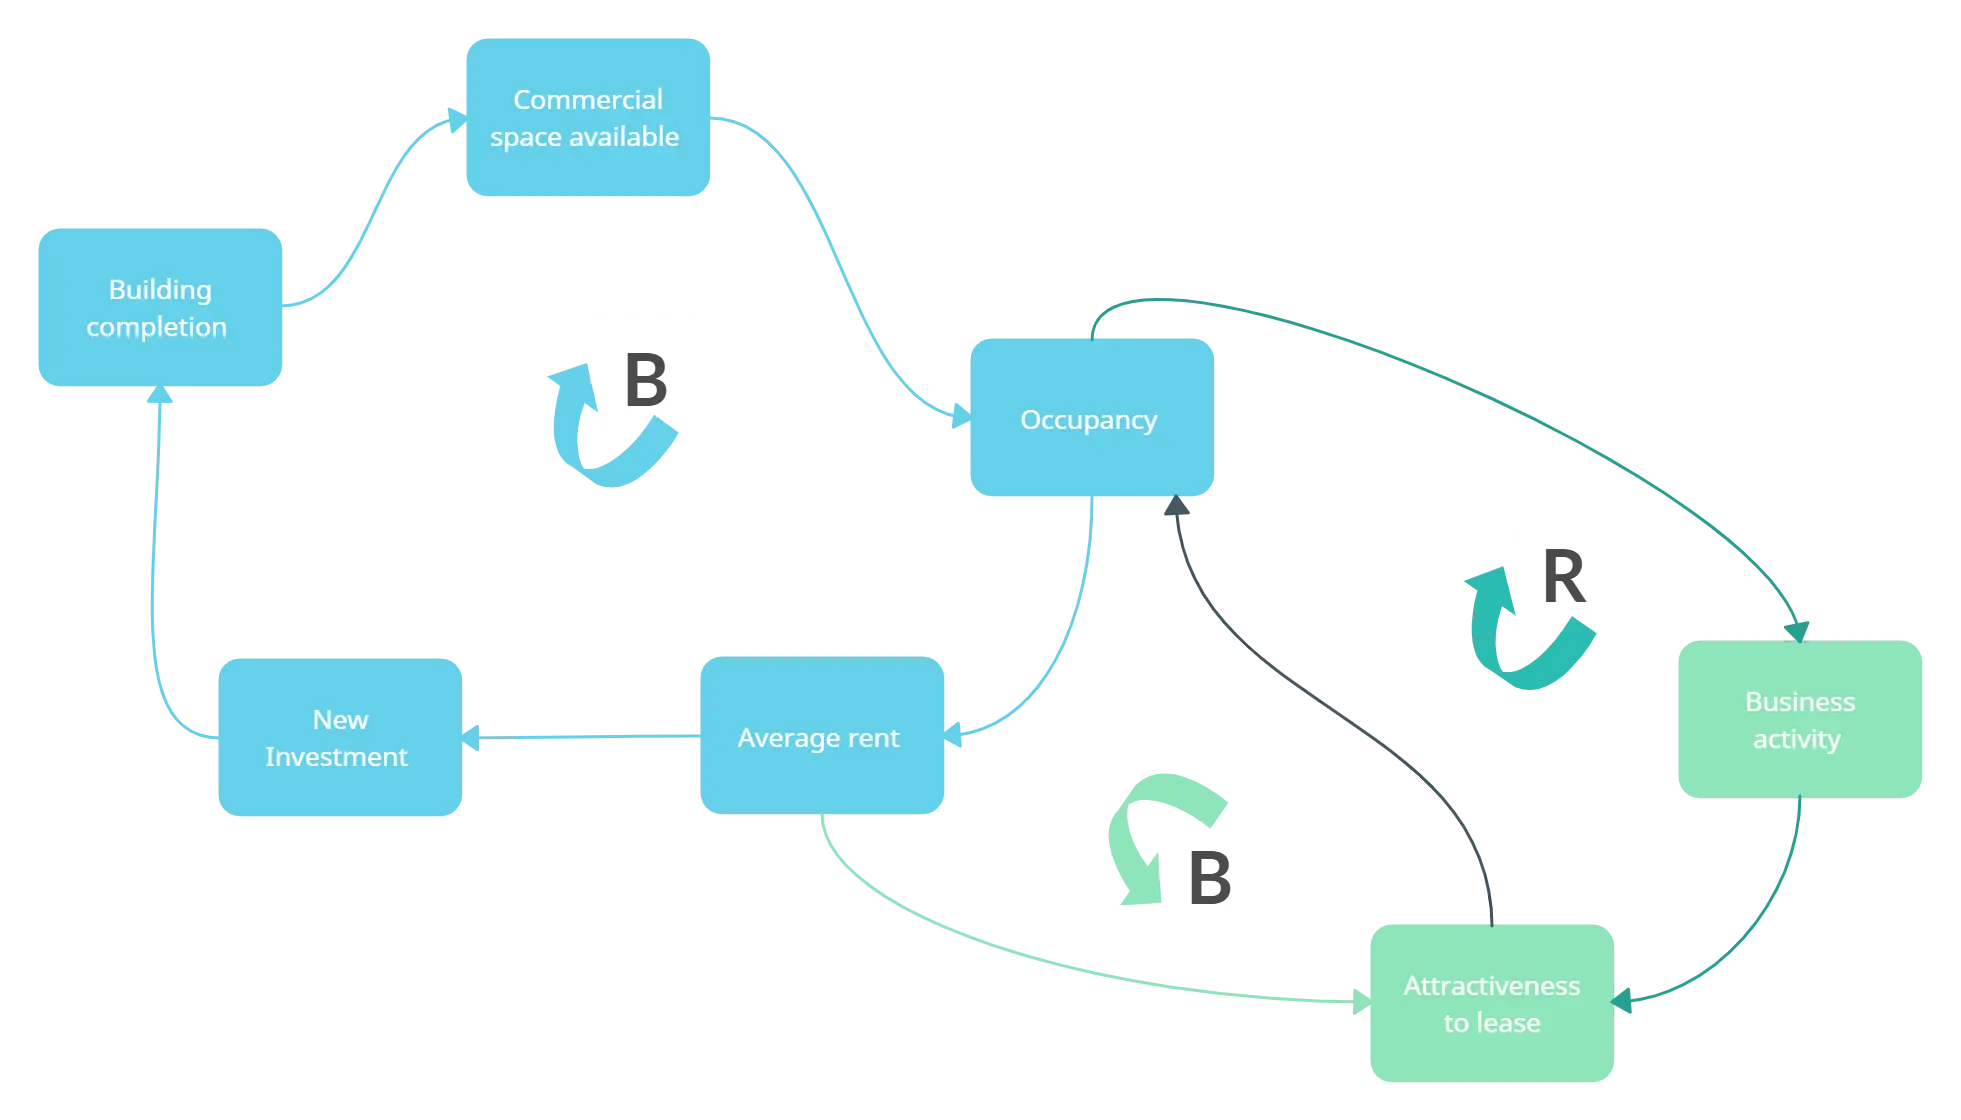
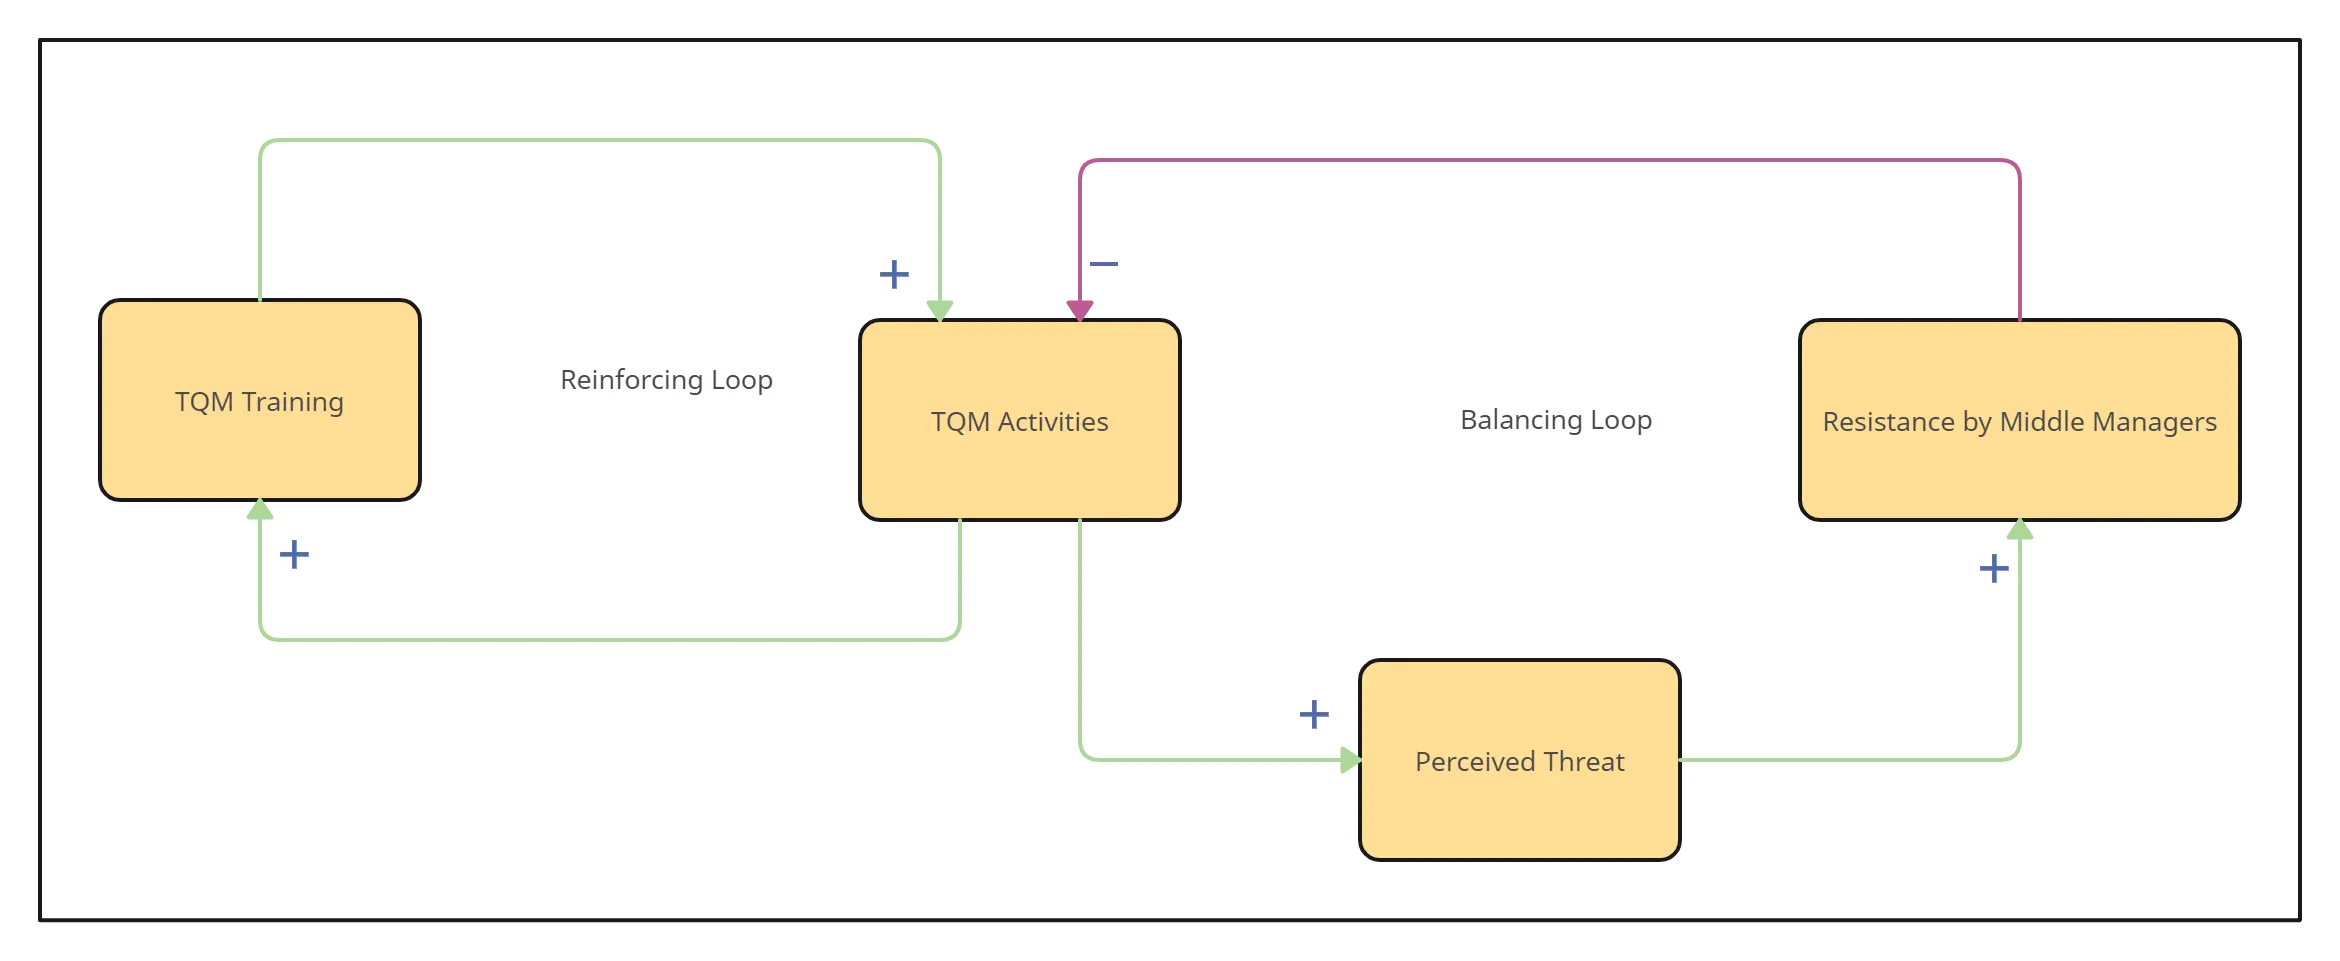
Tailor the causal loop diagram template to suit your system by using customizable templates to visualize feedback loops, reinforcing cycles, and balancing behaviors. Change labels, colors, and shapes to fit your model. Easily highlight key interactions and use visual cues to show positive or negative relationships between variables.
Dive Deeper into System Dynamics
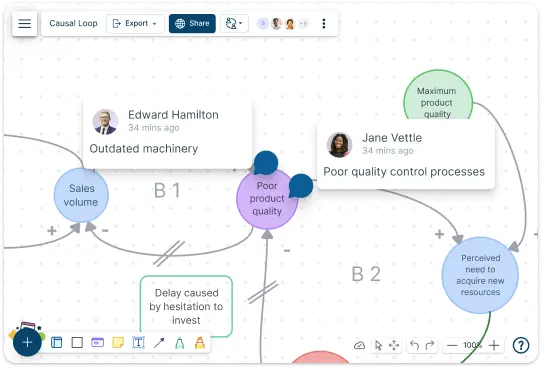
Go beyond surface-level observations by analyzing each variable’s impact on the entire system with a causal loop diagram template. Examine feedback loops, delays, and the ripple effects of changes to understand how different components interact over time. Identify trends, leverage points, and potential system bottlenecks. Simulate different scenarios to forecast system behaviors, helping you uncover insights that drive better decision-making and strategic planning.
Work Together to Gain Deeper Insights

Analyze system dynamics with real-time collaboration with your team. Use contextual comments and annotations to share insights, ask questions, or suggest changes. Review the causal loop diagram and how it influences overall system behavior as a team, ensuring a collective understanding of the system.
Turn Data into Action with Visual Insights
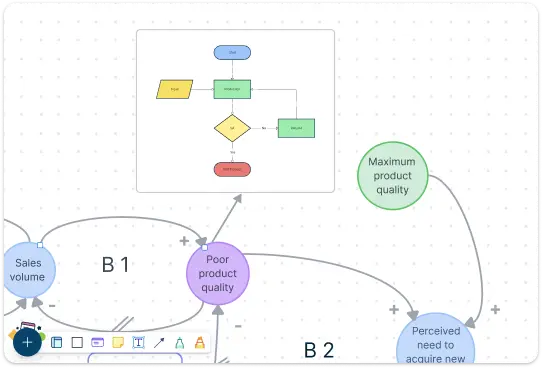
Use a variety of visualization formats, including flowcharts and mind maps, to represent your system’s causal relationships. Embed external data, include notes, and use custom shapes in the causal loop diagram to keep all relevant information in one place. Turn identified system trends into actionable insights by integrating tasks and setting goals based on system analysis.
What Is a Causal Loop Diagram?

How to Create a Causal Loop Diagram with Creately
Choose a Template:
Select a causal loop diagram template from Creately’s library. Whether you’re modeling a business process, environmental system, or other complex scenarios, there’s a template to get you started. You can also start from scratch with customizable shapes and connectors.Identify Key Variables:
List out the key elements or variables that affect your system. This might include resources, processes, or external factors.Map Out Relationships:
Use arrows and connectors to show how each variable influences the others on the causal loop diagram template. Label each connection as positive (reinforcing) or negative (balancing) to indicate the type of relationship.Customize the Diagram:
Use Creately’s drag-and-drop interface to adjust the layout, add color coding, or highlight important relationships on the causal loop diagram template. Icons and visual elements can be added for clarity.Collaborate with others:
Share the causal loop diagram template with your team or stakeholders to get feedback. Use comments and notes to capture their insights in real time as you work on refining the model together.Review and Analyze:
Once your causal loop diagram template is complete, review the feedback loops and system behaviors. Identify any reinforcing or balancing loops that might lead to growth, decline, or stability within the system.Save and Share:
Export your causal loop diagram template in formats like PDF, PNG, or SVG, or share it via a link for easy online collaboration and review.
When to Use a Causal Loop Diagram

- Understanding System Behaviors: Use it to understand how various parts of a system affect each other, such as in economics, environmental studies, or business operations.
- Identifying Feedback Loops: When you want to uncover reinforcing and balancing feedback loops that drive system behaviors, a causal loop diagram provides a clear visual.
- Problem Solving: Causal loop diagrams help you identify the root causes of problems and foresee the consequences of different actions.
- Strategy Development: Use it to model scenarios, foresee challenges, and develop more effective strategies based on systemic insights.
Benefits of Using a Causal Loop Diagram Template

- Visualizes Complex Systems: Helps simplify and clarify relationships between variables in a complex system.
- Identifies Key Feedback Loops: Makes it easier to spot reinforcing and balancing loops in your system.
- Facilitates Collaboration: By enabling real-time collaboration, teams can analyze systems together and share insights.
- Improves Decision-Making: Provides a clearer understanding of how changes in one part of a system may impact the whole.
- Supports Systems Thinking: Encourages a holistic approach to analyzing and addressing system-wide issues.
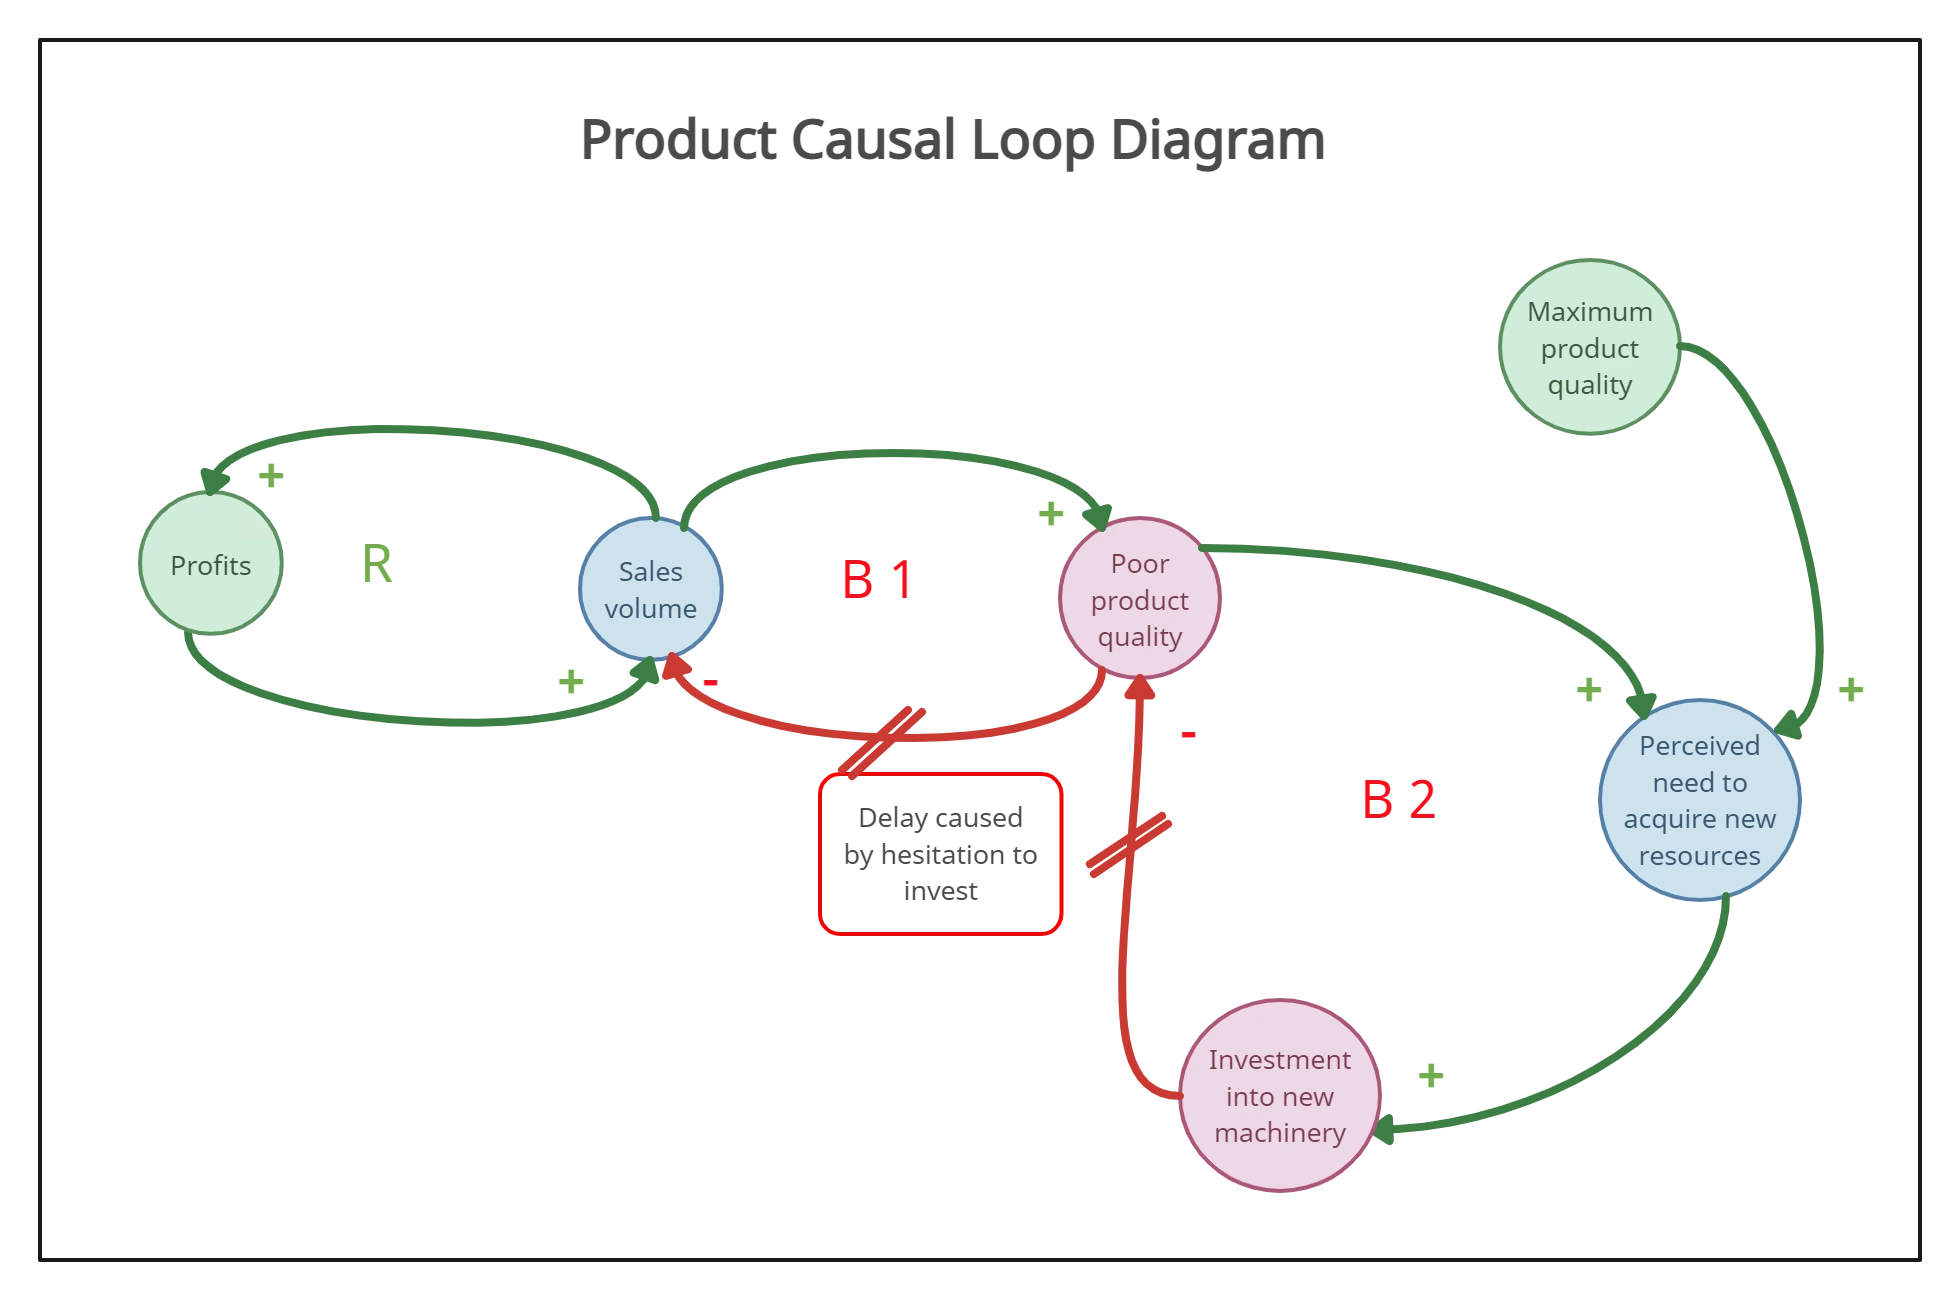
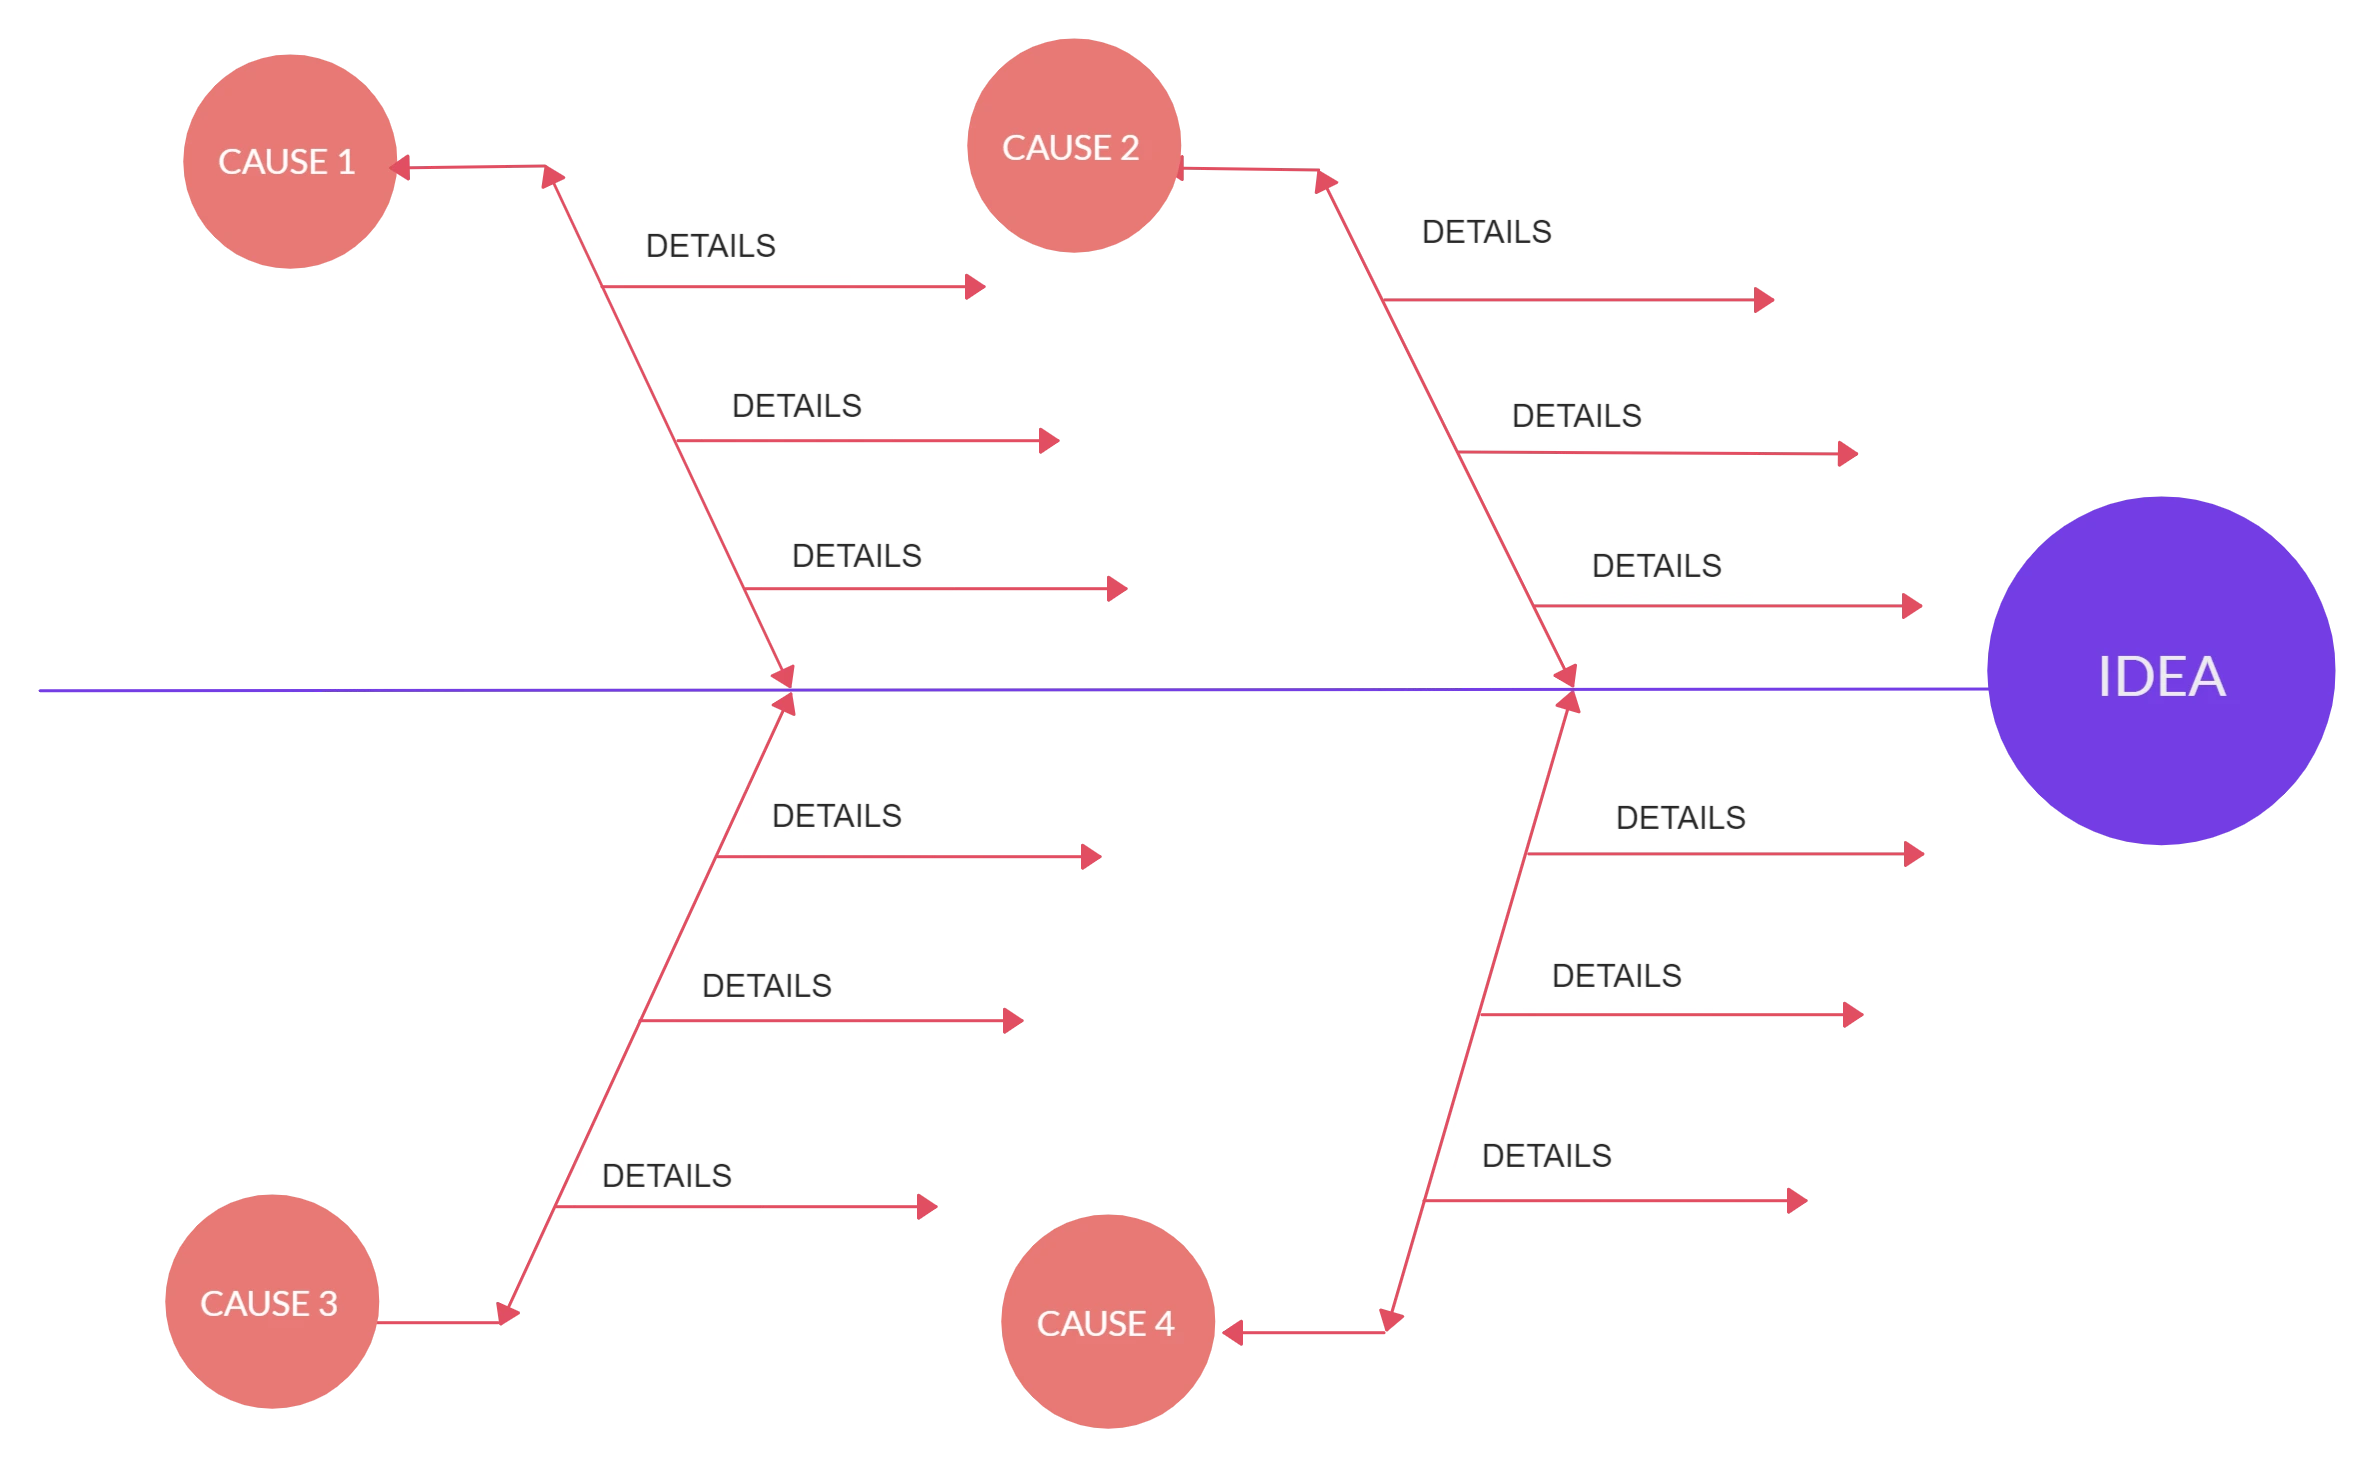
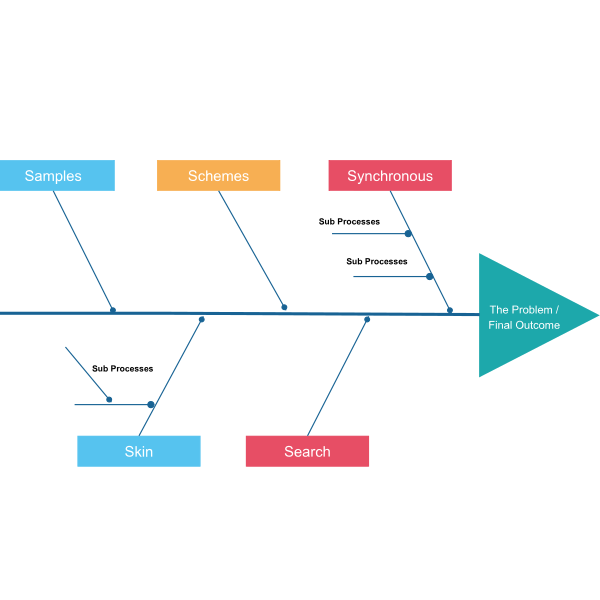
Simplify Your System Analysis with These Templates

FAQ
What are Creately’s causal loop diagram template pricing plans?
- Free Plan — $0/month for basic causal loop diagram creation and collaboration
- Starter & Team Plans — $8/month or $5/month billed annually
- Business Plan — $149/month or $89/month billed annually
Annual billing helps you save more while unlocking advanced collaboration, workspace management, and enhanced causal loop diagram features. You can compare all available plans and features on the Creately Pricing Page.
How can you create causal loop diagrams faster?
Are there templates for different causal loop diagram use cases?
Can teams collaborate on causal loop diagrams?
Can I add notes, data, and files?
Can I share, present, or export causal loop diagrams?