Therapy Session Case View
Frames the family structure around the main counseling or therapy focus.
Frames the family structure around the main counseling or therapy focus.
Shows partners, parents, children, and siblings involved in the case.
Leaves room to note conflict, closeness, distance, or support.
Keeps discussion points visible for assessment and follow-up.
Connects current concerns with relevant family history.
Clarifies caregiving, custody, parenting, or support responsibilities.
Supports shared review before deeper clinical notes are added.
Can be extended as the conversation reveals more family context.
Map a family’s key people and emotional relationship patterns quickly during a therapy session using this focused genogram on Creately Clinical.
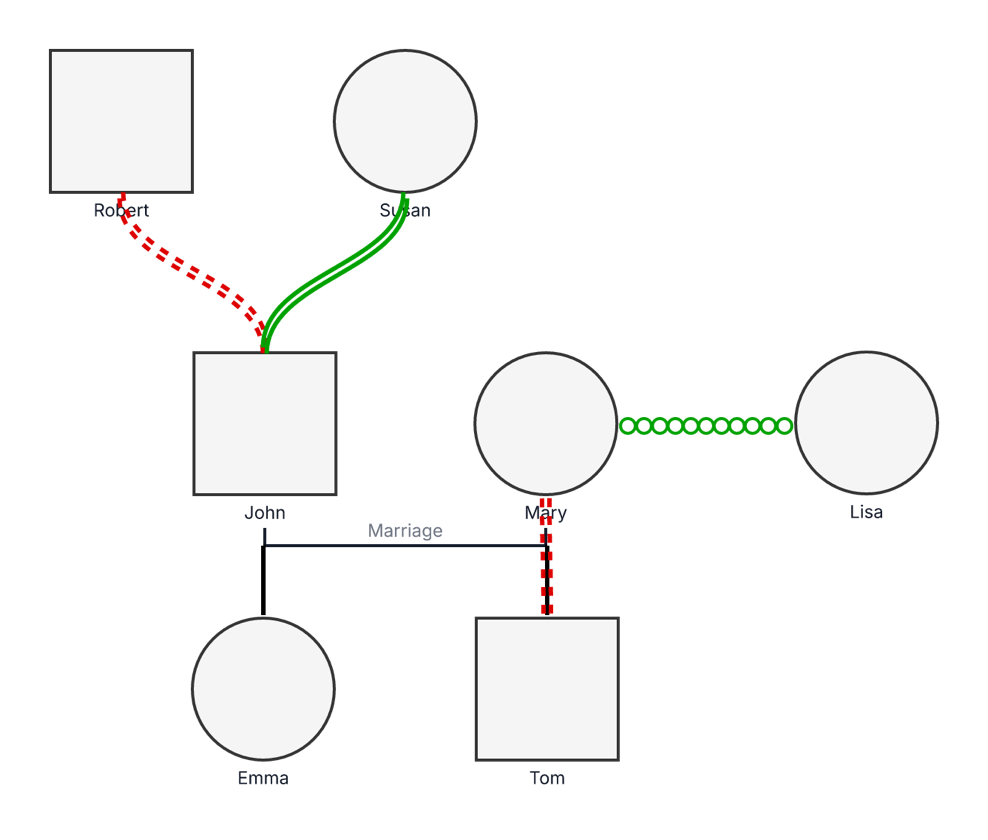
This therapy session genogram provides a compact family map that helps clients and therapists focus on the relationships most relevant to the current conversation.
The example contains seven people across three generations. Robert and Susan appear in the oldest generation. John, Mary, and Lisa form the middle family level, while Emma and Tom appear in the youngest. John and Mary are shown as a married couple.
Four colored relationship lines highlight connections between John and Robert, John and Susan, Mary and Lisa, and Mary and Tom. Two green lines make supportive or close connections visible, while two red lines identify difficult dynamics for further exploration. The focused structure is easy to build during a live session and can be expanded as new themes emerge.
This therapy session genogram can help therapists and clients create a focused family snapshot during a live conversation.
Quickly map the people and relationships most relevant to the session goal.
Define relationship meanings collaboratively and add examples in their own language.
Review a concise visual of session themes, strengths, concerns, and next steps.
Practice focused, collaborative genogram-building during a session.
Standard family symbols establish the structure, while colored relationship lines focus attention on emotional dynamics discussed during the session.
Male family member
Female family member
Marriage or partner relationship
Parent–child relationship
Close, supportive, or strongly connected relationship, as defined in the legend
Difficult, conflicted, strained, or harmful relationship, as defined in the legend
Strength or type of relationship that needs a clear legend label
Relatives grouped at the same family level
Use this example when a therapy session needs a quick, shared view of the family system.
Add the people most relevant to the session, then include partners, children, parents, siblings, or other caregivers needed to understand the concern.
Agree on the meaning of each color and line style before mapping close, supportive, distant, conflicted, interrupted, or harmful dynamics.
Add brief notes about when a pattern occurs, how each person experiences it, what makes it better or worse, and where a different interaction already exists.
Identify strengths to build on, relationships to explore, boundaries or safety needs, communication goals, and one practical next step before the next session.
Creately Clinical supports live therapy mapping with editable relationship notation, family-therapy fields, collaborative editing, auto-save, and report-ready outputs.
Begin with the focus person and the relationships most relevant to the session goal. Add more people or generations only when they help explain an important pattern, strength, or experience.
Develop the labels collaboratively whenever possible. Use the client’s language, clarify what each symbol means, and distinguish personal perspectives from shared or confirmed information.
Yes. Add new information, revise relationship descriptions, track important events, and update goals as the client’s understanding and circumstances evolve.
Editable shapes, notes, relationship markers, and visual categories help build the map as the conversation unfolds. Shared editing, comments, version history, and exports support reflection, supervision, and continued work.
Edit the genogram to add the client’s key family members, define the relationship lines together, and create a focused visual for reflection and therapeutic change.