Multi-Faith Family Spiritual Map
Shows spiritual identity, practices, and family relationships together.
Shows spiritual identity, practices, and family relationships together.
Captures affiliation, tradition, belief shifts, or spiritual influences.
Connects spiritual patterns across relatives and generations.
Leaves room for worship, rituals, coping practices, and values.
Keeps households, couples, children, and relatives clear.
Helps identify sources of support, tension, belonging, or change.
Supports counseling, chaplaincy, or care conversations.
Can be updated as beliefs, roles, or practices change.
Map faith, nonreligious identity, family relationships, and spiritual influences across generations using this multi-faith genogram on Creately Clinical.
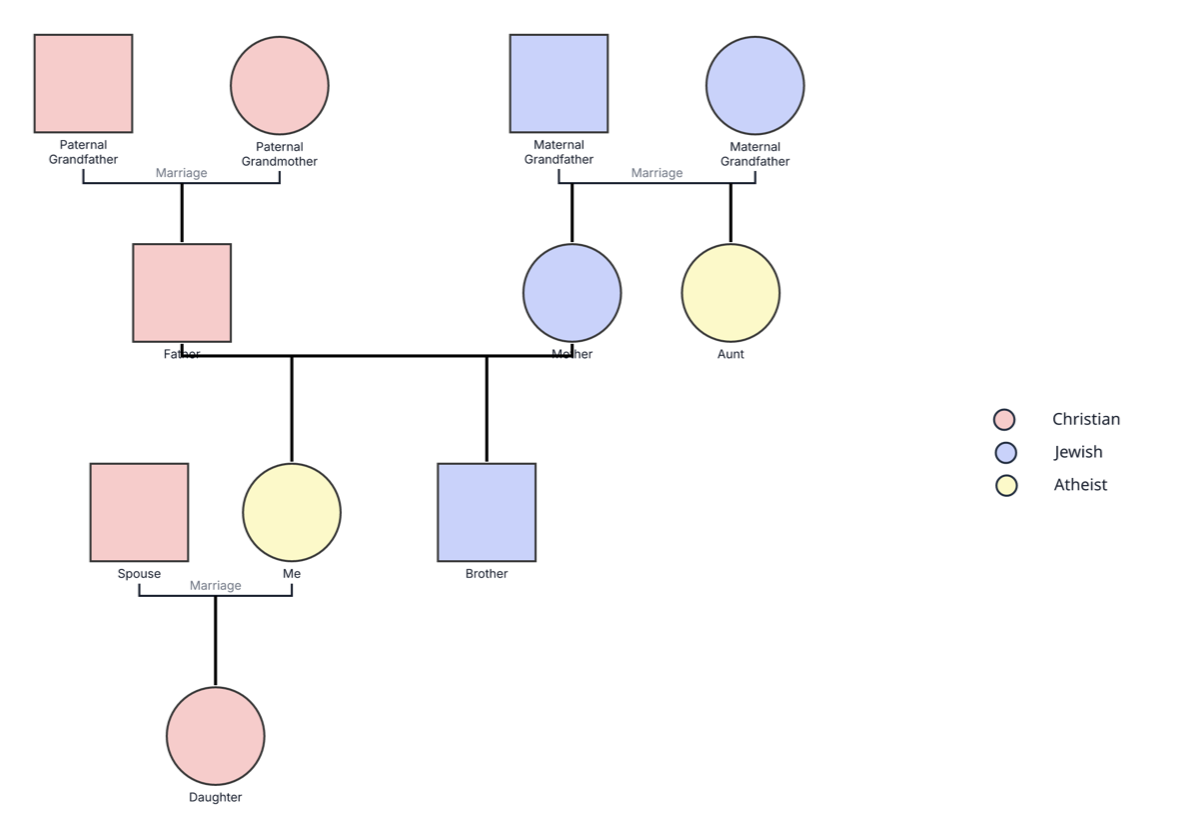
This multi-faith family genogram uses a simple color legend to show Christian, Jewish, and atheist identities across four generations of one family.
The example contains 11 people. The first row shows paternal and maternal grandparents. The next generations include the father, mother, aunt, focus person, spouse, brother, and daughter, giving users a compact view of belief identity across both sides of the family.
Pink represents Christian identity, blue represents Jewish identity, and pale yellow represents atheist identity. The paternal branch is shown as Christian, while the maternal branch introduces Jewish and atheist identities. In the next generation, the focus person is represented as atheist, their spouse as Christian, their brother as Jewish, and their daughter as Christian.
This multi-faith family genogram can help spiritual-care professionals, learners, and families organize belief identities and family context in one clear view.
Explore faith, nonreligious identity, practices, values, rituals, and sources of support.
Discuss how partners and generations navigate different belief identities.
Examine spirituality, identity, and family life across generations.
Create a respectful shared visual using each person’s preferred identity terms.
Standard genogram symbols show family structure, while color fills represent the identities defined in the legend.
Male family member
Female family member
Marriage or partner relationship
Parent–child relationship
Christian identity
Jewish identity
Atheist identity
Defines the belief identity assigned to each color
Use this example when faith, spirituality, or nonreligious identity is meaningful to a family story or professional conversation.
Add the focus person, partner, children, parents, grandparents, siblings, and other relatives relevant to the conversation.
Assign a distinct color to each faith, spiritual, or nonreligious identity and use the terms preferred by the people represented.
Add the appropriate color to each person and include dates or notes when belief identity or participation has changed over time.
Record practices, rituals, values, communities, sources of support, important transitions, and the ways belief connects with family relationships.
Creately Clinical supports spiritual genograms with customizable fields, cultural context, flexible legends, collaborative reflection, and report-ready outputs.
Yes. The example includes atheist identity alongside Christian and Jewish identities. The legend can also be customized for agnostic, secular, spiritual, unaffiliated, or other preferred descriptions.
Yes. You can use a split symbol, multiple markers, or a note to reflect blended, evolving, or personally defined identities.
You can record denomination, level of participation, rituals, values, spiritual resources, communities, significant experiences, and transitions in belief or practice.
Custom fields, notes, legends, and relationship data can keep spiritual context connected to each person. Shared editing, comments, version history, and exports support collaborative exploration and documentation.
Edit the genogram to map your family, personalize the belief legend, and create a thoughtful visual of faith, identity, and connection across generations.