3-Generation Family Therapy Structure
Shows the main family members and relationships in this example.
Shows the main family members and relationships in this example.
Connects couples, parents, children, and siblings in a readable layout.
Places relatives across generations so patterns are easier to see.
Leaves room for names, roles, dates, and family notes.
Supports markers for marriage, separation, loss, conflict, or support.
Keeps the visual focused on the family story shown in the hero image.
Helps teams discuss the same structure before adding deeper notes.
Can be extended as new relatives or relationship details are added.
A basic three-generation genogram example for family therapy intake, illustrating structure, marriages, and parent-child relationships in a working-middle-class family.
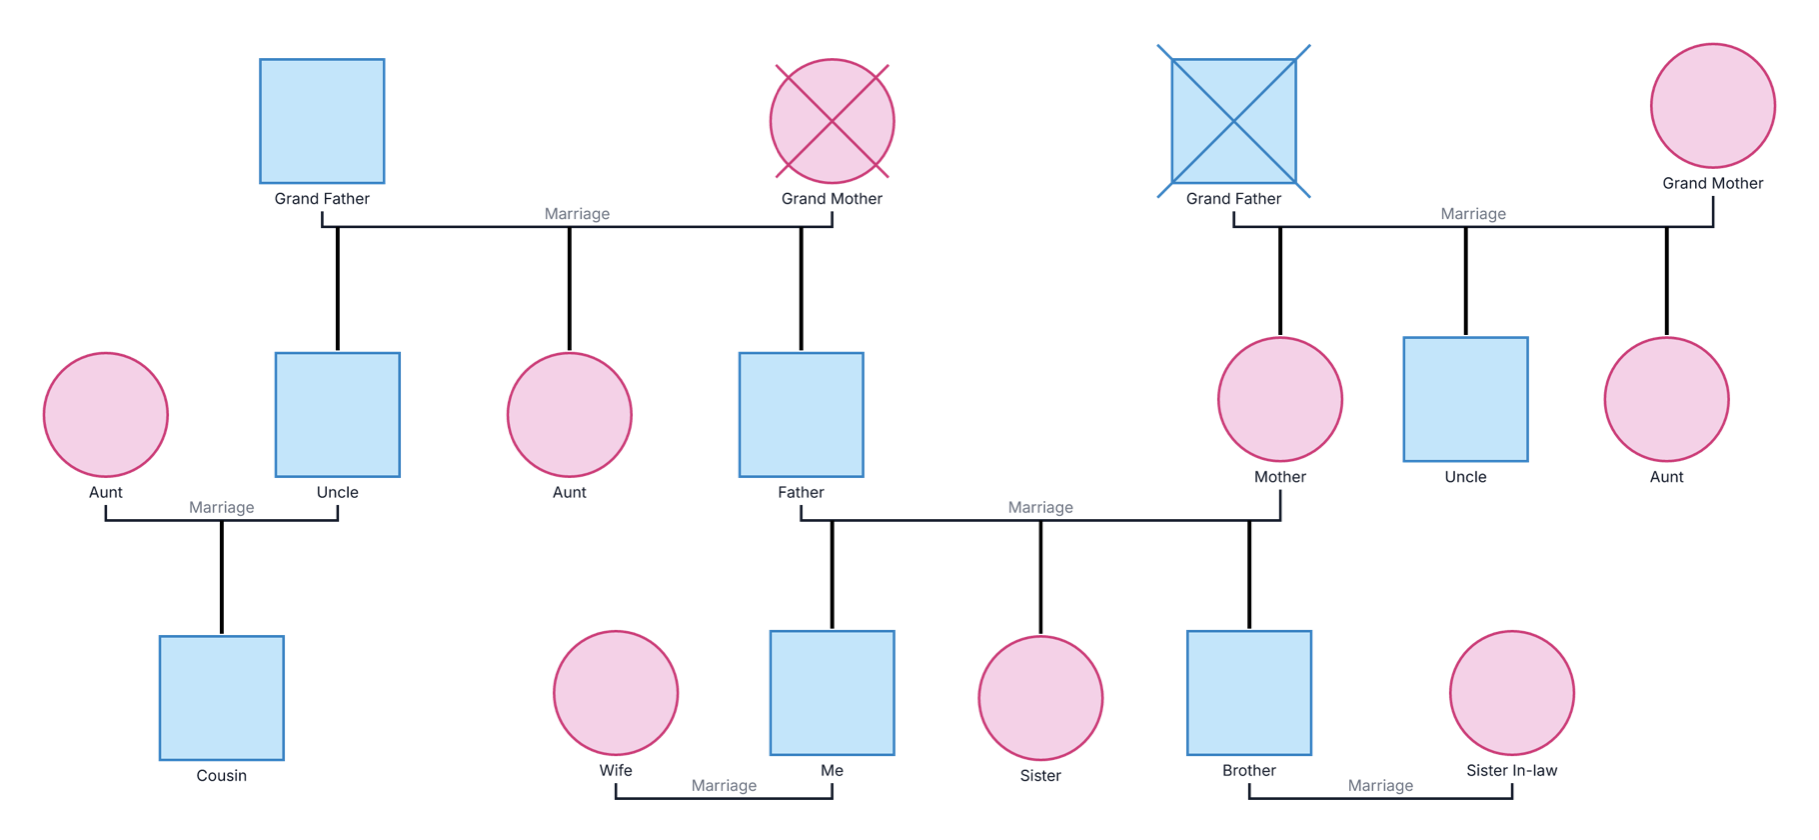
This three-generation genogram maps family members and their relationships across generations, giving clinicians a clear starting point for intake, assessment and collaborative review.
The example keeps the family structure readable while leaving room to add relationship patterns, caregiving roles, health information and case notes that matter for the conversation.
Map family connections and relationship notes to support conversation around family context.
Document family members, caregiving roles and support networks for shared case discussions.
Practice genogram notation and explore how three generations connect through family structure.
Create a visual record of relatives and relationships to discuss and update together.
This example is for anyone who needs a focused view of a family across three generations, such as grandparents, parents and children. It is a useful starting point when you want to:
These core symbols make the structure easy to scan. Add specialized genogram notation as your case requires.
Represents a male family member in the mapped system.
Represents a female family member in the mapped system.
Connects spouses or partners on the same generational row.
Shows descent and keeps the family structure readable.
Flags separation, conflict, loss, caregiving or another status that matters to the case.
Adds notes for relationship status, caregiving role or important context once the core family structure is confirmed.
Visualize three generations of family structure and relationships using this genogram in Creately Clinical.
Start with the identified person, household or central family unit so reviewers can orient themselves quickly.
Extend the map to relatives, caregivers or connected people needed to show the patterns this example is designed to highlight.
Keep notation consistent and add details such as the core household, extended family and relationship context that matters to the purpose of the information.
Use Creately Clinical to refine the diagram with AI-assisted drafting, collaborative editing and report-ready outputs when the case needs more depth.
Creately Clinical is built for professional, collaborative diagramming workflows. Use the example as a starting point, then add the structure, notes and context needed for your case.
Turn notes into a structured draft, then refine the people and relationships that matter.
Add relationship markers, fields and case notes without losing the clarity of the underlying family structure.
Share a live diagram with care teams, students or family members and keep one current version.
Use the terms each person chooses for themselves. Add notes when nationality, ethnicity, race, language, religion, migration, region, or community affiliation are important to how that identity is understood.
Not necessarily. They can simply show that multiple cultural identities are relevant. Use percentages only when they are meaningful to the family and clearly defined in the legend.
Yes. Add dates or notes to show shifts in self-identification, language use, community participation, migration, cultural practice, or sense of belonging.
Custom fields, notes, color categories, and relationship markers can keep family and cultural context organized. Shared editing, comments, version history, and exports support collaborative reflection and ongoing updates.
Open the example, map the structure quickly, and use Creately Clinical for AI-assisted drafting, collaborative editing, and report-ready outputs. This keeps the first draft simple while making it easy to turn the same diagram into a stronger working artifact later.