Longitudinal Family Study Structure
Shows the main family members and relationships in this example.
Shows the main family members and relationships in this example.
Connects couples, parents, children, and siblings in a readable layout.
Places relatives across generations so patterns are easier to see.
Leaves room for names, roles, dates, and family notes.
Supports markers for marriage, separation, loss, conflict, or support.
Keeps the visual focused on the family story shown in the hero image.
Helps teams discuss the same structure before adding deeper notes.
Can be extended as new relatives or relationship details are added.
Track uniquely coded family members, relationships, follow-up data, and changes across generations using this longitudinal study genogram on Creately Clinical.
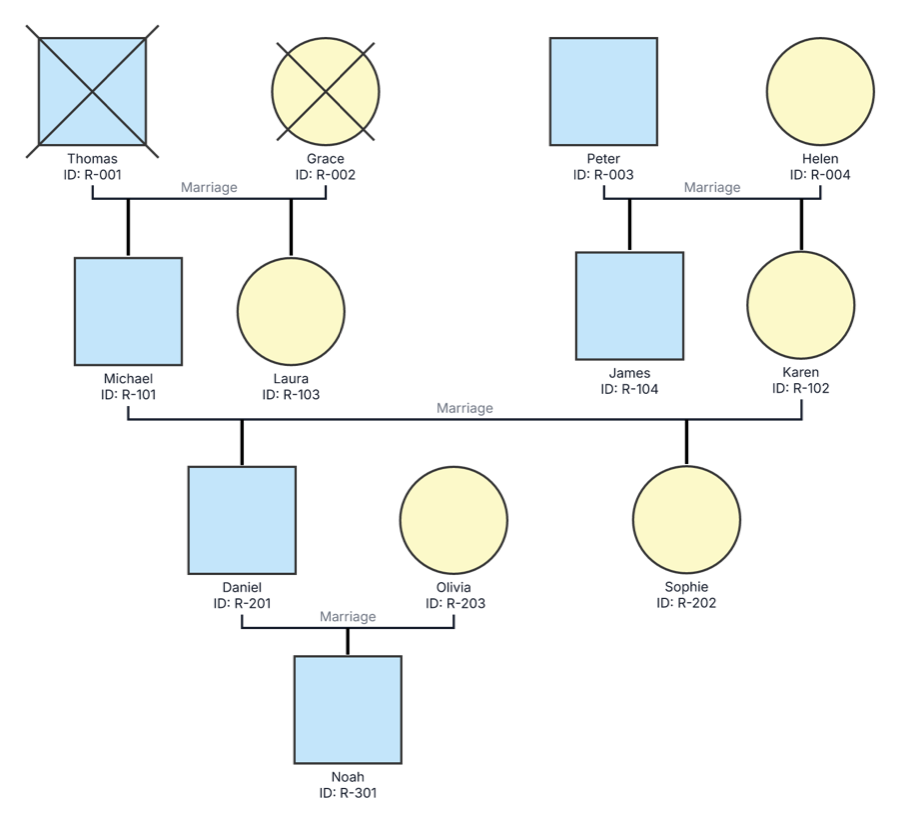
This longitudinal family study genogram gives every person a stable research ID and places the family across four generational rows, creating a clear foundation for repeated data collection and change-over-time analysis.
The example contains 12 people. The first row shows Thomas (R-001) and Grace (R-002), both marked deceased, alongside Peter (R-003) and Helen (R-004). The next rows include Michael (R-101), Karen (R-102), Laura (R-103), James (R-104), Daniel (R-201), Sophie (R-202), Olivia (R-203), and Noah (R-301).
Four partner relationships are labeled as marriages. The ID structure groups participants by study generation—R-0xx, R-1xx, R-2xx, and R-3xx—making records easier to match across interviews, surveys, clinical observations, or other study waves. Researchers can extend each profile with cohort, consent, source, collection date, follow-up, data-quality, and confidentiality information.
Before using the example for data collection, add or confirm the vertical parent–child connectors between each generation. Several descent lines are not visible in the preview, so the current placement alone should not be used to infer biological or other parentage.
This longitudinal family study genogram can help research teams organize stable participant identities, family structure, and repeated observations in one clear view.
Track coded participants, family connections, study waves, and outcomes across time.
Connect interviews, surveys, records, or observations to stable participant profiles.
Review consent, follow-up, confidentiality, sources, quality, and collection status.
Practice longitudinal family-data design, documentation, and quality review.
Keep family notation and research metadata separate but connected so the same participant can be followed consistently over time.
Male study participant
Female study participant
Deceased study participant
Marriage or partner relationship
Parent–child relationship; these should be confirmed and made visible in the editable version
First generational study row
Second generational study row
Third generational study row
Fourth generational study row
Use this example when the same family members and relationships will be revisited across multiple collection dates or study waves.
Create a stable, non-duplicating identifier rule before adding participants. Keep personally identifying information separate when the research protocol requires coded or pseudonymized data.
Add partners, parents, children, siblings, and deceased people using consistent notation. Confirm every descent line rather than relying on row position.
Record cohort, consent status, source, collection date, follow-up status, data quality, confidentiality level, and the variables required at each study wave.
Add new observations with dates and sources, review completeness and discrepancies, and preserve earlier states so researchers can distinguish change over time from corrected data.
Creately Clinical supports longitudinal research with structured study fields, research-quality and timeline views, version history, collaboration, and structured export.
A stable ID helps researchers connect the same person’s records across collection dates and data sources while reducing dependence on names. The project’s approved data-governance and confidentiality procedures should determine how IDs connect to identifying information.
Update the fields defined by the protocol, such as consent, follow-up status, relationships, residence, health, life events, services, or outcomes. Add a collection date and source so changes can be interpreted in sequence.
No. Rows help organize generations, but the relationship line defines the connection. Add visible parent–child, partner, and sibling structures so viewers do not have to infer relationships from proximity.
The General Research & Genealogy field pack supports research IDs, cohorts, consent, data quality, sources, collection dates, follow-up, confidentiality, and publication status. Version history, Research Quality and Timeline Events viewpoints, completeness review, comments, and JSON export support repeatable study workflows.
Edit the genogram to assign stable research IDs, confirm the family connections, and build a structured genogram that can be updated consistently across every study wave.