Family Structure
Shows the main family members and relationships in this example.
Shows the main family members and relationships in this example.
Connects couples, parents, children, and siblings in a readable layout.
Places relatives across generations so patterns are easier to see.
Leaves room for names, roles, dates, and family notes.
Supports markers for marriage, separation, loss, conflict, or support.
Keeps the visual focused on the family story shown in the hero image.
Helps teams discuss the same structure before adding deeper notes.
Can be extended as new relatives or relationship details are added.
Explore family structure, partnership status, and emotional relationships across three generations using this editable example on Creately Clinical.
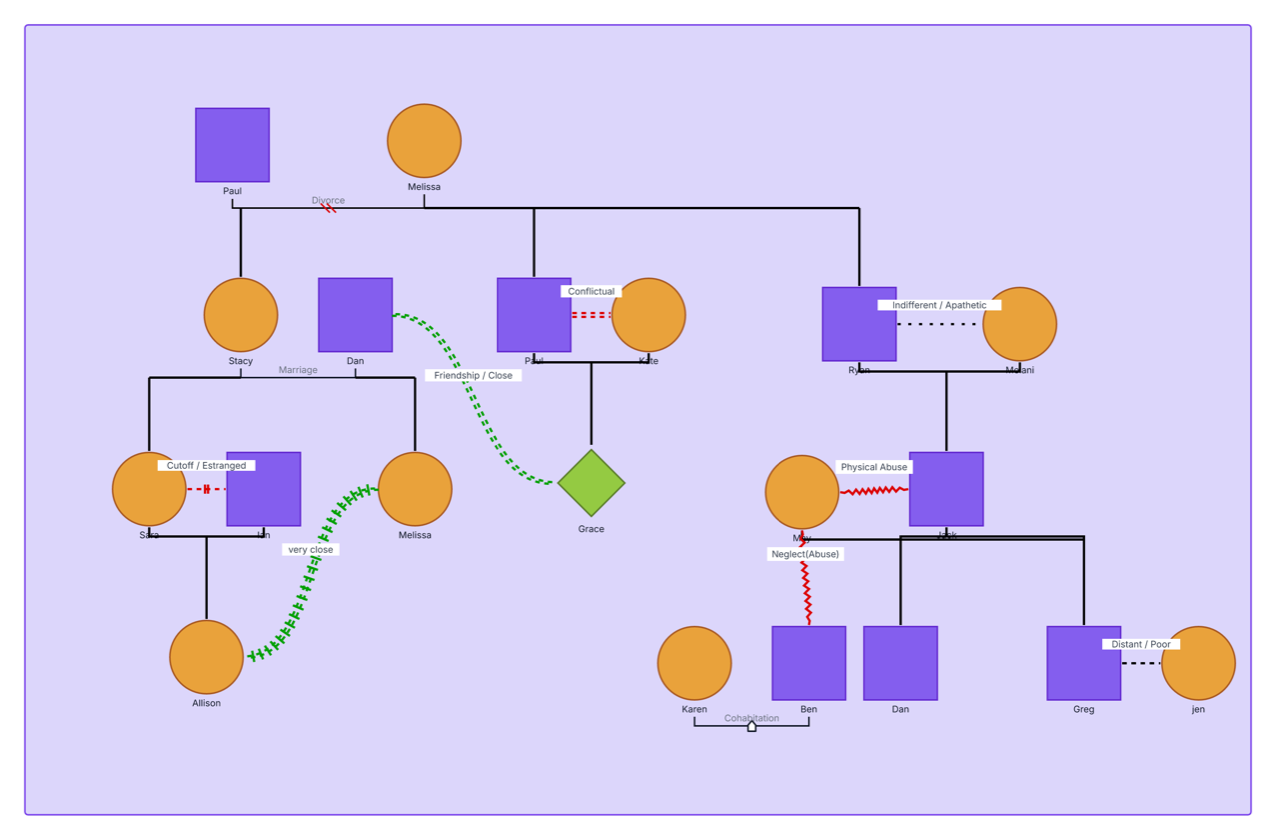
This complete genogram example combines family structure, partnership status, and emotional relationships in one multigenerational view, making it a useful reference for learning, discussion, and professional practice.
The example maps 19 people across three generations. Paul and Melissa appear at the top with a divorced relationship, followed by three family branches containing married and cohabiting couples, children, and partners. This gives users a practical model for arranging a larger family while keeping generations and households readable.
The diagram also demonstrates eight labeled emotional relationship types: conflictual, indifferent or apathetic, friendship or close, cutoff or estranged, very close, physical abuse, neglect or abuse, and distant or poor. Showing each relationship as a separate labeled line helps viewers interpret the family system without relying on color or line style alone.
This complete genogram example can help professionals, learners, and families understand structural and emotional relationship notation in one clear view.
Reference common partnership and emotional-relationship types before adapting the map for assessment.
Use a shared example for onboarding, supervision, case discussion, and consistent notation.
Learn how family structure and labeled emotional relationships work together across generations.
Start from a populated example instead of a blank canvas and replace it with relevant information.
Use labels and a legend with every specialized marker so the meaning remains clear when the example is customized.
Male family member
Female family member
A distinct person shape for Grace; define its identity meaning in the working diagram’s legend
Marriage, divorce, or cohabitation, as labeled
Parent–child connection
A positive bond labeled friendship/close or very close
A relationship labeled conflictual, cutoff/estranged, physical abuse, or neglect/abuse
A relationship labeled indifferent/apathetic or distant/poor
Use this example when you want to see several common genogram conventions working together before building your own family map.
Add the identified person and confirmed relatives, then organize grandparents, parents, siblings, partners, and children by generation.
Choose the appropriate marriage, divorce, separation, cohabitation, or other partner status. Connect children to the correct parent or partner union.
Use the relationship library to mark closeness, distance, conflict, cutoff, or another dynamic relevant to the purpose of the genogram. For abuse-related information, use clear sourcing, appropriate consent, and professional safeguarding procedures.
Keep every specialized line labeled, confirm interpretations with the appropriate participants or professionals, and update the diagram as information changes. Use permissions when sharing sensitive material.
Creately Clinical supports detailed genograms with a broad relationship library, therapy-focused fields, collaborative editing, and report-ready outputs. This example is especially useful for seeing how structural notation and labeled emotional dynamics can coexist in one clinical working view.
Alongside ancestry and family connections, it records partnership status and labeled emotional relationships. This additional context helps users examine how people relate within the family system.
No. Add only the relationships relevant to your purpose and supported by the available information. A smaller set of clearly labeled relationships is often easier to use in discussion.
Yes. Replace the example people, select the appropriate person shapes, choose relationship subtypes, and adjust labels or notes. Define custom notation in a legend so collaborators interpret it consistently.
Creately Clinical provides a library of 71 relationship subtypes across nine categories, Family Therapy fields for emotional bonds and trauma history, and a Relationship Dynamics viewpoint. AI-assisted drafting, real-time editing, comments, permission-based sharing, and PDF or DOCX reporting support teaching and professional review.
Open the editable example to explore the notation, replace the sample family with your own information, and build a clear genogram without starting from a blank canvas.