Generational Family Structure
Shows the main family members and relationships in this example.
Shows the main family members and relationships in this example.
Connects couples, parents, children, and siblings in a readable layout.
Places relatives across generations so patterns are easier to see.
Leaves room for names, roles, dates, and family notes.
Supports markers for marriage, separation, loss, conflict, or support.
Keeps the visual focused on the family story shown in the hero image.
Helps teams discuss the same structure before adding deeper notes.
Can be extended as new relatives or relationship details are added.
Map grandparents, parents, siblings, partners, and extended relatives across three generations using this genogram on Creately Clinical.
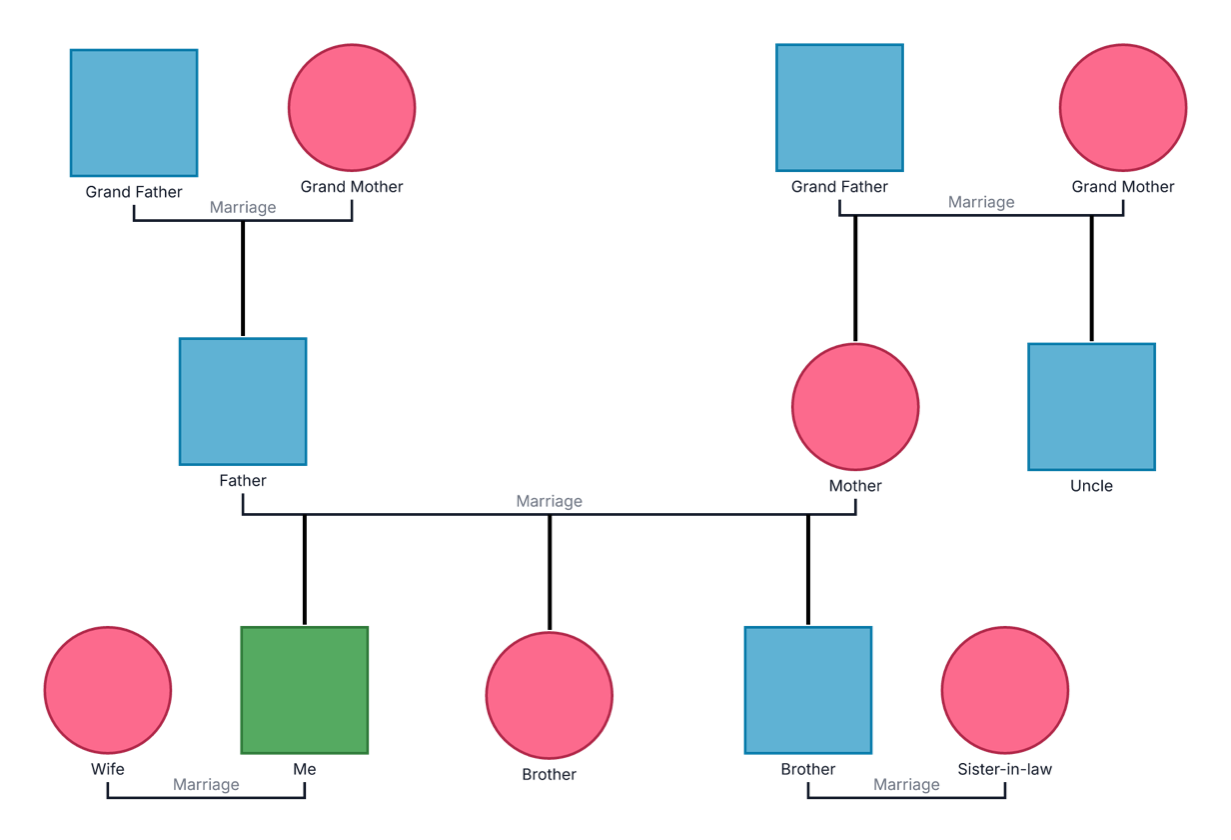
This generational family genogram organizes grandparents, parents, siblings, partners, and extended relatives in one easy-to-scan view, giving you a strong foundation for family discussions, professional assessment, or historical research.
The example maps 12 people across three generations. Two grandparent couples anchor the upper row. The middle generation includes the father, mother, and an uncle, while the lower row brings the identified person together with a wife, two brothers, and a sister-in-law.
Because the diagram begins with a clean family structure, it is easy to personalize. Add names, dates, parent–child connections, relationship details, health information, cultural background, or other relevant notes without rebuilding the layout.
This generational family genogram can help professionals, learners, researchers, and families organize immediate and extended relatives in one clear view.
Establish a shared family structure before adding relationships, caregiving roles, or case context.
Create a multigenerational foundation for relevant health and family-history details.
Practice generational layout, partner lines, sibling branches, and extended-family placement.
Organize both family branches and add dates, roles, history, or notes over time.
Use consistent symbols and place each generation on its own row so viewers can understand the family structure quickly.
Male family member
Female family member
Marriage or partner relationship
Parent–child or family descent connection
Grandparent generation
Parent and uncle generation
Identified person, siblings, and their partners
Visual styling that helps differentiate people; define any data meaning in a legend if you use color categorically
Use this example whenever you need a concise multigenerational picture that can grow with the conversation or project.
Begin with the central person, their partner, siblings, and parents so the main household and sibling group are easy to follow.
Add the parents of each parent on the top row, keeping maternal and paternal branches visually distinct.
Add spouses, partners, aunts, uncles, and other people relevant to the purpose of the genogram. Connect each person to the correct family branch.
Record names, dates, relationship details, and relevant notes. Confirm the structure, define any custom colors in a legend, and use Creately Clinical to collaborate or expand the diagram as needed.
Creately Clinical supports multigenerational family mapping with structured notation, flexible profiles, collaborative editing, and report-ready outputs. The standard genogram view and Base fields provide a clear foundation that can be extended with specialized clinical field packs when needed.
A family tree primarily records ancestry and descent. A genogram can begin with the same family structure and then add relationship types, emotional dynamics, health details, roles, events, and other context relevant to the project.
No. Start with the relationships you can confirm and mark unknown details clearly. You can add or update relatives as more information becomes available.
Yes. Extend the appropriate generational row and connect each person to the correct partner or parent–child structure. Creately’s layout tools help keep a growing family map readable.
You can generate a starting structure from a written family summary, add Family Therapy fields and relationship types, collaborate with others in real time, and switch to views such as Relationship Dynamics when you want to explore a particular layer. PDF, DOCX, SVG, and image exports support review, documentation, and presentation.
Edit the genogram to place your family members, connect three generations, and create a clear visual foundation you can enrich at your own pace.