Genealogical Research Family Structure
Shows the main family members and relationships in this example.
Shows the main family members and relationships in this example.
Connects couples, parents, children, and siblings in a readable layout.
Places relatives across generations so patterns are easier to see.
Leaves room for names, roles, dates, and family notes.
Supports markers for marriage, separation, loss, conflict, or support.
Keeps the visual focused on the family story shown in the hero image.
Helps teams discuss the same structure before adding deeper notes.
Can be extended as new relatives or relationship details are added.
Organize relatives, marriages, ancestry, cultural heritage, and research sources across generations using this genogram on Creately Clinical.
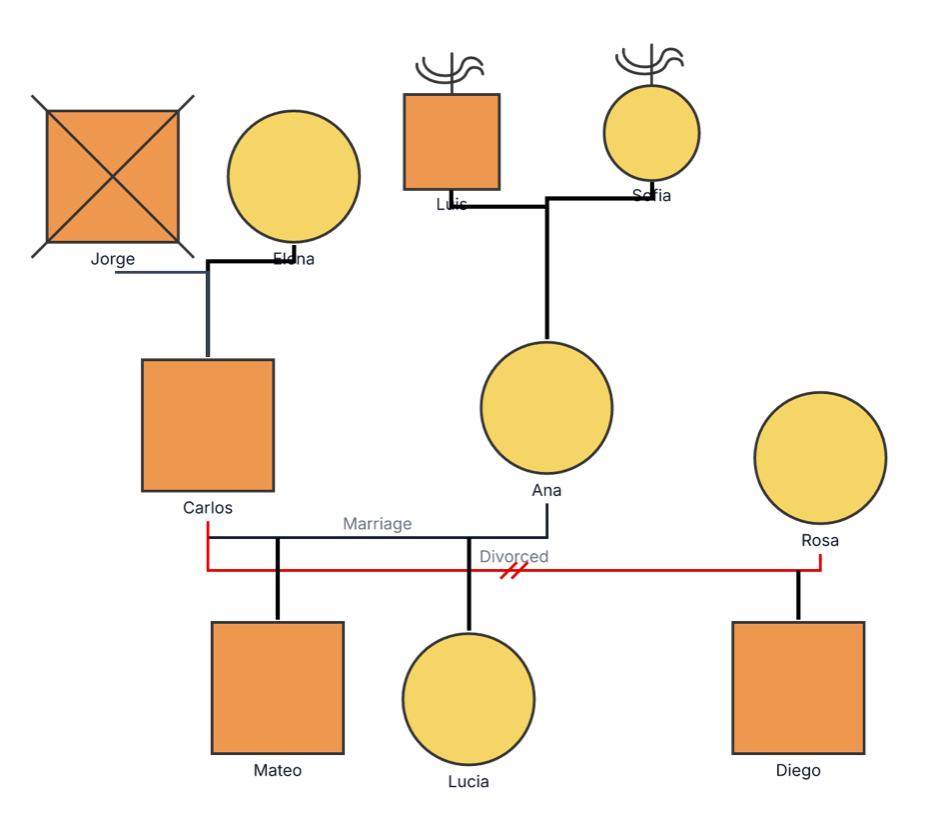
This genealogical research family genogram combines ancestry, relationships, and research-ready details in one visual, helping genealogists organize what is known and build each family branch from reliable sources.
The example maps ten people across three generations. Jorge and Elena form one first-generation branch, while Luis and Sofia form another. The middle generation includes Carlos, Ana, and Rosa, and the next generation includes Mateo, Lucia, and Diego.
Jorge’s deceased marker preserves an important status in the family history, while the culture flags above Luis and Sofia create space for heritage information. Carlos’s marriage and divorce relationships show how multiple partner histories can remain visible without losing the connections to later generations.
This genealogical research family genogram can help researchers, educators, and families organize ancestry and source-backed family information in one clear view.
Build family branches while recording dates, places, heritage, evidence, and research notes.
Track data sources, collection dates, quality, and unresolved questions across a family dataset.
Explore genealogy, migration, cultural heritage, and evidence-based family-history methods.
Create a collaborative ancestral record and invite relatives to contribute or verify information.
Standard genogram symbols map the family structure, while culture flags and structured research fields add historical context and evidence.
Male family member
Female family member
Deceased family member
Connects married partners
Records a dissolved marriage while preserving the family history
Connects descendants to the relevant parent or parental union
Indicates that one or more cultural heritage backgrounds can be recorded for a person
Capture research ID, data source, collection date, data quality, and supporting notes
Use this example when genealogists, family historians, educators, or research teams want to connect family relationships with source-backed historical information.
Add the relative or union for which you have reliable information. Record names as they appear in the source and include alternate spellings in notes.
Add parents, partners, siblings, children, and later generations. Use the correct relationship type for marriages, divorces, adoptions, step relationships, and other family connections.
Record birth, marriage, migration, residence, and death details when available. Use the General Research & Genealogy fields for data sources such as interviews, vital records, census records, family documents, DNA results, and public records.
Add collection dates and data-quality notes, then use the Research Quality viewpoint to review sources and completeness. Invite relatives or research collaborators to contribute evidence and preserve uncertain findings as clearly labeled research questions.
Creately Clinical supports genealogy research with structured source fields, cultural and timeline views, collaborative verification, and scalable layout. For this example, the General Research & Genealogy fields keep family relationships and supporting evidence connected in one working record.
The General Research & Genealogy fields support interviews, vital records, census records, family documents, DNA information, medical records, and public records. Add the source and collection date so collaborators can trace each detail.
Keep the competing details in research notes, identify their sources, and assign a data-quality rating where useful. Use the main profile for the conclusion currently supported by the strongest evidence and update it when new documentation becomes available.
Yes. Add self-identified heritage tags, birthplaces, residences, immigration details, languages, and migration events. The Cultural and Timeline Events viewpoints can help users explore these dimensions of the same family data.
Creately supports hundreds of people, background layout processing for trees above 200 nodes, zooming, panning, and frames for navigation. Teams can collaborate in real time, maintain version history, review data completeness, and export diagrams as SVG or PDF and structured data as JSON.
Edit the genogram, replace the example family with your relatives, and build each branch from the sources you already have. Add dates, places, heritage details, and evidence notes, then invite collaborators to verify the record and continue the research together.