Family Structure
Shows the main family members and relationships in this example.
Shows the main family members and relationships in this example.
Connects couples, parents, children, and siblings in a readable layout.
Places relatives across generations so patterns are easier to see.
Leaves room for names, roles, dates, and family notes.
Supports markers for marriage, separation, loss, conflict, or support.
Keeps the visual focused on the family story shown in the hero image.
Helps teams discuss the same structure before adding deeper notes.
Can be extended as new relatives or relationship details are added.
Map relatives, marriages, and family history across three generations using this photo-friendly genogram on Creately Clinical.
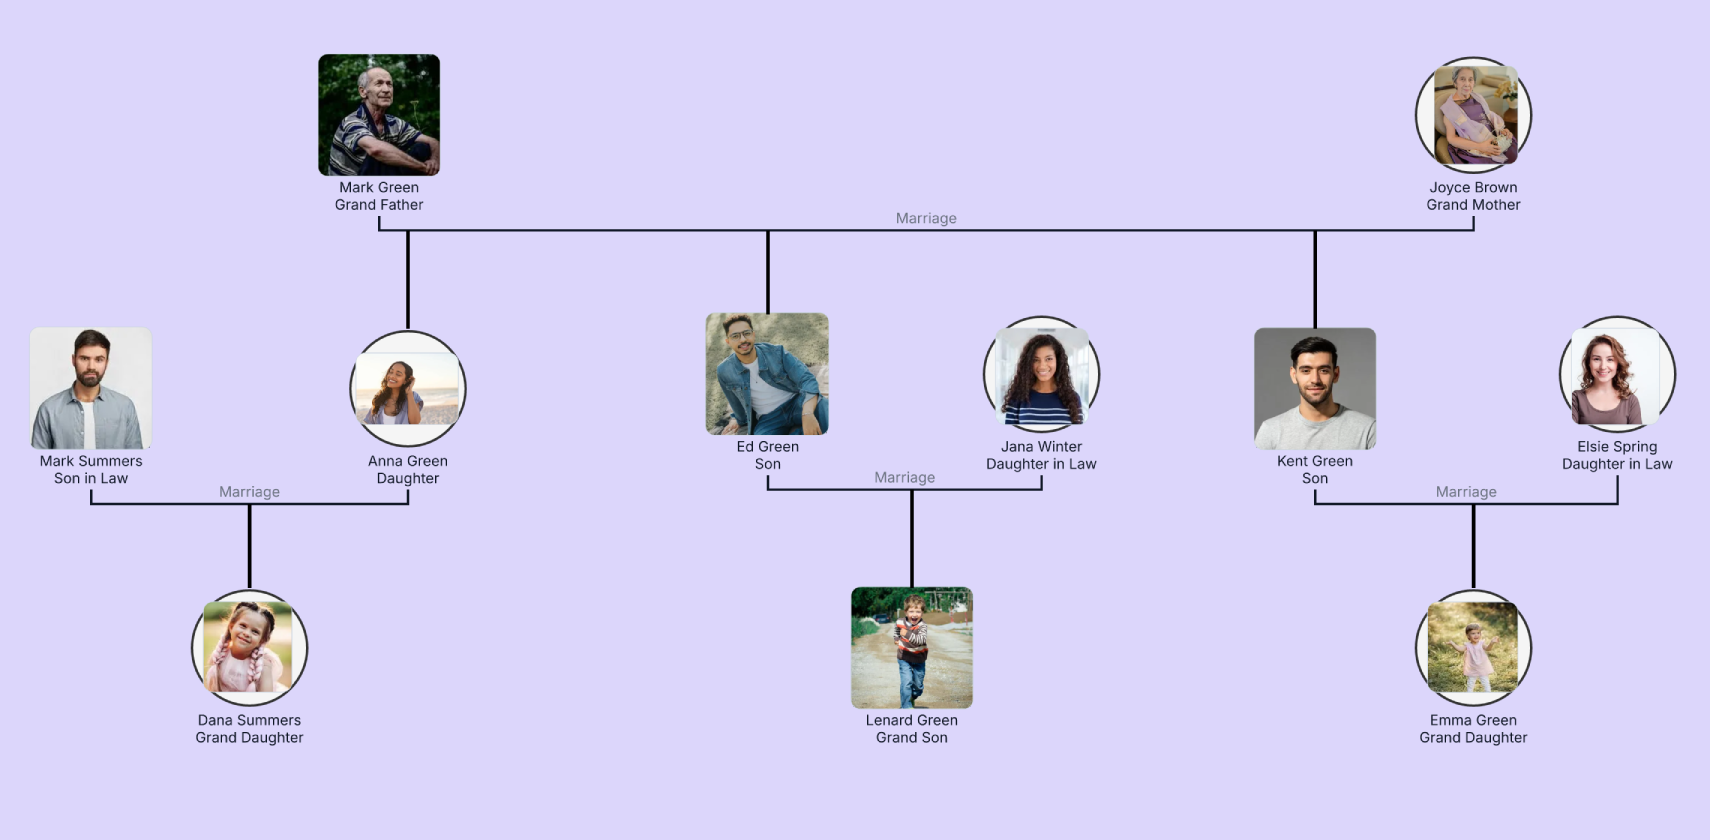
This family genogram combines a familiar photo-based family view with structured relationship lines, making relatives and generational connections easy to recognize and ready to enrich with additional family context.
The example maps 11 people across three generations. Mark Green and Joyce Brown appear as the grandparents. Their children—Anna, Ed, and Kent Green—form three second-generation branches with their partners Mark Summers, Jana Winter, and Elsie Spring.
The third generation includes Dana Summers, Lenard Green, and Emma Green. Photos make each person easy to identify, while the four marriage lines and parent–child connectors keep the family structure clear. Users can keep this accessible family-tree view or add genogram details such as dates, relationship dynamics, health history, cultural heritage, and life events.
This family genogram can help professionals, learners, researchers, and families organize relatives and generational connections in one clear view.
Establish family structure before adding relationship, health, caregiving, or case context.
Organize relatives, branches, dates, places, photos, and supporting notes.
Practice core genogram notation with an approachable three-generation example.
Create a recognizable visual record of relatives that can be discussed and updated together.
The diagram combines standard family shapes and relationship lines with optional profile photos and role labels.
Male family member
Female family member
Connects married partners
Connects children to the relevant parental union
Organizes Anna, Ed, and Kent as children of the first-generation couple
Helps viewers identify a family member quickly while retaining the underlying person shape
Describes the person’s place in the example, such as daughter, son-in-law, or granddaughter
Add names, dates, locations, occupations, cultural heritage, and notes as needed
Use this example when a family, educator, counselor, genealogist, or project team wants an approachable multigenerational family map that can grow in detail over time.
Add the grandparents or oldest relatives relevant to the map. Enter their names and connect partners using the appropriate relationship type.
Add their children on the next row, then include partners and descendants under the relevant unions. Keep everyone aligned by generation so the structure remains easy to scan.
Upload photos if you want a recognizable family view, and add roles, birth years, locations, occupations, or short notes. Use consistent image crops and label styles across the diagram.
Keep the clean General view for a family overview, or activate relevant fields and viewpoints for health, cultural, relationship, legal, social-work, timeline, or research information.
Creately Clinical supports family mapping with structured notation, flexible person profiles, collaborative editing, and report-ready outputs. For this family genogram, the Base field pack and standard genogram view provide a clear foundation that can be extended with specialized fields as the project develops.
A family tree primarily shows lineage. A genogram can use that same structure while adding relationship types, dates, health conditions, cultural background, emotional dynamics, life events, and other context relevant to the project.
No. Photos are optional. Keep them for a personal and recognizable family view, replace them with other images, or use the standard genogram symbols on their own.
Yes. Add parents, children, siblings, partners, and extended family in any direction. Creately’s auto-layout and navigation tools help keep larger family maps organized.
Creately’s Base fields capture names, dates, locations, occupations, cultural heritage, marital status, and notes. You can add specialized field packs, switch between eight viewpoints, collaborate in real time, generate a starting structure from text, and export the result as PDF, DOCX, PNG, JPEG, or SVG.
Edit the genogram, replace the Green family with your relatives, and add photos or profile details that make the map meaningful to your audience. Build each branch across the generations, then add the relationship and family-history context that supports your project.