Divorce & Blended Family Structure
Shows the main family members and relationships in this example.
Shows the main family members and relationships in this example.
Connects couples, parents, children, and siblings in a readable layout.
Places relatives across generations so patterns are easier to see.
Leaves room for names, roles, dates, and family notes.
Supports markers for marriage, separation, loss, conflict, or support.
Keeps the visual focused on the family story shown in the hero image.
Helps teams discuss the same structure before adding deeper notes.
Can be extended as new relatives or relationship details are added.
Map previous and current partnerships, children, households, and family relationships using this genogram on Creately Clinical.
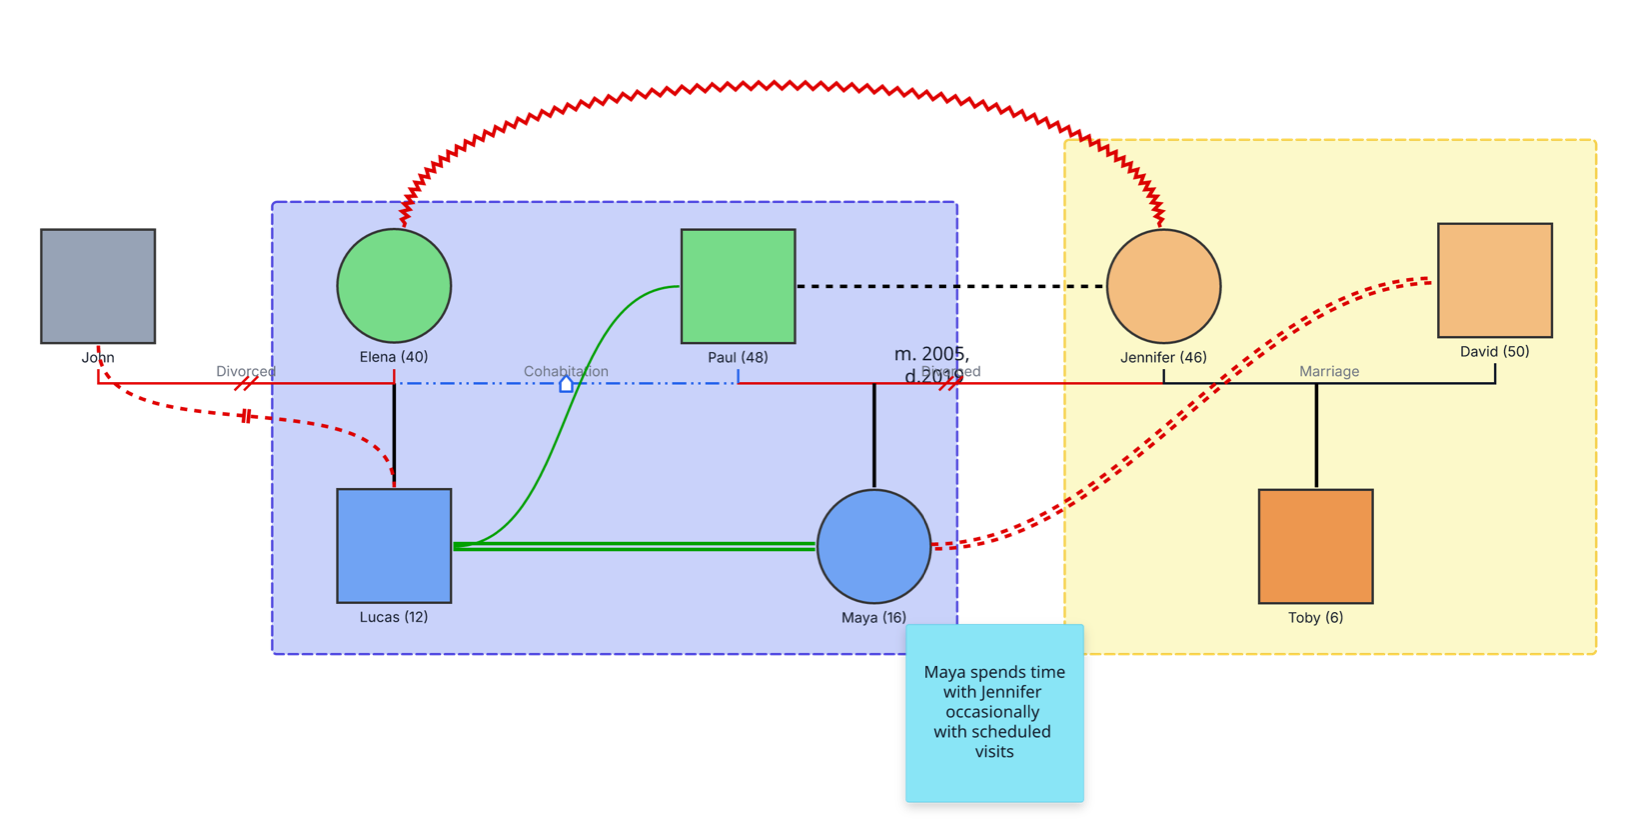
This divorce and blended family genogram brings previous partnerships, current households, children, and important family relationships into one clear view, helping families and professionals understand how the wider system works together.
The example maps eight people. John and Elena’s previous marriage is recorded as divorced, while Elena and Paul are shown in a cohabiting relationship. Paul’s 2005 divorce from Jennifer remains visible, and Jennifer’s current marriage to David forms the second household.
Two colored frames organize the households. Elena, Paul, Lucas, and Maya appear in one household group, while Jennifer, David, and Toby appear in the other. Relationship lines add emotional context, and a note records that Maya spends time with Jennifer occasionally through scheduled visits.
This divorce and blended family genogram can help professionals, learners, and families organize changing relationships and household arrangements in one clear view.
Explore previous partnerships, current households, family roles, and emotional relationships during sessions.
Document household membership, caregiving routines, contact arrangements, and support needs for coordinated review.
Create a shared visual for child-centered conversations about co-parenting and family transitions.
Map the wider blended-family system and update arrangements together as circumstances change.
Distinct partner lines preserve each relationship history, while household frames, emotional connections, and notes add practical family context.
Male family member
Female family member
Connects currently married partners
Records a dissolved marriage while preserving the family history
Connects partners who live together without being married
Connects a child to the relevant parent or parental union
Groups people who are shown as part of the same household
Records the type of emotional connection selected for two people
Adds information about visits, caregiving routines, or another relevant family arrangement
Use this example when a family, therapist, counselor, mediator, social worker, or care team needs a shared view of a blended family’s relationships and living arrangements.
Map each relevant marriage, divorce, cohabitation, or committed relationship. Include dates when they help readers understand the sequence of family changes.
Add biological, adoptive, foster, and step relationships using the appropriate parent–child notation. Place half-siblings under the parent they share so the family structure remains clear.
Use frames to show who currently lives together. Add concise notes for schedules, caregiving responsibilities, school routines, or regular contact between households when these details support the conversation.
Add close, supportive, distant, conflict, or other emotional relationship types that participants identify as meaningful. Review the completed map collaboratively and use it to recognize connections, coordinate support, and plan next steps.
Creately Clinical supports blended-family mapping with structured family relationships, therapy-focused fields, collaborative editing, and report-ready outputs. For this example, the Base and Family Therapy field packs help teams combine household structure with relationship and caregiving context.
Keep the previous union in the genogram and change its relationship type to divorce, then add the new partner and select the appropriate current relationship type. This preserves the family history while making the present structure easy to understand.
Yes. Use labeled or colored frames to group household members. The example uses two frames so readers can see the current living arrangements without losing the connections between households.
Creately supports distinct biological, adoptive, foster, and step parent–child relationships. Half-siblings can be connected through their shared parent, allowing both family branches to remain visible.
Creately provides dedicated relationship types for marriage, divorce, cohabitation, parent–child connections, and emotional dynamics. Base and Family Therapy fields can add dates, household context, support information, and notes, while collaborative editing helps families and authorized professionals refine the map together.
Edit the genogram, replace the example family with the people and relationships relevant to your situation, and organize current household groups with frames. Add contact routines and meaningful relationship lines, then use the completed genogram to support clearer conversations and coordinated family planning.