Basic Family Structure
Shows the main family members and relationships in this example.
Shows the main family members and relationships in this example.
Connects couples, parents, children, and siblings in a readable layout.
Places relatives across generations so patterns are easier to see.
Leaves room for names, roles, dates, and family notes.
Supports markers for marriage, separation, loss, conflict, or support.
Keeps the visual focused on the family story shown in the hero image.
Helps teams discuss the same structure before adding deeper notes.
Can be extended as new relatives or relationship details are added.
Map an extended family across five generations, including relatives, marriages, in-laws, children, and deceased family members.
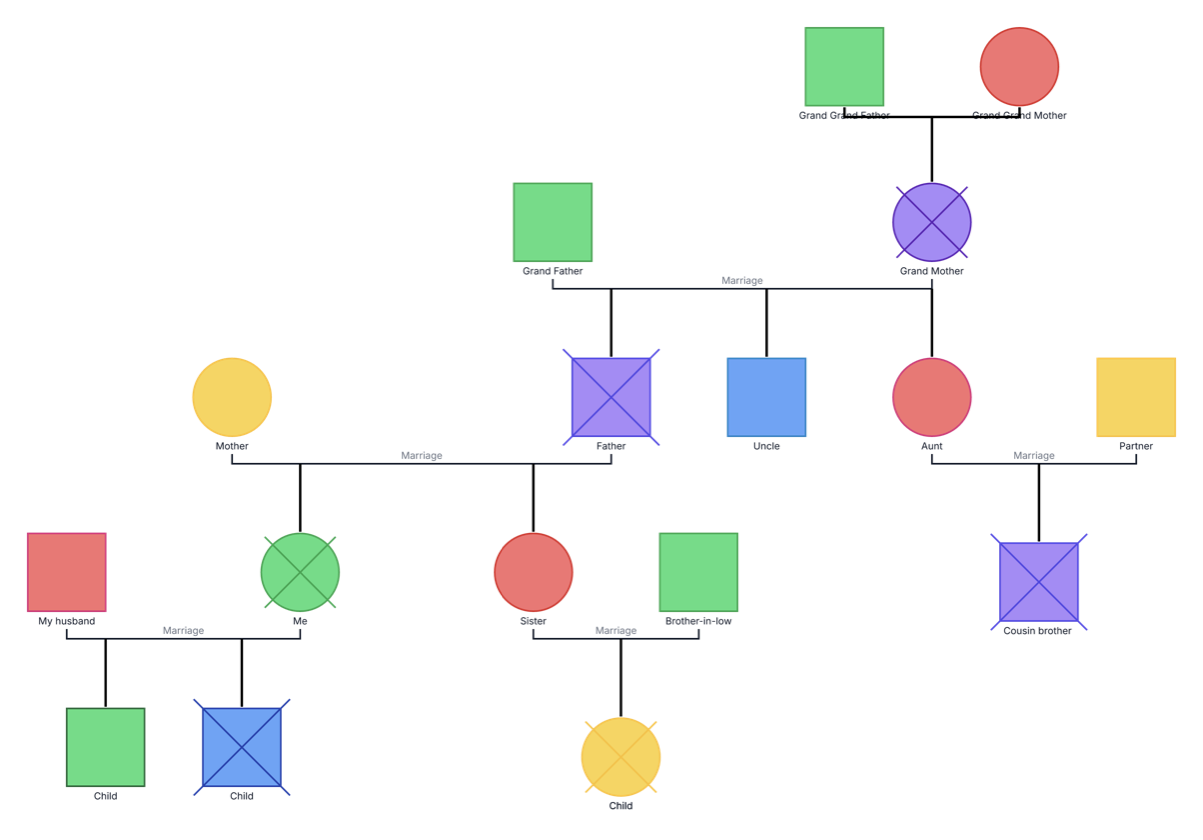
This basic family genogram maps 17 relatives across five generational levels using standard person, marriage, descent, and deceased notation.
The example extends from great-grandparents to children. Between those levels, it includes grandparents, a mother and father, an uncle, an aunt and her partner, the person labeled “Me” and her husband, a sister and brother-in-law, and a male cousin. Six people are marked as deceased with an X.
Although the example is called “basic,” its size is not minimal. The name is better understood as referring to its use of structural family notation without added emotional, medical, cultural, or social-work details. Families and practitioners can replace the role labels and simplify or expand the branches as needed.
This basic family genogram example helps professionals, learners, and families organize an extended family across several generations in one clear view.
Establish the extended family structure before adding relationship or clinical context
Document relatives, spouses, in-laws, and caregiving connections for shared case discussions
Practice structural notation across a larger multigenerational family example
Create a visual record of relatives and relationships that can be refined together
These six notation types form the visible structure of the example. The varied fill colors are not explained by a legend, so they should not be interpreted as medical, emotional, cultural, or generational data unless a color key is added.
Represents a male family member
Represents a female family member
Connects the five visibly labeled married couples
Connects a parent or parental unit to a child
Uses an X over a person's symbol to indicate that they are deceased
Connects people who share the same parent or parental unit
Identifies a person's place in the example, such as Mother, Uncle, Me, or Child
Use this Basic Family Genogram when you need an extended structural example that reaches from great-grandparents to children. Remove unnecessary branches if the intended discussion or assessment requires a smaller scope.
Decide who “Me” represents and whether all five generational levels are needed. Remove branches that do not support the purpose of the family map.
Add names or consistent family roles for the great-grandparents, grandparents, parents, aunts, uncles, siblings, cousin, spouses, in-law, and children. Use “Great-Grandfather,” “Great-Grandmother,” and “Male cousin” or “Cousin” instead of the draft's unclear labels.
Confirm that each of the five visible marriage lines and every parent-child or sibling branch connects the correct people. Add or change relationship types where the real family structure differs.
Keep an X only for people who are deceased, including the focal person if that is intentional. Remove decorative colors or add a clear legend before using color to communicate information.
Creately Clinical supports extended family mapping with clinical notation, fast relative creation, automatic layout, structured fields, and collaborative review.
For this example, the Base field pack and standard genogram view provide the clearest starting point. Quick-add shortcuts create a person and relationship together, while background layout processing helps keep a larger multigenerational map readable as branches expand.
“Basic” describes the type of information shown rather than the size of the diagram. The example uses family roles, marriages, descent lines, sibling branches, and deceased markers without adding specialized clinical data.
A family tree primarily records ancestry and lineage. A genogram can also show different relationship types, emotional dynamics, health history, significant events, and other patterns as the diagram develops.
Not in the supplied image. No color legend is provided, so the colors should be treated as decorative until a clear meaning is assigned. Do not infer health, relationship, identity, or generational information from them.
Change “Grand Great Father” to “Great-Grandfather,” “Grand Grand Mother” to “Great-Grandmother,” and “Cousin brother” to “Male cousin” or simply “Cousin.” Also confirm whether the X over “Me” is intentional.
Edit the genogram, identify the focal person, and replace the placeholder roles with the correct family members. Verify every marriage, descent line, and deceased marker before adding further context in Creately.