3-Generation Layout
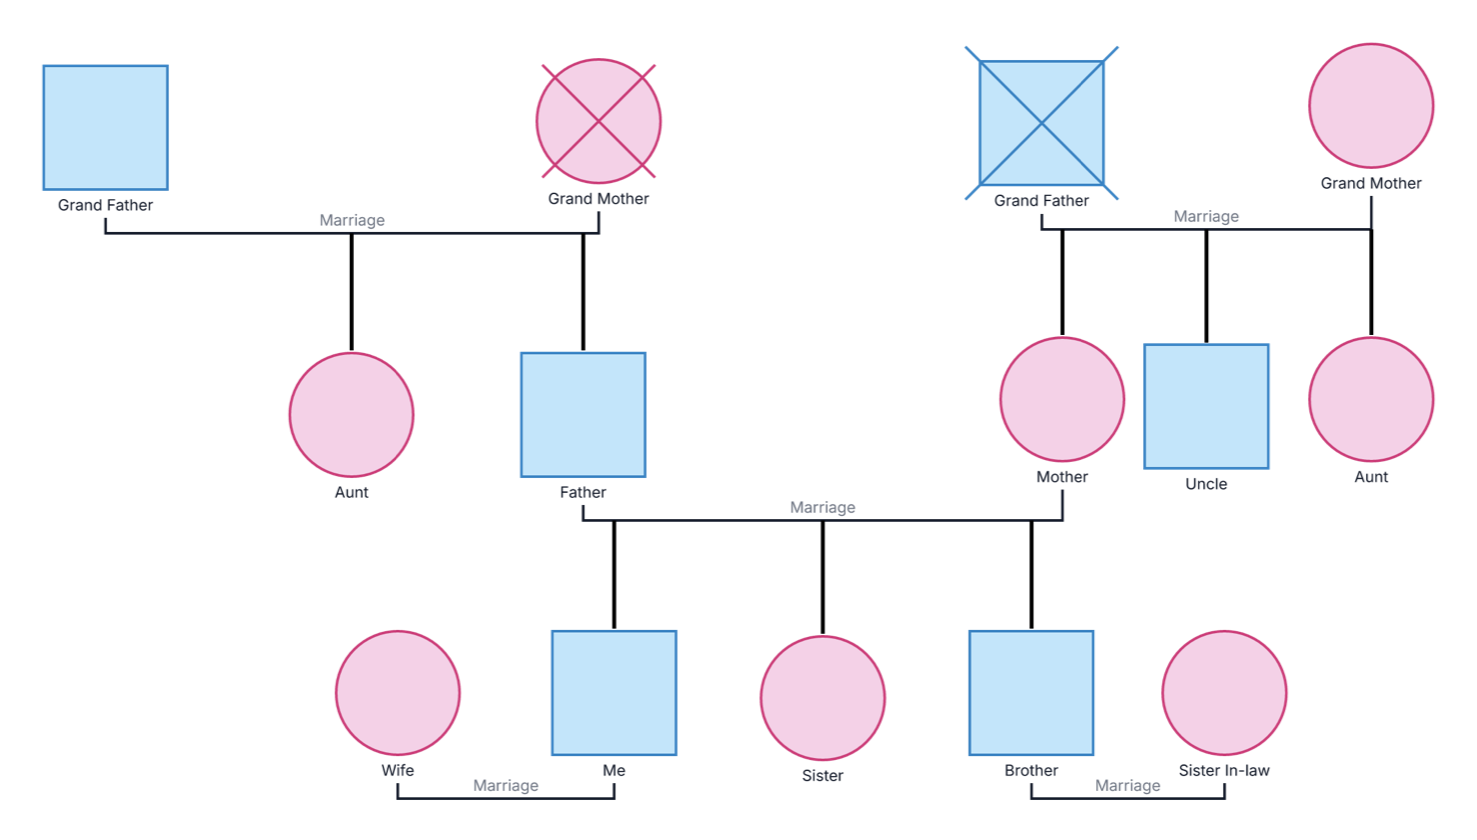
Shows grandparents, parents, and children in one clear family structure.
Shows grandparents, parents, and children in one clear family structure.
Places paternal and maternal grandparents at the top of the map.
Connects parents and siblings in the middle row of the genogram.
Maps children below the parent line for quick relationship tracing.
Uses partner lines to show the main couples across the family.
Shows descent lines that connect each generation to the next.
Keeps living and deceased family members visible in the diagram.
Leaves room to add names, roles, notes, and family context.
Visualize three generations of family structure and relationships using this genogram on Creately Clinical.
This example helps teams document family structure, relationships, caregiving patterns, and intergenerational context in one structured visual. It starts with family structure, then gives you room to add the context that matters for review, documentation, or discussion.
In Creately Clinical, this example works well when the goal is to capture the system clearly first and then extend it with relationship status, caregiving roles, conflict markers, losses, and other case-relevant notes. That keeps the diagram useful for individual work, team collaboration, and case-ready outputs without rebuilding the map from scratch.
This three-generation family genogram example can help professionals, learners, and families organize family information in one clear view.
Map family connections and add relationship notes to support conversations about family context
Document family members, caregiving roles, and support networks for shared case discussions
Practice genogram notation and explore how three generations connect using classroom examples
Create a visual record of relatives and relationships to discuss and update together
Six symbol types cover everything this example needs. All of them carry through to the more specialized genogram types, so learning them here pays off everywhere else.
Represents a male family member in the mapped system
Represents a female family member in the mapped system
Connects spouses or partners on the same generational row
Shows descent and keeps the family structure readable
Flags separation, conflict, loss, caregiving, or another status that matters to the case
Adds notes for relationship status, caregiving roles, conflict markers, losses, and other case-relevant details once the core family structure is confirmed
Visualize three generations of family structure and relationships using this genogram on Creately Clinical.
Start with the identified person, household, or central family unit so reviewers can orient themselves quickly.
Extend the map to the relatives, caregivers, or connected people needed to show the patterns this example is designed to highlight.
Keep notation consistent and add details such as the core household, extended family, and the notation that matters to the purpose only when the information is confirmed or supportable.
Use Creately Clinical to refine the diagram with AI-assisted drafting, collaborative editing, and report-ready outputs when the case, review, or handoff needs more depth.
Creately Clinical is built for professional, collaborative diagramming workflows rather than consumer family-tree use. The product is positioned around clinical notation, team collaboration, and structured reporting rather than casual family-tree creation.
For this example, the most relevant capability set is the Base and Family Therapy field packs, paired with the standard genogram view. The platform also supports 71 relationship subtypes across 9 categories with distinct visual encoding and 40+ person shape variants that auto-derive from the data, which helps keep each family map clinically legible instead of decorative.
It also supports AI-powered text-to-genogram generation from intake notes or family summaries, real-time collaboration, role-based sharing, and auto-save during live sessions, and clinical case-file export with the embedded diagram, profiles, union summaries, and a symbol legend. At the product level, Creately Clinical ships with 6 field packs with 66+ domain-specific fields, 8 starting examples including Tan-Miller clinical frameworks, and background layout processing for 200+ people.
A family tree primarily records ancestry and lineage. A genogram can also show relationship types, emotional dynamics, health history, significant life events, and other patterns across generations.
No. Add the family members and relationships you can confirm first. You can leave gaps visible and return to them as more information becomes available.
Yes. Creately supports specialized relationship types, person symbols, viewpoints, and field packs for documenting emotional dynamics, medical and genetic information, social context, and other relevant details.
Timing depends on the family size and how much information is available. The editable example provides a structured starting point, so you can create the initial family map quickly and add more detail over time.
Open the example, map the structure quickly, and use Creately Clinical for AI-assisted drafting, collaborative editing, and report-ready outputs. This keeps the first draft simple while making it easy to turn the same diagram into a stronger working artifact later.