3-Generation Cultural Identity View
Shows cultural identity and family structure in one visual map.
Shows cultural identity and family structure in one visual map.
Connects cultural background, migration, language, and identity across relatives.
Keeps family members and relationship lines easy to follow.
Leaves space for traditions, values, affiliations, and lived context.
Helps compare experiences across branches of the family.
Supports notes about belonging, distance, conflict, or adaptation.
Gives teams a shared view for cultural assessment or discussion.
Can be updated as family stories and cultural details become clearer.
Visualize cultural identities, mixed heritage, and family branches across three generations in one editable genogram.
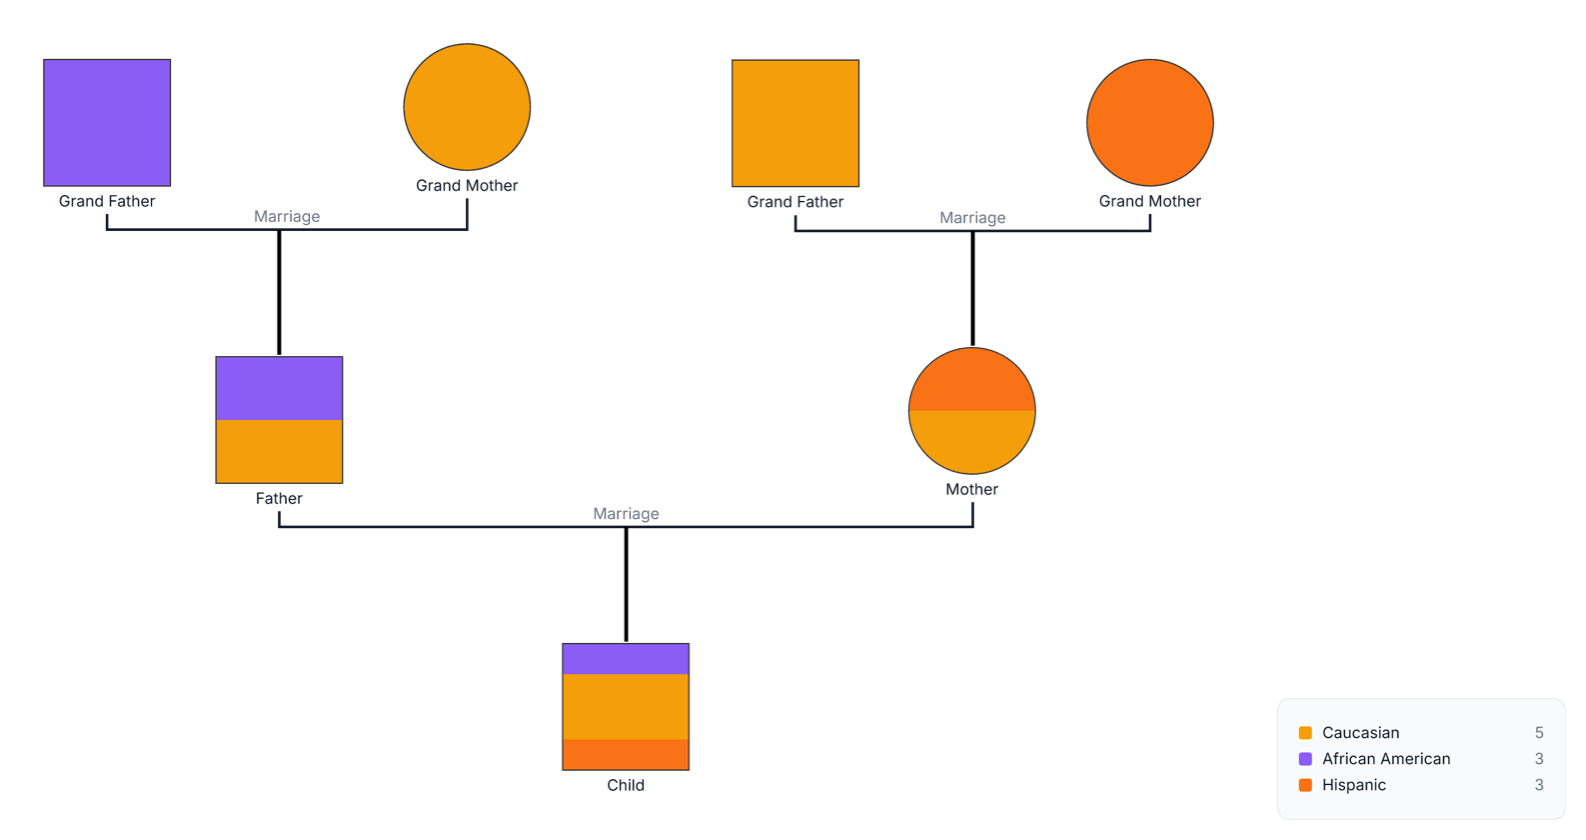
This three-generation cultural genogram combines a simple family structure with color-coded cultural identities, making heritage and mixed family backgrounds easy to explore across generations.
The example contains seven people. Two grandfathers and two grandmothers form the oldest generation, followed by a father and mother, with one child in the youngest generation. Three partner relationships connect the two grandparent couples and the parents.
The legend uses three cultural categories: Caucasian, African American, and Hispanic. It records five Caucasian, three African American, and three Hispanic indicators across the family. Single-color symbols represent one category, while divided symbols show people associated with more than one heritage. The child combines all three colors, creating a clear visual of cultural inheritance across both family branches.
This three-generation cultural genogram helps professionals, learners, researchers, and families explore how identity and heritage connect across family branches.
Explore identity, belonging, family narratives, and intergenerational cultural influences.
Document language, migration, community ties, and cultural context that may shape care.
Practice culturally responsive genogram notation and study patterns across generations.
Create a shared record of heritage, traditions, values, and mixed identities.
Standard family symbols establish the structure, while color fills represent the cultural identities defined in the legend.
Male family member
Female family member
Marriage or partner relationship
Parent–child relationship
One cultural identity represented in the legend
More than one cultural identity associated with the person
Defines the heritage or cultural categories used in the map
Grandparents, parents, or children at the same family level
Use this example when family structure and cultural identity need to be explored together in a clear, accessible format.
Add the grandparents, parents, children, partners, and family branches relevant to the cultural history you want to explore.
Agree on respectful, self-described identity terms and assign a distinct color to each category in the legend.
Divide a person symbol when more than one identity is relevant, and add notes for how the person describes, prioritizes, or experiences those identities.
Record languages, migration stories, traditions, food, religion, community ties, values, discrimination, belonging, celebrations, and practices carried forward or changed.
Creately Clinical helps turn this cultural overview into a structured, collaborative family record. Use its clinical notation and flexible views to keep identity language, context, and sources connected to the people and relationships they describe.
Use the terms each person chooses for themselves. Add notes when nationality, ethnicity, race, language, religion, migration, region, or community affiliation are important to how that identity is understood.
Not necessarily. They can simply show that multiple cultural identities are relevant. Use percentages only when they are meaningful to the family and clearly defined in the legend.
Yes. Add dates or notes to show shifts in self-identification, language use, community participation, migration, cultural practice, or sense of belonging.
Custom fields, notes, color categories, and relationship markers can keep family and cultural context organized. Shared editing, comments, version history, and exports support collaborative reflection and ongoing updates.
Edit the genogram to add your family, define the cultural legend, and create a respectful shared visual of heritage, identity, and traditions across three generations.