Multi-Generation Cultural Identity View
Shows cultural identity and family structure in one visual map.
Shows cultural identity and family structure in one visual map.
Connects cultural background, migration, language, and identity across relatives.
Keeps family members and relationship lines easy to follow.
Leaves space for traditions, values, affiliations, and lived context.
Helps compare experiences across branches of the family.
Supports notes about belonging, distance, conflict, or adaptation.
Gives teams a shared view for cultural assessment or discussion.
Can be updated as family stories and cultural details become clearer.
Trace multiple cultural backgrounds and identity influences across four family generations using this cultural genogram on Creately Clinical.
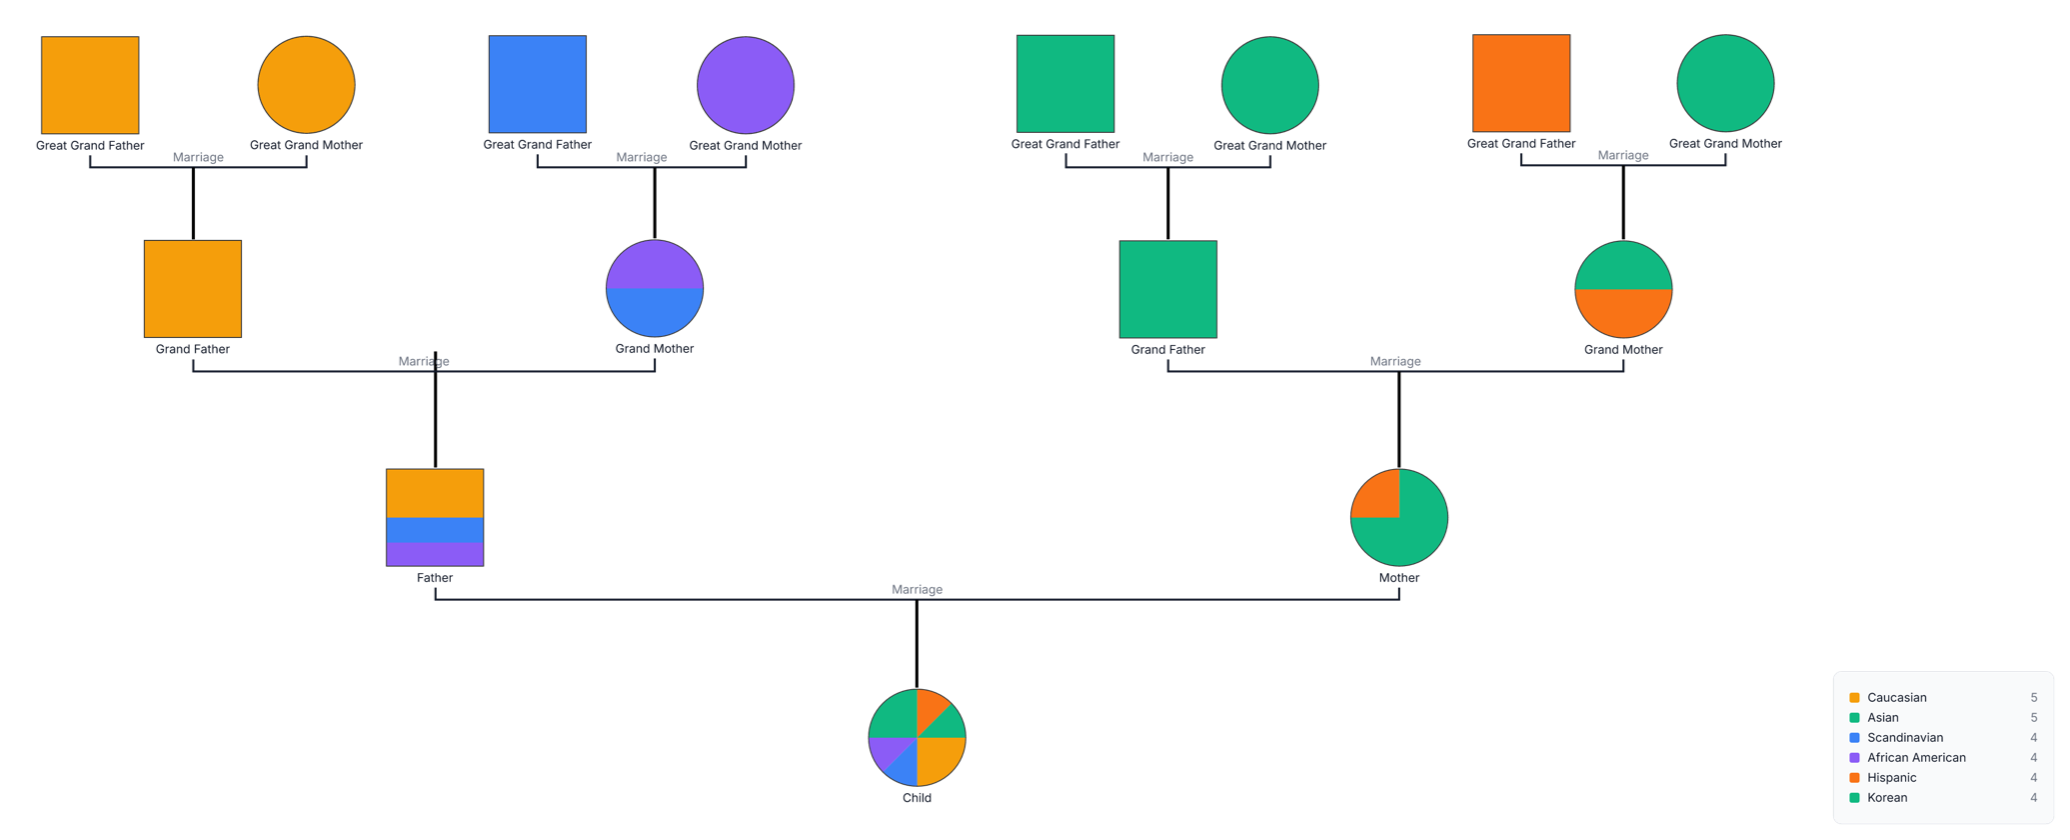
This multi-generation cultural genogram uses full, split, and multi-section symbols to show how six cultural backgrounds connect across four generations of one family.
The example begins with four great-grandparent couples, followed by two grandparent couples, the parents, and their child. Each great-grandparent is represented by one color. The grandparent symbols combine colors from the first generation, while the father, mother, and child bring several family backgrounds together in increasingly detailed sections.
The legend identifies Caucasian, Asian, Scandinavian, African American, Hispanic, and Korean categories. It reports five appearances each for Caucasian and Asian and four appearances each for Scandinavian, African American, Hispanic, and Korean. These totals count category appearances across the symbols, allowing one person to be represented in more than one category.
This multi-generation cultural genogram can help professionals, researchers, learners, and families organize complex cultural identities across generations.
Explore identity, belonging, language, migration, community, and intergenerational family context.
Map several cultural influences and the traditions or supports connected with them.
Examine detailed cultural context across four family generations.
Create a rich visual story using their preferred identity terms and meanings.
Standard genogram shapes show family structure, while color sections represent the cultural categories defined in the legend.
Male family member
Female family member
Marriage or partner relationship
Parent–child relationship
One cultural background recorded for that person
Two or more backgrounds represented together
Several cultural backgrounds represented together
Defines the cultural category assigned to each color
Use this example when a family’s cultural story draws on several backgrounds and multiple generations.
Add the focus person, parents, grandparents, great-grandparents, partners, and other relatives relevant to the family story.
Choose a distinct color for each background and label it using the identity terms preferred by the people represented.
Use full, split, or multi-section fills to show the cultural identities each person wishes to include in the genogram.
Record languages, places, migration experiences, traditions, values, communities, significant events, and meaningful identity changes.
Creately Clinical supports detailed cultural genograms with identity fields, cultural views, flexible visual encoding, collaborative reflection, and report-ready outputs.
The totals count each appearance of a cultural category. Since one person can have several colored sections, that person may contribute to more than one category total.
Yes. Split and multi-section symbols are designed to represent several backgrounds together while keeping the family structure easy to follow.
You can add languages, migration histories, places, traditions, values, communities, celebrations, identity changes, and the personal meaning each person gives to their background.
Culture-focused fields, contextual notes, legends, and views can keep identity information connected to each person. Shared editing, comments, version history, and exports support collaborative exploration and documentation.
Edit the genogram to map four generations, personalize the cultural legend, and create a rich visual story of identity and family connection.