Cultural Identity View
Shows cultural identity and family structure in one visual map.
Shows cultural identity and family structure in one visual map.
Connects cultural background, migration, language, and identity across relatives.
Keeps family members and relationship lines easy to follow.
Leaves space for traditions, values, affiliations, and lived context.
Helps compare experiences across branches of the family.
Supports notes about belonging, distance, conflict, or adaptation.
Gives teams a shared view for cultural assessment or discussion.
Can be updated as family stories and cultural details become clearer.
Visualize cultural heritage, identity, relationships, and family influences across generations with an editable cultural genogram.
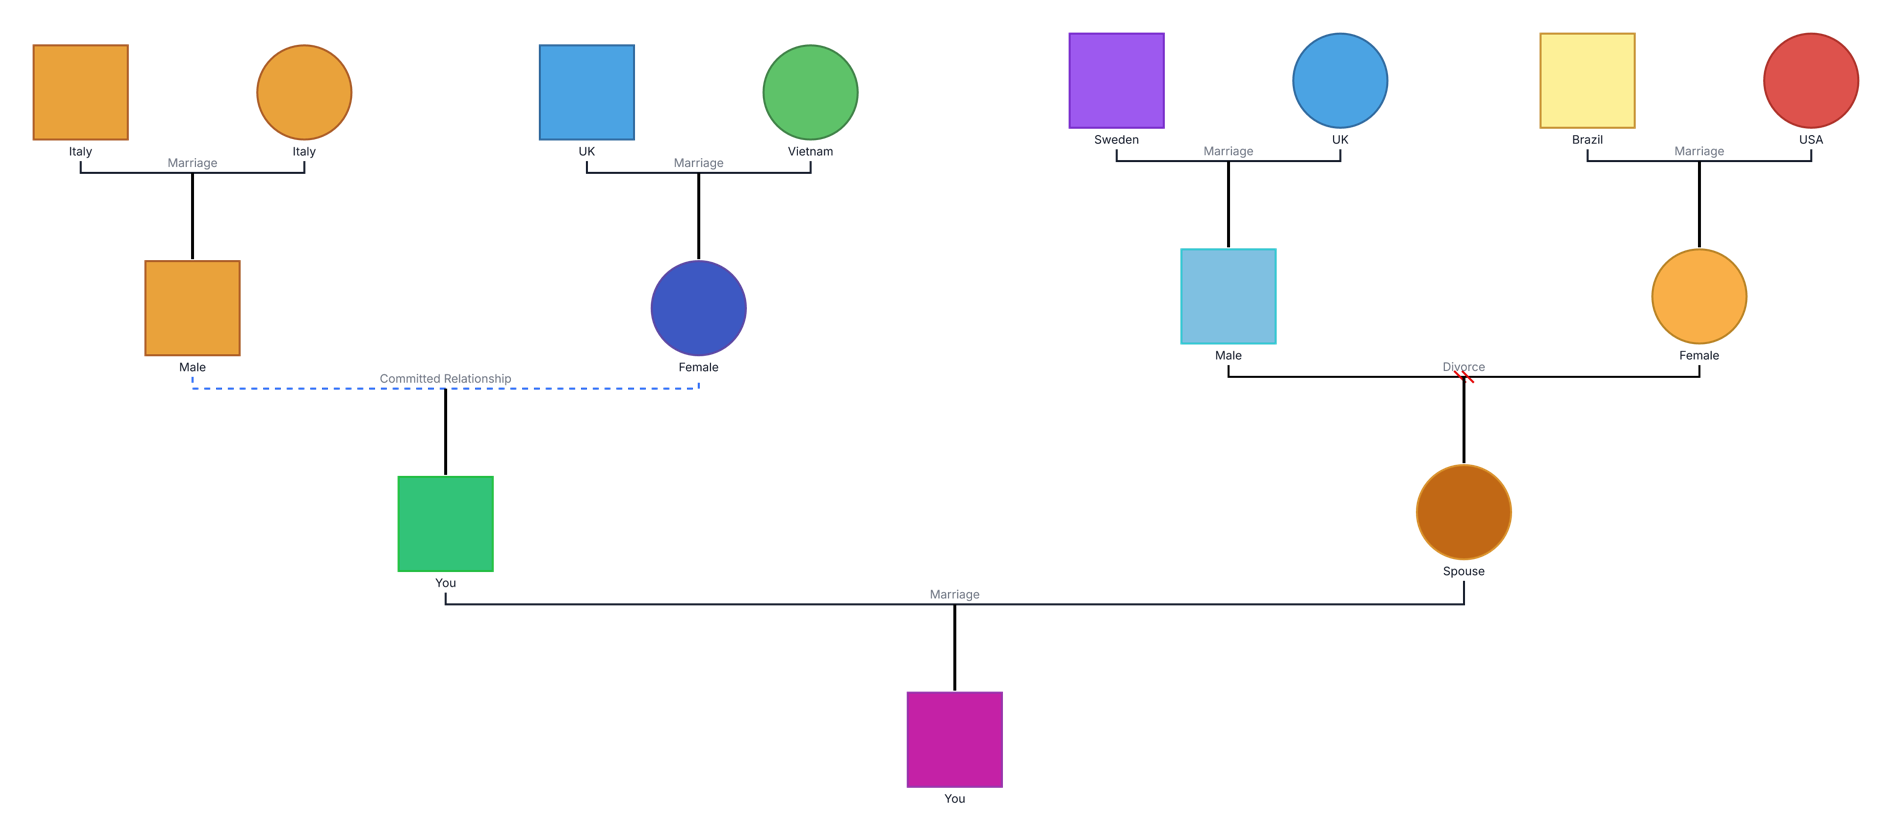
This cultural genogram brings heritage, family structure, and relationship history into one visual, helping people explore how multiple cultural influences contribute to identity across generations.
The example places 15 people across four generational rows. Six labels—Italy, the UK, Vietnam, Sweden, Brazil, and the USA—introduce distinct cultural or national reference points, while different fill colors make the branches and identities easy to compare visually.
Marriage, committed-relationship, and divorce connections add relationship context alongside the cultural coding. Two focus points labeled “You” make the example useful for tracing the different family lines and cultural influences that contribute to an individual’s story. All colors and labels can be adapted to reflect how family members identify themselves.
This cultural genogram example helps professionals, learners, and families organize multiple heritage influences, family relationships, and identity context in one clear view.
Explore identity, belonging, traditions, and intercultural family experiences
Add cultural context to family, migration, support, and service conversations
Practice culturally responsive mapping and examine continuity or change across generations
Build a shared visual of heritage, relationships, traditions, and evolving identities
Family symbols and partner lines establish the structure, while cultural labels and the color palette distinguish the heritage information selected for the map.
Male family member
Female family member
Connects married partners
Shows a committed partnership using the relationship style selected in the example
Records the end of a marriage while preserving the family connection
Connects a child to the relevant parental union
Identifies the country, heritage, or cultural group recorded for a person or branch
Visually distinguishes heritage tags in the Cultural viewpoint; the legend should define every color used
Use this example when a family or professional wants to see how several cultural backgrounds and relationship histories come together across generations.
Begin with the focus person and add the relatives needed to understand their cultural story. Connect marriages, partnerships, parents, children, and other significant relationships.
Invite each person to describe their heritage in their own words. Add more than one cultural tag where relevant, and distinguish heritage from citizenship, nationality, birthplace, and current location when the conversation calls for it.
Include languages, traditions, religion or spirituality, migration experiences, community ties, identity changes, and meaningful family events. Use brief notes that reflect the family’s own understanding.
Use the Cultural viewpoint to assign consistent colors to heritage tags. Add a clear legend, review the map with family members or collaborators, and explore patterns of continuity, blending, and change.
Creately Clinical supports multigenerational cultural mapping with structured heritage fields, a dedicated Culture view, relationship notation, collaborative editing, and flexible exports.
For this example, the Base field pack is the most relevant capability set because it includes cultural heritage, religion, location, and notes alongside core person data. The Culture view can color-code recorded heritage tags so several family influences are easier to review without changing the underlying genogram.
Culture can include shared heritage, language, traditions, values, community, and lived experience. Nationality and birthplace may contribute to that story, but they do not automatically define how a person identifies. Record each concept separately when that distinction matters.
Yes. Creately supports multiple cultural heritage tags for one person. This helps represent bicultural, multicultural, blended, and evolving identities without reducing someone to a single category.
Colors represent the cultural categories assigned to heritage tags in the example. Customize them to match the family’s self-identified backgrounds and include a legend so every color is easy to interpret.
Creately’s Base fields include cultural heritage, religion, location, and notes. The Cultural viewpoint can automatically color-code up to nine heritage categories, while AI-assisted text import can extract cultural details from a written family description for review and refinement.
Edit the genogram, replace the example categories with the cultural backgrounds relevant to your family or project, and add the relationships and experiences that shape identity. Apply the Cultural viewpoint, create a clear legend, and use the completed map to guide thoughtful conversations about heritage and belonging.