Cross-Cultural Research Family Identity View
Shows cultural identity and family structure in one visual map.
Shows cultural identity and family structure in one visual map.
Connects cultural background, migration, language, and identity across relatives.
Keeps family members and relationship lines easy to follow.
Leaves space for traditions, values, affiliations, and lived context.
Helps compare experiences across branches of the family.
Supports notes about belonging, distance, conflict, or adaptation.
Gives teams a shared view for cultural assessment or discussion.
Can be updated as family stories and cultural details become clearer.
Compare cultural heritage across three generations and organize family research data with an editable cross-cultural genogram.
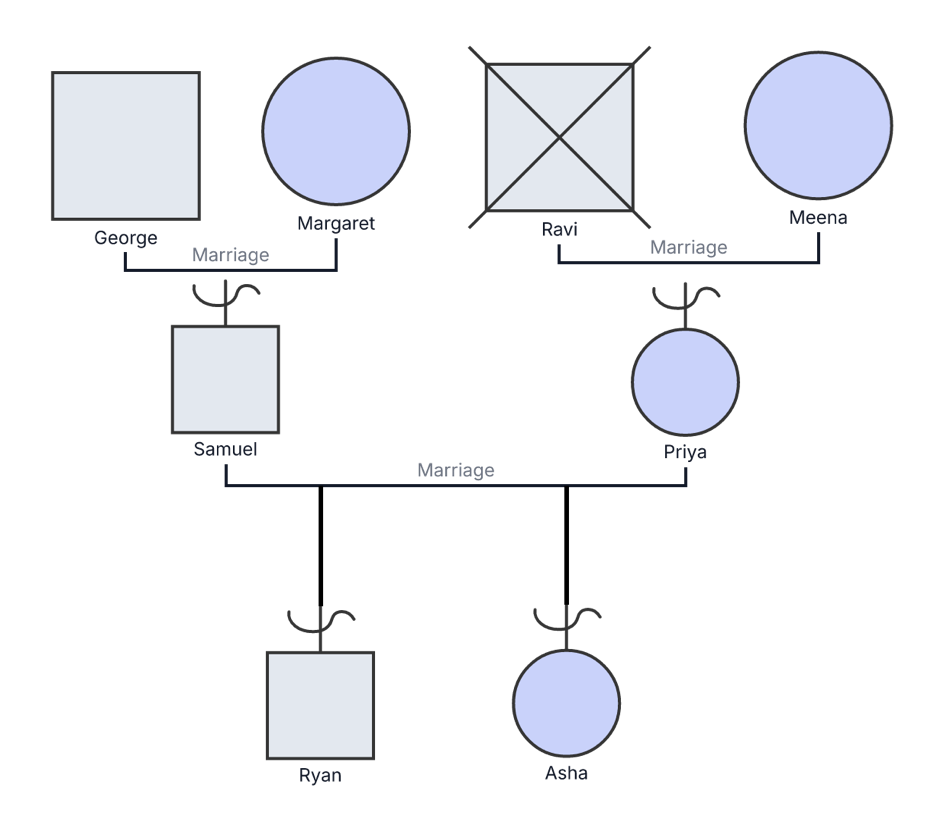
This cross-cultural research genogram brings two family branches into one consistent visual, making it easier to explore how heritage, identity, migration, language, and family experiences connect across generations.
The example maps eight people across three generations. George and Margaret form one grandparent branch, while Ravi and Meena form the other. Their children, Samuel and Priya, are connected as partners, and Ryan and Asha make up the third generation. Ravi’s deceased marker preserves an important part of the family history.
The clear structure provides a research-ready starting point. Researchers can add each person’s self-identified cultural heritage and pair it with consistent fields for location, religion, language, migration history, research IDs, consent, sources, collection dates, and data quality. This supports thoughtful comparison without assuming that names, appearance, or family position define a person’s identity.
This cross-cultural research family genogram helps researchers and multidisciplinary teams organize family structure, cultural context, and study data in one clear view.
Combine family relationships with consistent cultural, consent, source, and data-quality fields
Explore heritage, migration, language, identity, continuity, and change across generations
Practice culturally responsive interviewing, coding, and structured family-data collection
Review one shared family map while maintaining consistent study definitions and metadata
Standard genogram notation maps the family, while cultural heritage tags and structured research fields can add the context required for a study.
Male family member
Female family member
Deceased family member
Connects married partners
Connects a child to the relevant parental union
Records a person’s self-identified cultural background; multiple tags can be added when relevant
Applies a consistent palette to heritage tags so cultural patterns can be viewed across the family
Capture details such as research ID, cohort, consent status, data source, collection date, follow-up status, and data quality
Use this example when researchers, educators, or multidisciplinary teams want to study family structure alongside cultural context in a clear and consistent format.
Add the people relevant to the study and connect partners, parents, children, and siblings. Include the generations needed to address the research question.
Add self-identified heritage, language, religion, birthplace, location, migration experiences, and other study variables that participants consider meaningful. Use more than one heritage tag where appropriate.
Apply the same data framework across participants. Record research IDs, cohort assignments, consent status, data sources, collection dates, follow-up status, and data-quality ratings according to the study protocol.
Switch to the Cultural viewpoint to review heritage patterns and the Research Quality viewpoint to check sources, completeness, and data quality. Invite authorized collaborators to review the map and prepare it for analysis or reporting.
Creately Clinical supports cross-cultural research with structured heritage and study fields, cultural visualization, collaborative review, data-quality tools, and reusable exports.
For this example, the Base and General Research & Genealogy field packs are the most relevant capability set. They can record cultural heritage, location, religion, research ID, consent, data quality, sources, collection details, and notes while the family structure remains available in the same workspace.
You can combine family relationships with self-identified cultural heritage, language, religion, location, migration history, and study-specific notes. Creately’s General Research fields can also capture research IDs, cohorts, consent, data sources, collection dates, follow-up status, and data quality.
Yes. Add multiple heritage tags when that reflects how the person identifies. This makes it possible to represent bicultural, multicultural, and changing identities more accurately across generations.
Agree on a study codebook, apply the same field definitions across participants, and include a clear legend for any custom categories. Shared editing and structured fields help collaborators review entries using one consistent framework.
The Cultural viewpoint color-codes cultural heritage tags, while the Research Quality viewpoint surfaces data quality, source attribution, and completeness. Teams can collaborate on the same genogram and export structured data for further analysis and reporting.
Edit the genogram, replace the example family with your study participants, and add the cultural and research fields that match your protocol. Use the Cultural and Research Quality viewpoints to compare patterns, review the dataset with collaborators, and build a clear visual foundation for analysis.