Bi-Cultural Identity View
Shows cultural identity and family structure in one visual map.
Shows cultural identity and family structure in one visual map.
Connects cultural background, migration, language, and identity across relatives.
Keeps family members and relationship lines easy to follow.
Leaves space for traditions, values, affiliations, and lived context.
Helps compare experiences across branches of the family.
Supports notes about belonging, distance, conflict, or adaptation.
Gives teams a shared view for cultural assessment or discussion.
Can be updated as family stories and cultural details become clearer.
Map two self-identified cultural heritages across three generations with an editable bicultural family genogram.
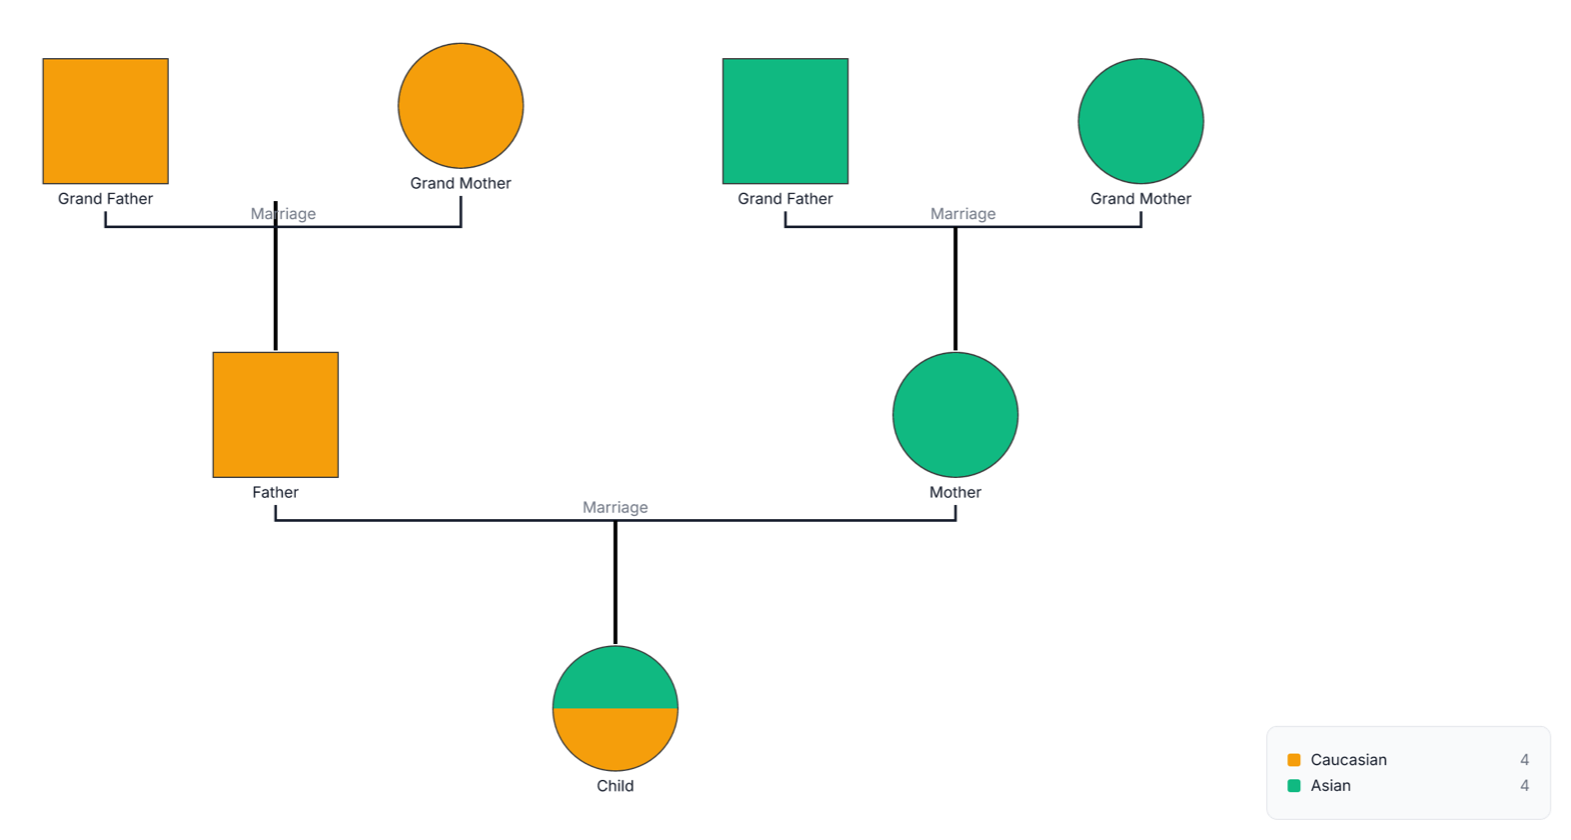
This bi-cultural genogram maps two family heritage backgrounds across three generations. A split-color symbol shows that the child identifies with or is connected to both sides of the family.
The example includes two sets of grandparents, two parents, and one child. Orange distinguishes one side of the family and green distinguishes the other. The colors help readers follow heritage across generations while the squares, circles, marriage lines, and parent–child lines preserve the family structure.
The supplied legend uses “Caucasian” and “Asian,” but these are broad racialized categories rather than precise cultural identities. Replace them with the family’s own terms—for example, specific national, ethnic, linguistic, regional, Indigenous, diasporic, or mixed identities. Record identity based on what each person says, not what their color, name, appearance, birthplace, or relatives might suggest.
This bi-cultural genogram example helps professionals, learners, and families organize two cultural heritages and their family connections in one clear view.
Explore identity, belonging, family traditions, and cultural influences across generations
Document self-identified heritage, migration context, language, and community connections
Practice combining family structure with a clear, written cultural legend
Discuss mixed heritage, continuity, differences, and changes in identification together
Squares, circles, and family lines follow basic genogram conventions. The orange, green, and split fills are custom visual encodings and need a written legend.
Male family member
Female family member
Connects married partners
Connects parents or a parental unit to a child
One self-identified cultural heritage
A second self-identified cultural heritage
Connection to, ancestry from, or identification with both heritages, as defined by the person
Names the cultures represented by the custom colors
Use this example when two cultural heritages are relevant to understanding a person's family context. Introduce cultural questions respectfully, explain why the information is being collected, and allow people to describe identity in their own words.
Add the child, parents, and both sets of grandparents. Confirm how each person is related before adding cultural information.
Record the cultural, ethnic, national, linguistic, regional, or other heritage terms each person uses. Do not assume that everyone on one family branch shares the same identity.
Assign clear colors to the two heritages and replace the generic Caucasian and Asian labels with specific, self-identified terms. Keep text labels so the diagram remains understandable without color.
When relevant and consented to, add language, migration experiences, traditions, community ties, discrimination, cultural strengths, or changes in identification. Review the finished genogram with the person or family.
Creately Clinical supports culturally informed family mapping with structured heritage fields, a dedicated Culture view, relationship notation, collaborative review, and flexible exports.
For this example, the Base field pack is the most relevant capability set because it includes cultural heritage, location, language-related context in notes, and other core person details. The Culture view can color-code people by recorded cultural heritage while preserving the same underlying family structure.
It indicates connection to both cultural heritages represented in the legend. Because identity is personal and may change over time, confirm what the split symbol means to the individual instead of treating it as a fixed percentage.
Usually not. Both labels are too broad for a culturally meaningful genogram, and Caucasian is often ambiguous or outdated. Replace them with the specific terms the people or family use for themselves.
No. Ancestry may be relevant, but cultural identity can also involve language, upbringing, community, migration, nationality, lived experience, and personal identification. Family members with similar ancestry may identify differently.
Creately's Genogram product guide includes cultural heritage tags and notes in the Base field pack. The Culture viewpoint can help visualize heritage information while the underlying family structure and person records remain available for other views.
Edit the genogram, replace the generic legend with the family's self-identified cultural terms, and confirm the three-generation structure. Add only the cultural context relevant to the purpose of the genogram and review the result with the people involved.