Population Health Research Network
Shows the people, groups, and organizations connected to the case.
Shows the people, groups, and organizations connected to the case.
Clarifies who provides support, services, influence, or coordination.
Keeps family members visible within the wider community system.
Maps how help, referrals, and relationships move through the network.
Identifies schools, healthcare, faith, nonprofit, or social-service links.
Leaves room to mark strong, weak, or strained connections.
Helps teams discuss the same community picture during planning.
Can be updated as services, roles, or contacts change.
Organize multigenerational family structure and standardized health-condition data for population health research using this genogram on Creately Clinical.
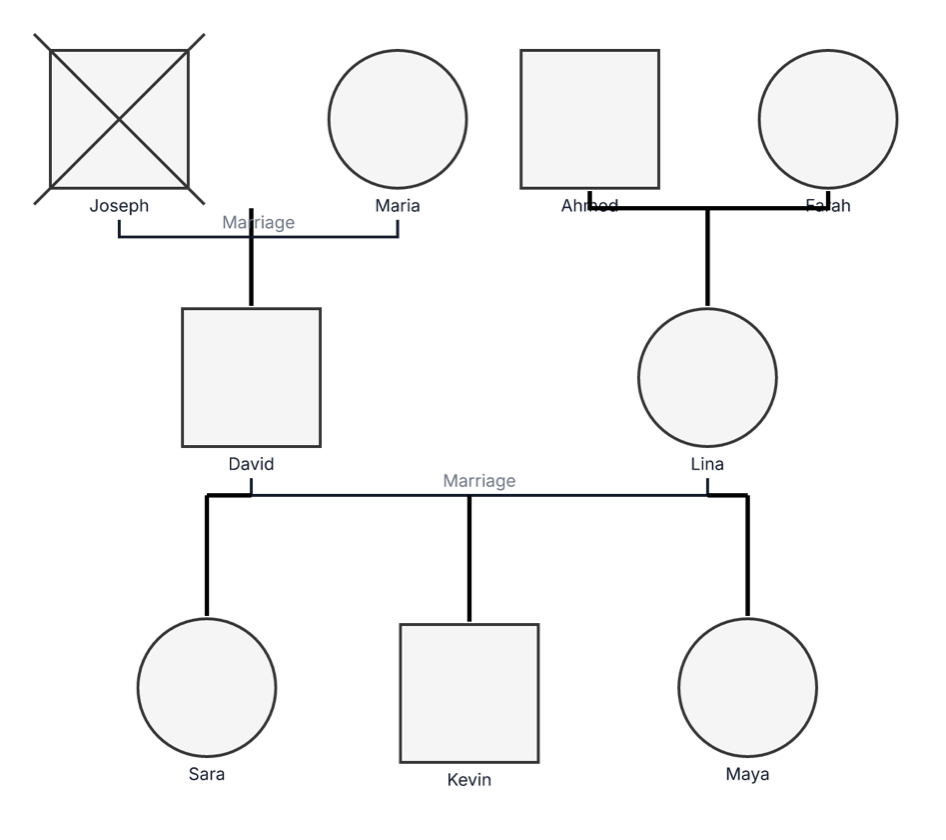
This population health research genogram provides a repeatable visual structure for recording family relationships and comparing selected health conditions across generations and cases.
The example maps nine people across three generations. Joseph, Maria, Ahmed, and Leah appear in the oldest generation; David and Lina form the next family level; and Sara, Kevin, and Maya appear in the youngest generation. Joseph is marked deceased.
Colored health overlays correspond with a four-category legend for hypertension, type 2 diabetes, asthma, and heart disease. Hypertension appears most frequently in the example, while the remaining conditions provide additional variables for comparison. The compact structure makes the example useful as one case in a wider family, community, cohort, or longitudinal research workflow.
This population health research genogram can help research teams organize family health variables consistently across cases and study waves.
Compare standardized conditions, exposures, outcomes, and family context across cases.
Maintain stable identifiers, sources, collection dates, confidence, and coding consistency.
Review multigenerational chronic-condition patterns in a shared visual format.
Build teaching datasets and practice repeatable family-health coding.
Standard family symbols establish the structure, while health overlays and a shared legend support consistent coding across research cases.
Male participant or family member
Female participant or family member
Deceased participant or family member
Marriage or partner relationship
Family members grouped at the same generational level
Condition recorded in the research legend
More than one coded condition associated with a person
Hypertension, type 2 diabetes, asthma, and heart disease categories
Use this example when research teams need a structured visual for comparing family health information across participants, cases, or time points.
Agree on the family levels, conditions, demographics, exposures, outcomes, and time points that will be recorded across every case.
Use study identifiers where appropriate and map the relatives, partner relationships, generations, and living status relevant to the protocol.
Add condition markers using the same legend and record diagnosis status, age of onset, source, collection date, and confidence level in structured fields.
Review completeness and coding consistency, then use the repeated structure to compare patterns across families, groups, locations, or study waves.
Creately Clinical supports population-health research with medical and research fields, quality-focused views, collaborative review, version history, and structured exports.
You can include study IDs, demographics, diagnoses, age of onset, exposures, outcomes, dates, source documentation, confidence indicators, household information, and variables defined in the research protocol.
Yes. Keep stable participant identifiers and add dated observations, study-wave fields, or versioned copies so changes can be compared over time.
Use de-identified study IDs, apply your organization’s access controls, and follow the approved protocol for collecting, storing, sharing, exporting, and retaining research information.
Custom fields, notes, visual categories, and reusable legends can keep cases consistently structured. Shared editing, comments, version history, and exports support research review, collaboration, and organized study outputs.
Edit the genogram to define your study variables, add de-identified family cases, and create a consistent visual dataset for population health and longitudinal research.