Nonprofit Stakeholder Mapping Community Network
Shows the people, groups, and organizations connected to the case.
Shows the people, groups, and organizations connected to the case.
Clarifies who provides support, services, influence, or coordination.
Keeps family members visible within the wider community system.
Maps how help, referrals, and relationships move through the network.
Identifies schools, healthcare, faith, nonprofit, or social-service links.
Leaves room to mark strong, weak, or strained connections.
Helps teams discuss the same community picture during planning.
Can be updated as services, roles, or contacts change.
Map nonprofit staff, volunteers, funders, partners, services, and community-support relationships using this stakeholder genogram on Creately Clinical.
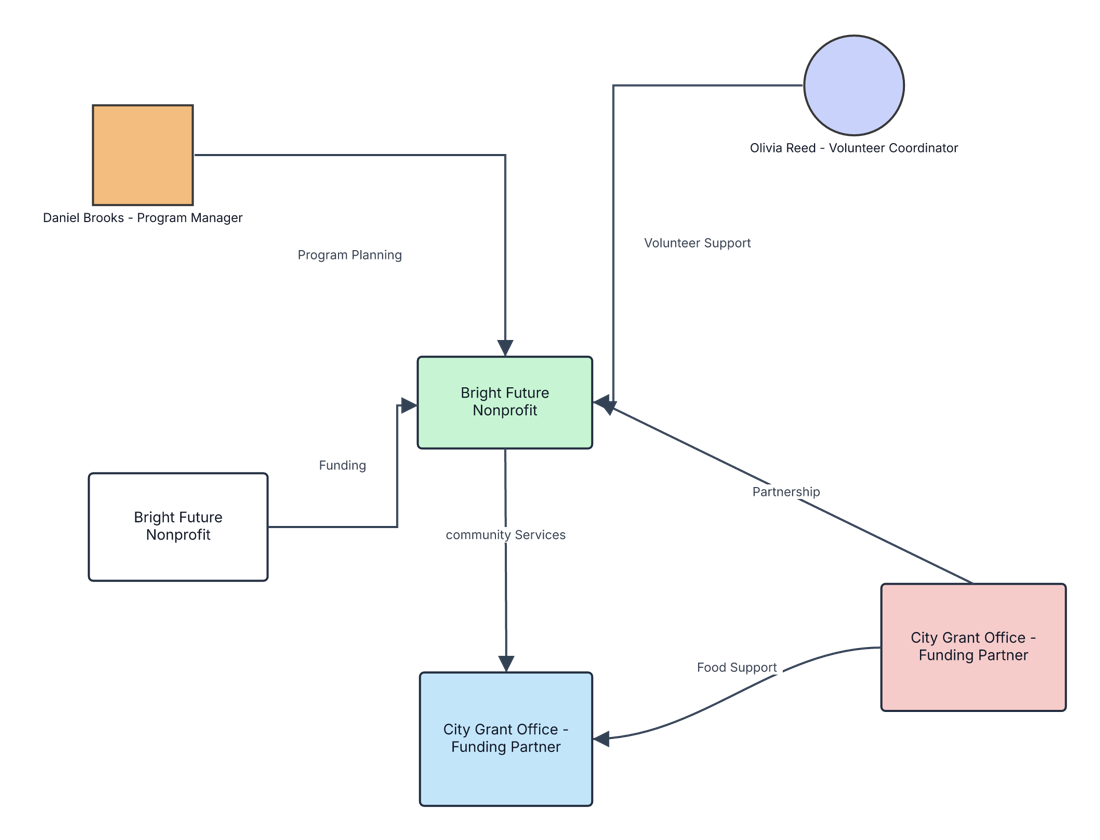
This nonprofit stakeholder mapping community genogram places Bright Future Nonprofit at the center of its working ecosystem and connects the people, organizations, and resources that help deliver its mission.
The example contains six stakeholder nodes. Daniel Brooks, Program Manager, connects through Program Planning, while Olivia Reed, Volunteer Coordinator, connects through Volunteer Support. The remaining organization touchpoints represent Bright Future Nonprofit and the City Grant Office – Funding Partner.
Labeled connections show Funding, Community Services, Partnership, and Food Support alongside the two staff-led relationships. Separate organization nodes can represent programs, departments, grants, service pathways, or contact points, making each part of the nonprofit network easy to identify and manage.
This nonprofit stakeholder map can help nonprofit teams organize people, partners, funding, and service relationships in one clear view.
Map the ecosystem supporting a program, campaign, or community outcome.
Coordinate people, organizations, responsibilities, and engagement.
Review funding, service, partnership, and accountability relationships.
Clarify referrals, resources, ownership, priorities, and next actions.
Person symbols represent individual stakeholders, labeled rectangles represent organizations, and directional connectors show how support or resources move through the network.
Individual stakeholder or role holder
Individual stakeholder or role holder
Central nonprofit or focal organization
Nonprofit, funder, partner, service, or community organization
Flow of support, funding, services, information, or collaboration
Purpose of the connection, such as Program Planning or Food Support
Separate program, function, funding stream, or operational touchpoint
Use this example when a nonprofit needs a shared visual of the people and organizations involved in delivering a program or community outcome.
Name the organization, program, campaign, or community outcome that the stakeholder map will support.
Include staff, volunteers, funders, agencies, community groups, service providers, and other relevant partners.
Add specific labels such as funding, program planning, volunteer support, referrals, advocacy, food support, or data sharing.
Record the relationship owner, contact person, priority, engagement status, meeting frequency, and next step for each stakeholder.
Creately Clinical supports stakeholder mapping with flexible fields, labeled connectors, service-focused views, collaboration, and report-ready outputs.
Separate nodes can represent different programs, departments, grants, locations, service pathways, or stakeholder contacts within one organization. This keeps each operational relationship clear and actionable.
You can include a role, organization, contact person, contribution, influence, interest, relationship owner, engagement status, meeting frequency, agreement dates, and next action.
Yes. Replace the example organization, roles, and connection labels with those used by a charity, foundation, association, advocacy group, community program, or social enterprise.
Custom fields, notes, connectors, and visual categories can keep stakeholder information organized. Shared editing, comments, version history, and exports support collaborative planning and coordinated updates.
Edit the genogram to add your stakeholders, label each contribution, and create a practical shared view of the relationships that support your nonprofit’s mission.