Neighborhood Community Network
Shows the people, groups, and organizations connected to the case.
Shows the people, groups, and organizations connected to the case.
Clarifies who provides support, services, influence, or coordination.
Keeps family members visible within the wider community system.
Maps how help, referrals, and relationships move through the network.
Identifies schools, healthcare, faith, nonprofit, or social-service links.
Leaves room to mark strong, weak, or strained connections.
Helps teams discuss the same community picture during planning.
Can be updated as services, roles, or contacts change.
Map neighborhood households, community-group participation, local relationships, and support connections using this community genogram on Creately Clinical.
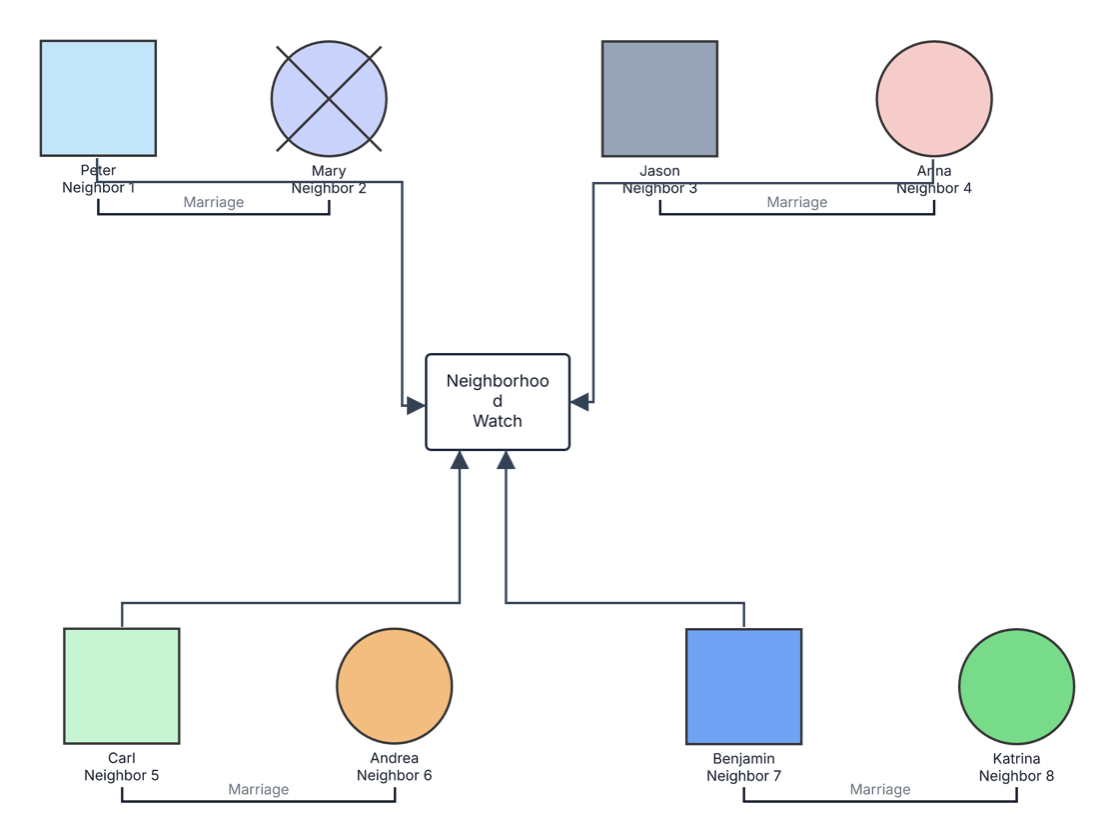
This neighborhood community genogram connects four households to one shared Neighborhood Watch group, creating a simple visual foundation for community participation and support planning.
The example contains eight residents identified as Neighbors 1 through 8. Peter and Mary form the first household, Jason and Alina the second, Carl and Andrea the third, and Benjamin and Katrina the fourth. Mary is marked deceased, preserving relevant status information in the community record.
Each household has a directional connection to the central Neighborhood Watch group. This hub-and-household arrangement makes it easy to see community participation at a glance and provides room to add roles, activities, contact preferences, resources, or other neighborhood organizations.
This neighborhood community genogram can help residents and community teams organize households, participation, and local support in one clear view.
Map participating households, roles, communication routes, and shared initiatives.
Coordinate activities, outreach, schedules, skills, and responsibilities.
Connect residents with services, resources, and local support.
Build a shared visual of participation and opportunities for collaboration.
Person symbols represent residents, partner lines define households, and the central node represents a community organization.
Male resident
Female resident
Deceased resident
Marriage or partner relationship
Community group or neighborhood organization
Household participation or connection to the community group
Stable household or resident identifier
Visual identifier that can be customized for households, roles, or categories
Use this example when residents, households, and shared community groups need to be viewed together.
Enter each resident or household and include the names, identifiers, and partner relationships useful to the project.
Add the neighborhood organization, initiative, committee, or local service that connects the households.
Connect each household to the group and add roles, activities, communication preferences, meeting schedules, or volunteer responsibilities.
Add schools, clinics, councils, nonprofits, emergency contacts, support groups, and other community resources as the project grows.
Creately Clinical supports community mapping with flexible profiles, social-work fields, labeled connectors, collaborative editing, and report-ready outputs.
No. Replace the central node with any neighborhood association, residents’ committee, volunteer group, local program, or community initiative.
Yes. Add multiple group or service nodes and connect each household to the organizations, activities, or resources relevant to them.
You can include resident names, household IDs, roles, availability, contact preferences, skills, interests, resources, and participation notes appropriate to the project.
Custom fields, notes, connectors, and visual categories can keep household and community information organized. Shared editing, comments, version history, and exports support collaborative outreach and planning.
Edit the genogram to add your households, connect them with local groups, and build a practical visual for neighborhood engagement and community support.