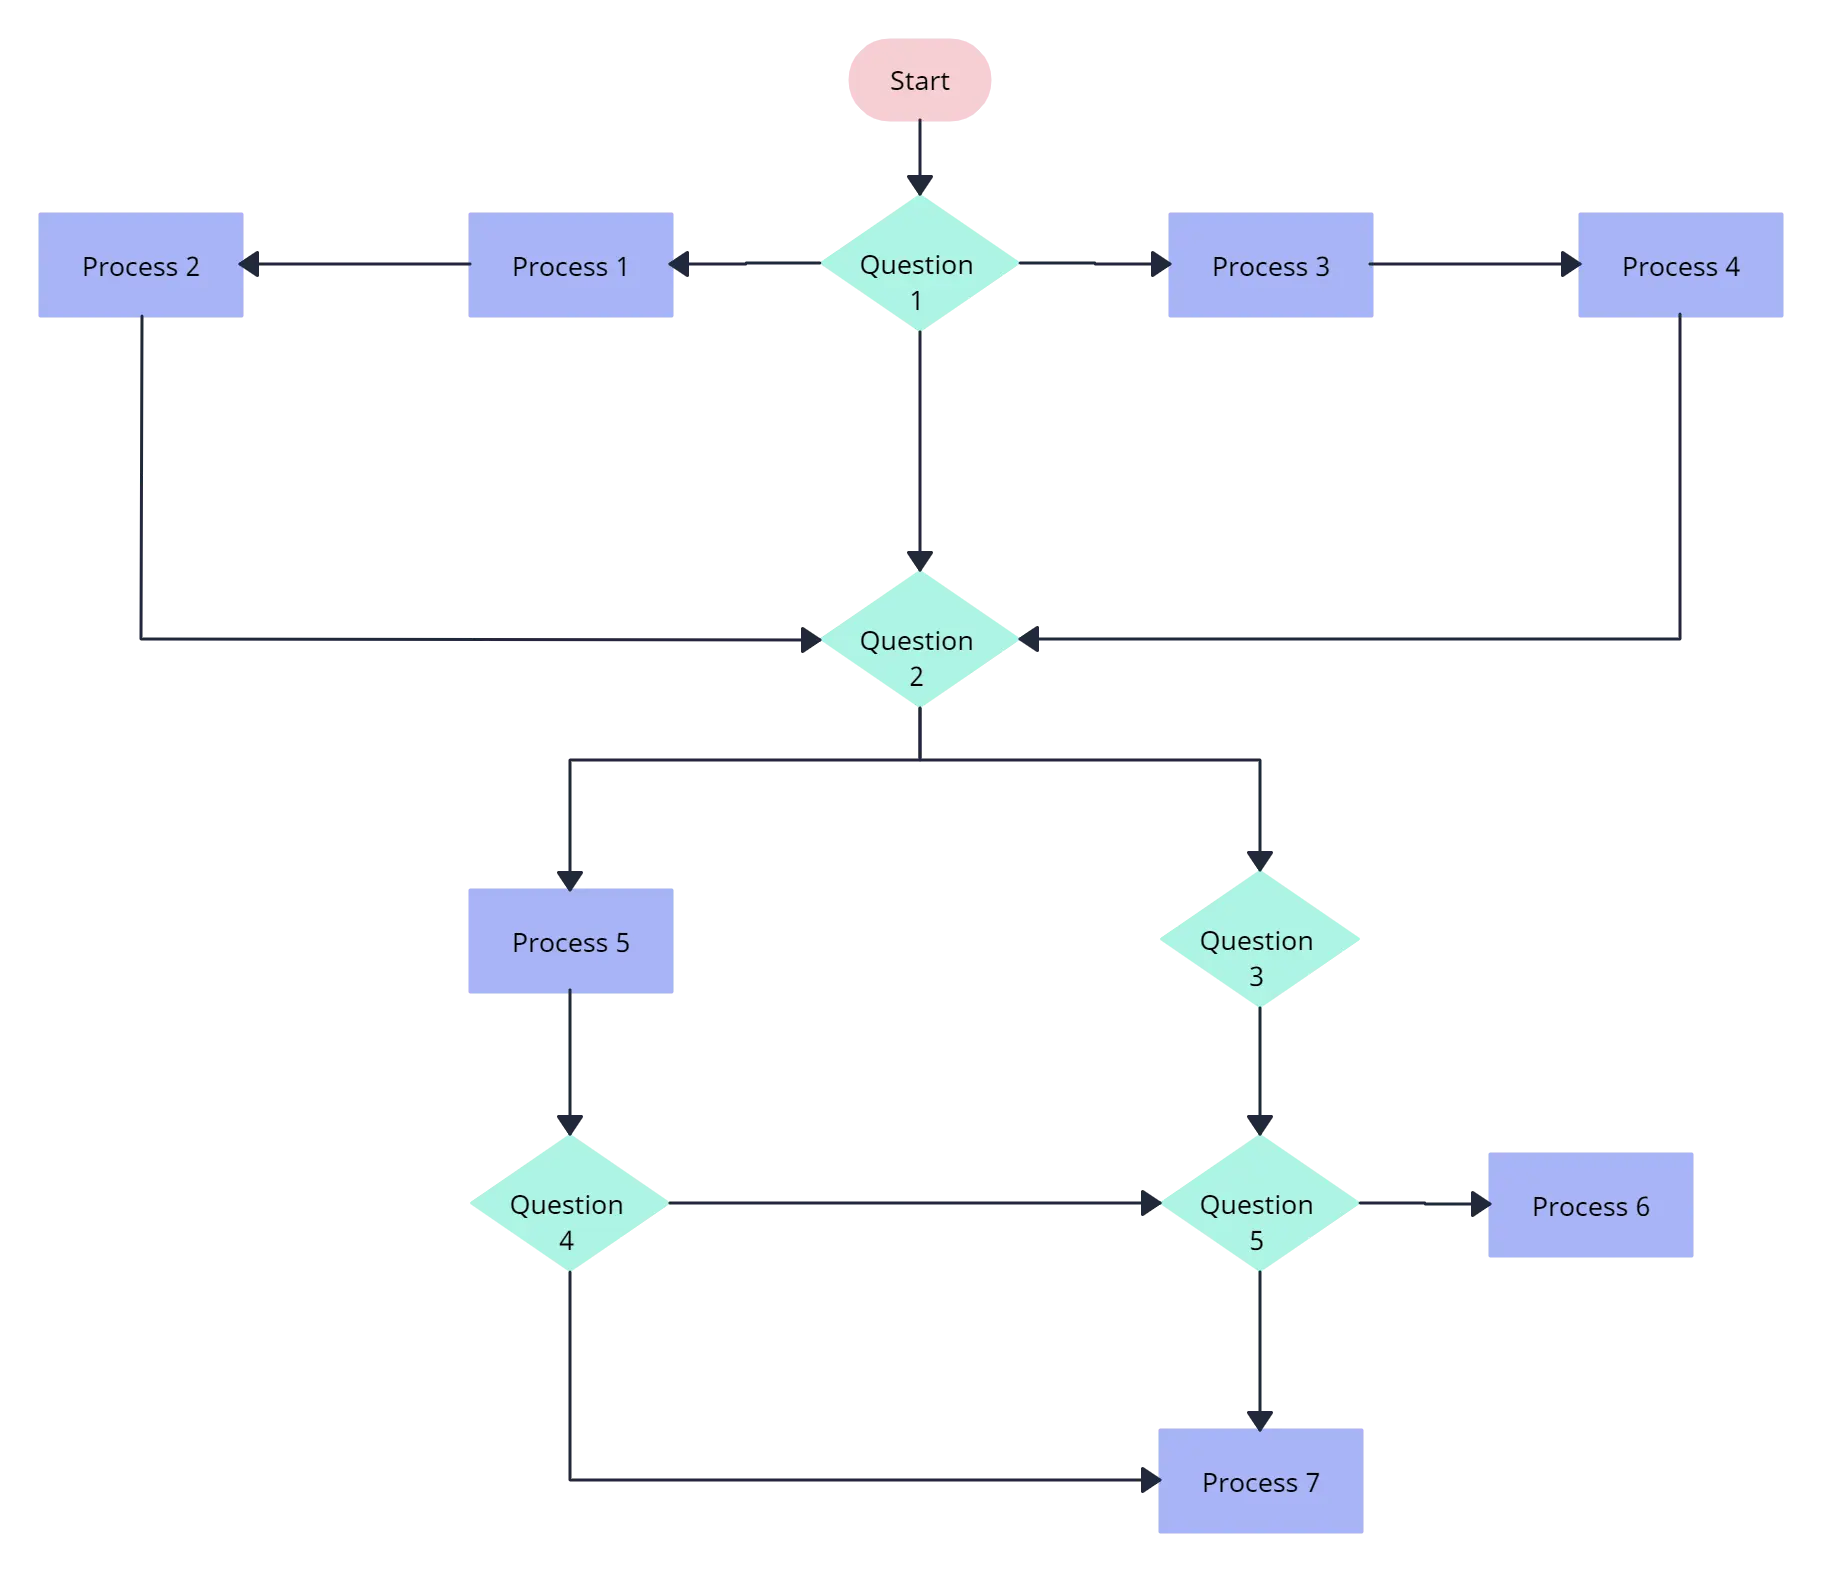
So you want to learn flowcharts? Well, This flowchart tutorial will teach you all you need to know. It will cover the history of flowcharts, flowchart symbols, how to create flowcharts, flowchart best practices and we’ve also included a section to answer frequent questions about flowcharts. Best of all you can use our flowchart software.
Creately already has some really awesome articles and videos covering various things related to flowcharts like meanings of flowchart symbols, how to use swimlanes in flowcharts, flowchart best practices, case studies, and much more.
History of Flowcharts
Frank Gilberth introduced flowcharts in 1921, and they were called “Process Flow Charts” at the beginning. Allan H. Mogensen is credited with training business people on how to use flowcharts. Wikipedia has a great summary of the history of flowcharts, read more in this wiki section.
What is a Flowchart
Flowcharts are visual representations of processes and systems, showing the various steps, decision points, and paths through a process. In a wide range of fields, including software development, engineering, business, and education, it is used to help understand, analyze, and optimize processes. A well-designed flowchart should be easy to read and follow a logical sequence of steps.
Flowchart Symbols
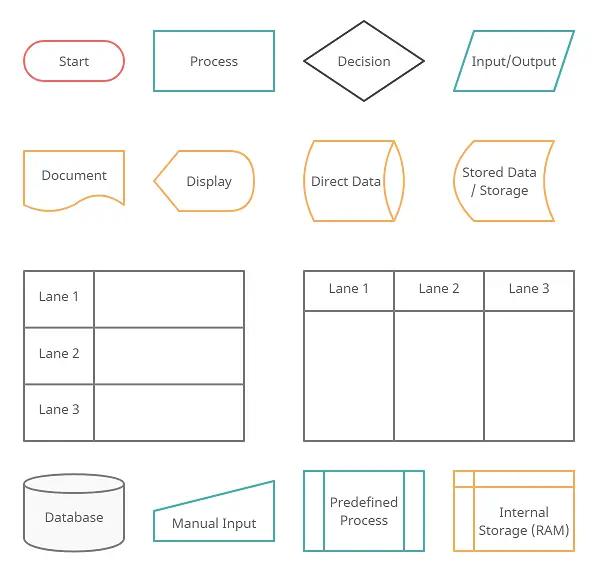
Flowchart symbols are graphical representations of various components of a process or system. Each symbol is used to denote a particular action, decision, or result in the process being represented. Each symbol also has a specific meaning.
So what are the different symbols used in a flowchart?. Most people are only aware of basic symbols like processes and decision blocks. But there are many more symbols to make your flowchart more meaningful. The above image shows all the standard flowchart symbols.
The most common symbol used in a flowchart is the rectangle. A rectangle represents a process, operation, or a task. The next most common symbol is the diamond which is used to represent a decision.
With this following list, you can figure out the most commonly used flowchart symbols as well as those that are little-known. All these shapes are available in Creately and you can try out a demo or take a look at some flowchart examples for more context.
Terminal / Terminator
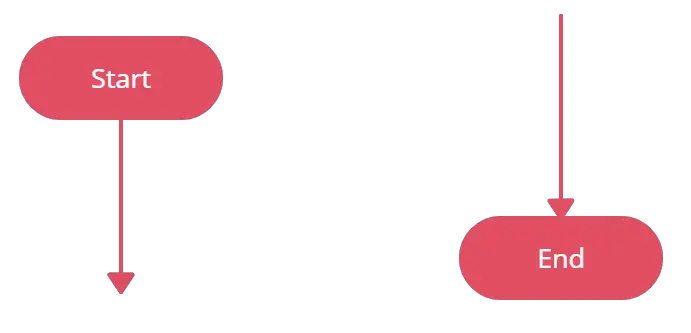
The terminator shows where your process begins or ends. You can use words like ‘Start’, ‘Begin’, ‘End’ inside the terminator shape to make things more obvious.
Process / Rectangle
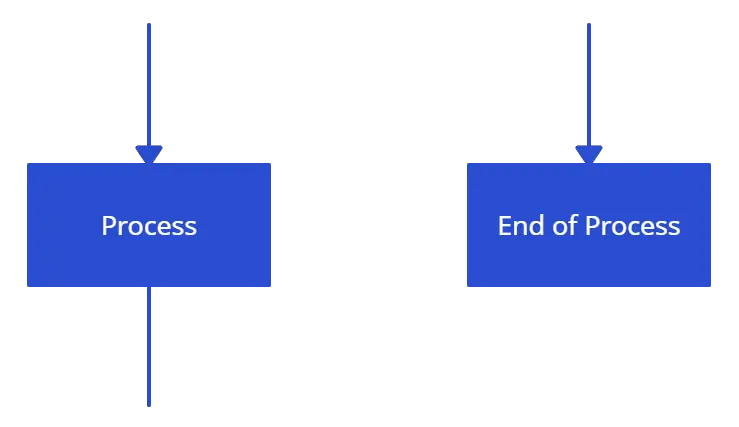
Flowchart process shape is used to represent a process, action step, or operation. While these are pictured with rectangles, the text in the rectangle mostly includes a verb. For example, ‘Edit Video’, ‘Try Again’, ‘Choose Your Plan’.n’.
Data (I/O)

The Data object, often referred to as the I/O Shape shows the Inputs to and Outputs from a process. This takes the shape of a parallelogram.
Decision / Conditional
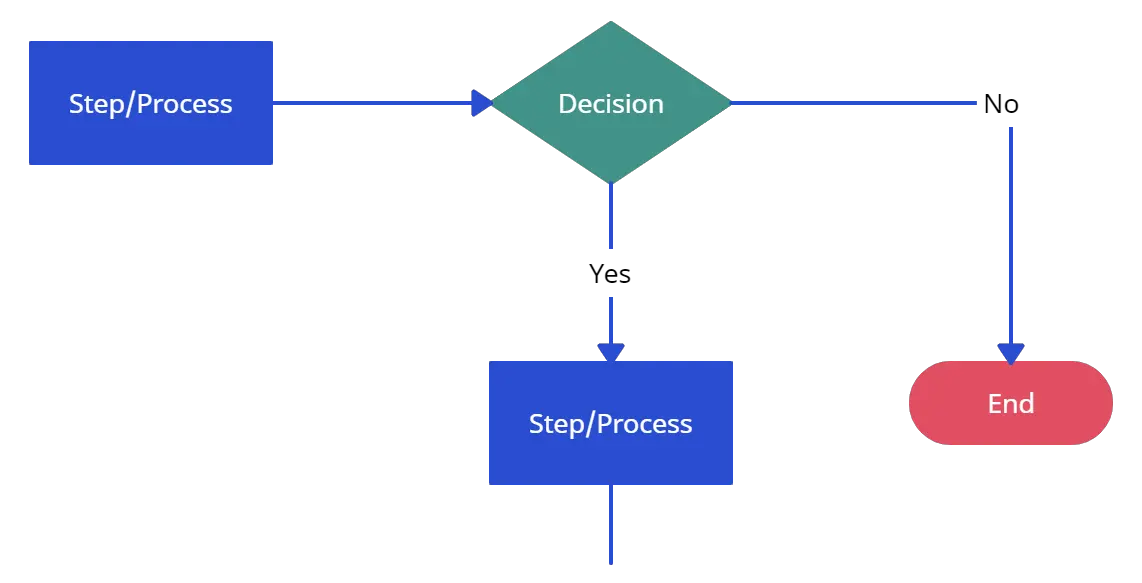
The decision shape is represented as a Diamond. This object is always used in a process flow to ask a question. And, the answer to the question determines the arrows coming out of the Diamond. This shape is quite unique with two arrows coming out of it. One from the bottom point corresponding to Yes or True and one from either the right/left point corresponding to No or False. The arrows should always be labeled to avoid confusion in the process flow.
Document

The document object is a rectangle with a wave-like base. This shape is used to represent a Document or Report in a process flow.
Stored Data
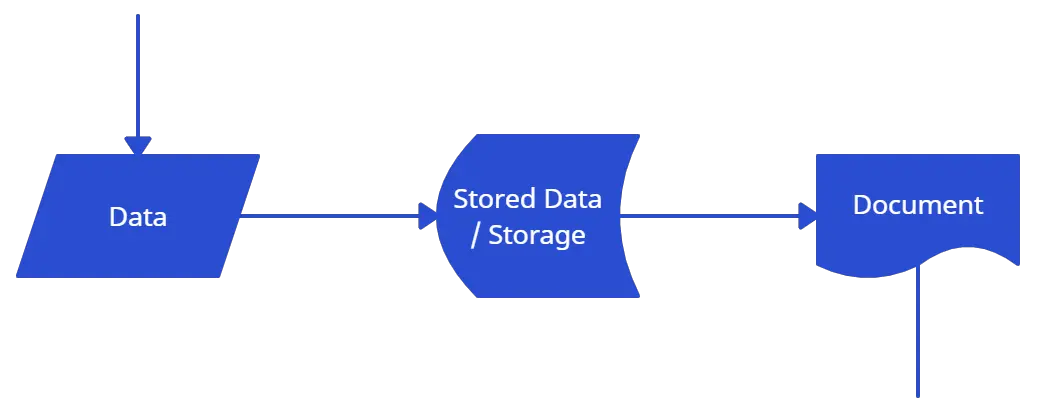
This is a general data storage object used in the process flow as opposed to data that could be also stored on a hard drive, magnetic tape, memory card, of any other storage device.
Direct Data

Direct Data object in a process flow represents information stored which can be accessed directly. This object represents a computer’s hard drive.
Internal Storage

This is a shape that is commonly found in programming flowcharts to illustrate the information stored in memory, as opposed to on a file. This shape is often referred to as the magnetic core memory of early computers, or the random access memory (RAM) as we call it today.
Sequential Access

This object takes the shape of a reel of tape. It represents information stored in a sequence, such as data on a magnetic tape.
Manual Input
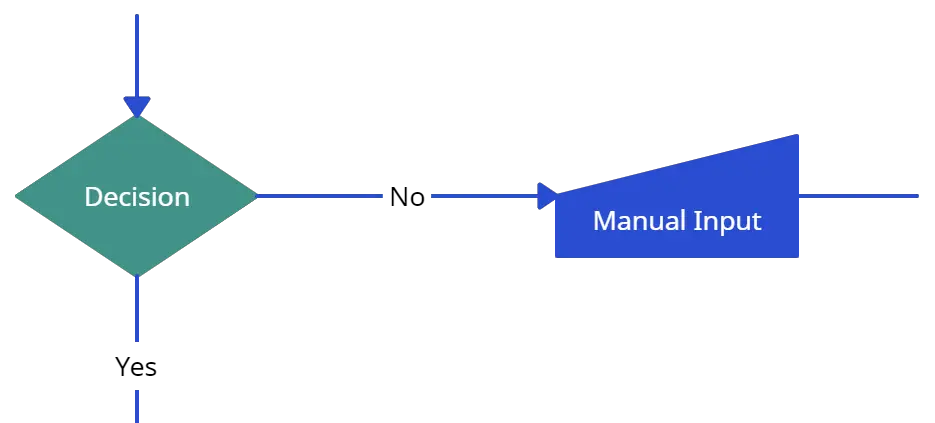
This object is represented by a rectangle with the top sloping up from left to right. The Manual Input object signifies an action where the user is prompted for information that must be manually input into a system.
Subroutine / Predefined Process

This shape takes two names – ‘Subroutine’ or ‘Predefined Process’. Its called a subroutine if you use this object in flowcharting a software program. This allows you to write one subroutine and call it as often as you like from anywhere in the code.
The same object is also called a Predefined Process. This means the flowchart for the predefined process has to be already drawn, and you should reference the flowchart for more information.
Although these are the standard symbols available in most flowchart software, some people do use different shapes for different meanings. The most common example of this is using circles to denote start and end. The examples in this flowchart tutorial will stick with the standard symbols.
How to Draw a Flowchart
How do you draw a flowchart? Well, our flowcharting tool is a good place to start. But before directly using the tool, let’s take a look at some basics.
There are four main types of flowcharts. Document flowchart, System flowchart, data flowchart, and program flowchart. Not everyone agrees with this categorization, but the core principles of drawing a flowchart remain the same. You need to consider a few things when drawing a flowchart, Check out 6 useful tips on drawing flowcharts before you start.
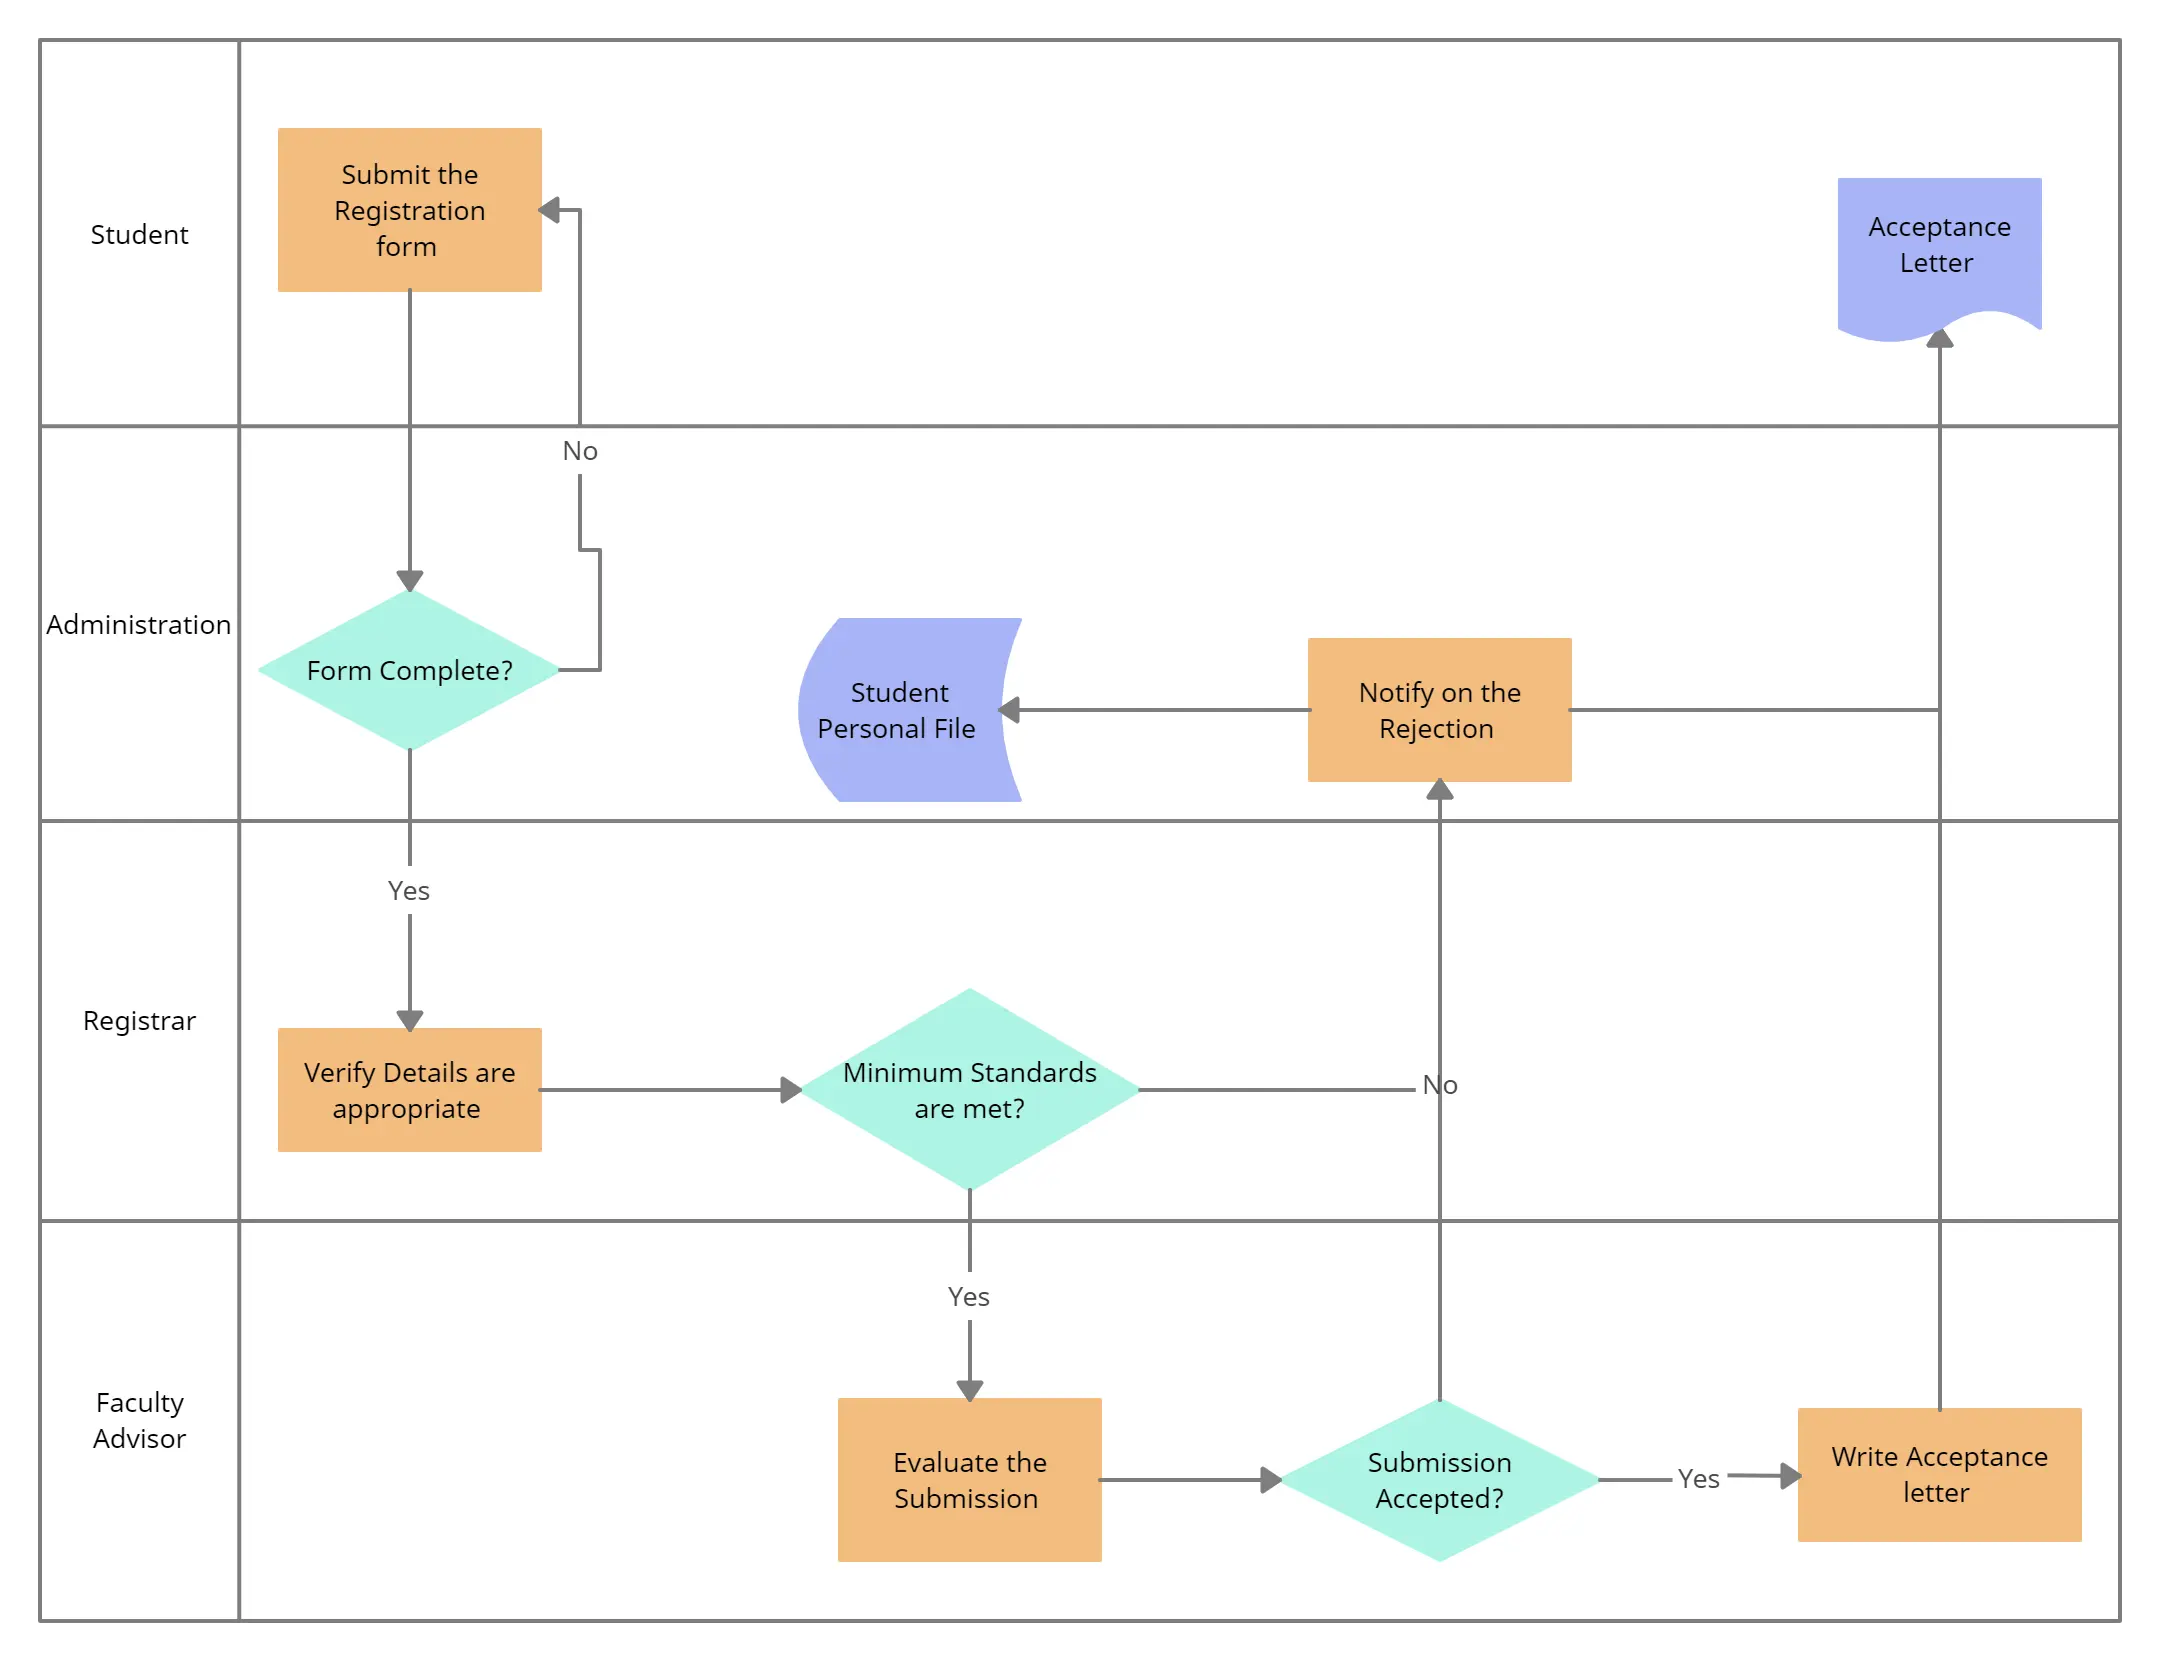
If you are drawing a flowchart with many responsible parties you can group them together using swimlanes. Swimlanes are a powerful technique to increase the readability of your flowchart so you should use them according to the situation. Read how to use cross-functional flowchart for planning to learn more about the process.
The below video shows how to draw a flowchart using Creately. It is very simple to use and one-click create and connect helps you draw them faster as well. You can drag and drop symbols from the library or drag images to your diagram by doing an image search.
Here are the Steps to Draw a Flowchart
1. Explain the procedure
Determine the function and boundaries of the system or process you wish to depict in the flowchart. The process’s inputs, outputs, and actions should be identified.
2. Choose the shapes and symbols
To represent the many process components—such as the start and end points, inputs, outputs, actions, decisions, and loops—choose the right symbols and shapes. Rectangles, diamonds, circles, and arrows are the most often utilized shapes in flowcharts. To access all shapes, enable Creately’s flowchart shapes library.
3. Organize the flow
Determine the order of the steps in the process and the different paths that can be taken. This will help you organize the flow of the flowchart. Use Creately’s Plus Create to add the next shape and the connector in a single click.
4. Review and revise
Check that the flowchart accurately depicts the procedure and is simple to read and understand. If required, revise it to make it more precise and understandable. Share feedback using Creately’s contextual comments.
5. Share the flowchart
Distribute the flowchart to coworkers, stakeholders, or clients who will need to use it or refer to it easily with a workspace link
Flowchart Templates and Examples
Although you can start drawing flowcharts by scratch it is much easier to use templates. They help you reduce errors and remind you about the best practices to follow. If you want to use a ready-made template, go to the flowchart examples section and click on the flowchart that best suits you. Click on the use at template after the image and you are ready to draw your flowchart.
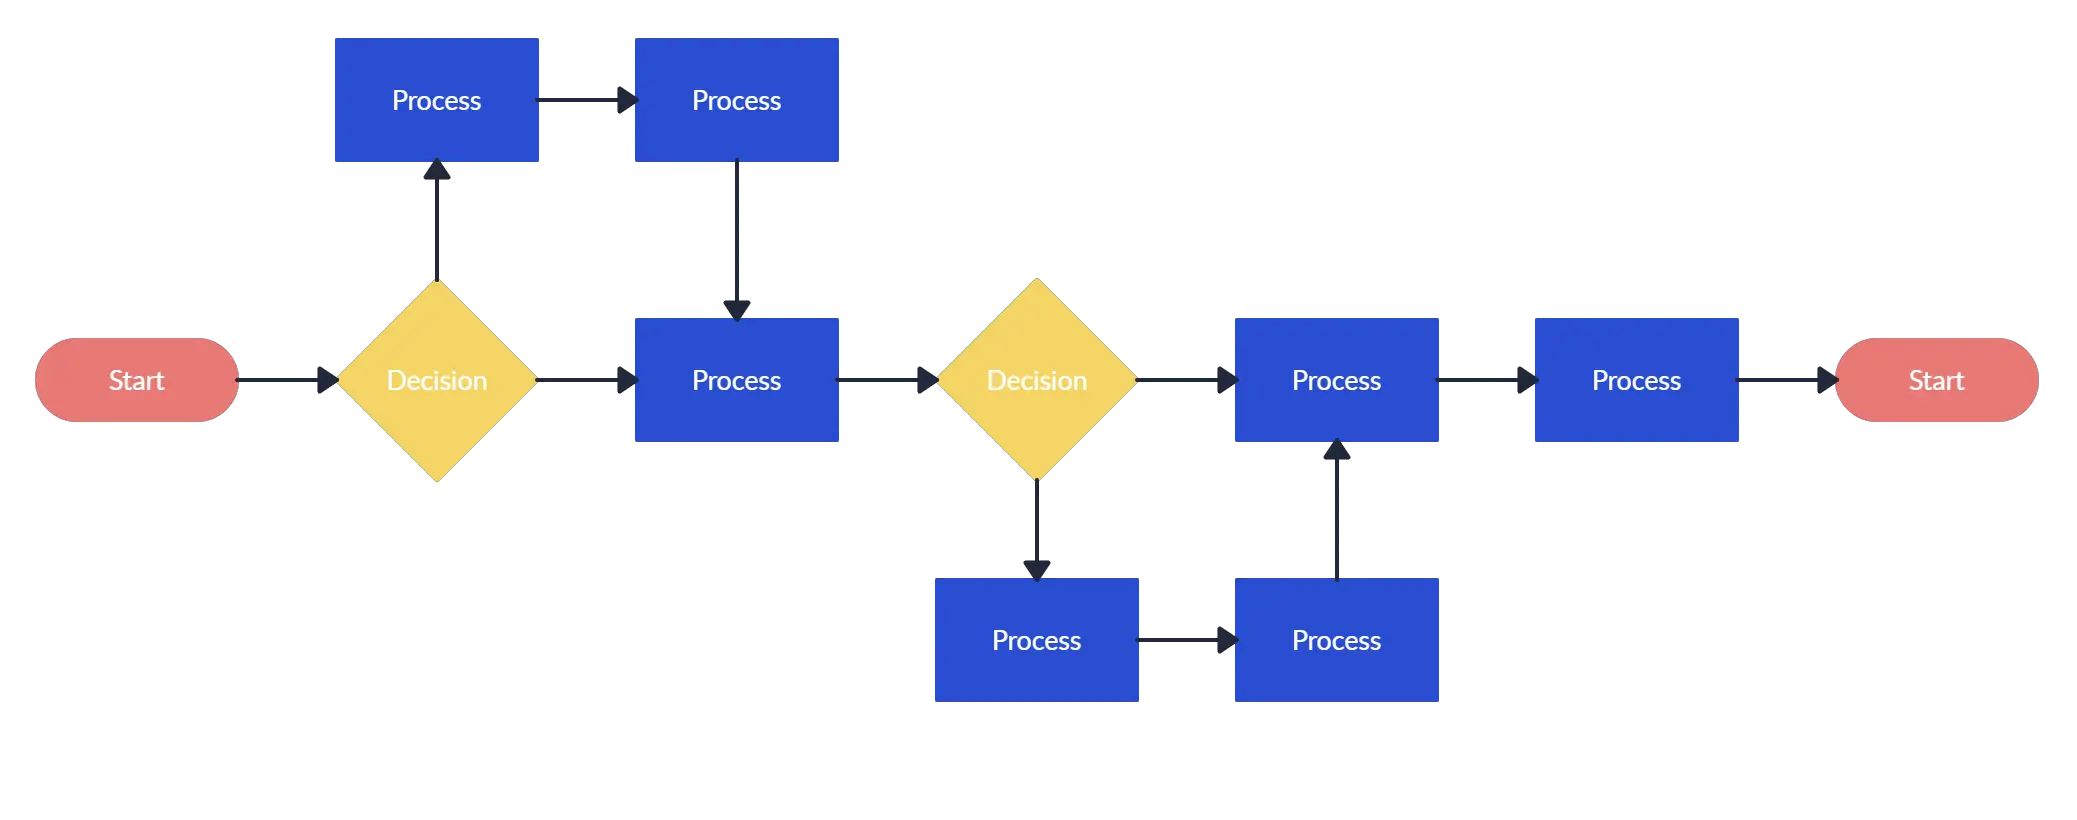
Below are two templates out of hundreds of flowchart templates available to the user. Click on any of them to start drawing flowcharts immediately.
Flowchart Best Practices
There are a few things you can do to make your flowchart universally accepted. And there are some things that you can do to make it visually pleasing to others as well.
If you’re planning to share your flowchart or hoping to use it on a presentation etc. then it’s wise to use standard symbols. However, it is important to remember that the idea is to give out information in an easy-to-understand manner. It is perfectly acceptable to use an alternative image instead of the document symbol as long as the audience understands it.
Keeping the arrow flow to one side, using the same size symbols, naming the decision blocks, processes, arrows, etc. are a few things you can do to make it better. The common mistakes section covers most of these practices in detail.
Common Mistakes Made when Drawing Flowcharts
This section highlights the common mistakes made when drawing flowcharts. Some of the things mentioned here are to make it better looking and more understandable, not having them in your flowchart won’t make it wrong. Since there are two posts covering these mistakes in-depth I will link to them from this flowchart tutorial.
15 mistakes you would unintentionally make with flowcharts (Part 1) 15 mistakes you would unintentionally make with flowcharts (Part 2)Effective Use of Flowcharts – Case Studies
A flowchart tutorial isn’t complete without some case studies. Below are three case studies and real-life examples of how flowcharts can help you make decisions.
- Ten Flowchart Ideas for Your Business – How flowcharts can be used in making business decisions and optimizing the current business processes
- Analyzing Sales Funnel with Flowcharts – How to analyze the Google analytic sales funnel using a flowchart.
- Flutterscape Case Study – How one of our customers used flowcharts to enhance their processes.
Frequently Asked Questions About Flowchart
The comments section of this article is full of questions. Please note that I will not draw flowcharts for specific scenarios. Below I have answered some of the most frequently asked questions.
Q 01: What is a subprocess in a flowchart?
Answer: Sometimes complex processes are broken down into smaller sub-processes for clarity. So a flowchart can point to a different sub-process within its flow. The predefined process symbol is used to show such subprocesses.
Q 02: How are flowcharts used in computer programming?
Answer: A computer program consists of many processes and flows. Flowcharts are used to visualize the processes and make them understandable for non-technical people. They are also used to visualize algorithms and comprehend pseudo-code which is used in programming.
Comments and Feedback on the Flowchart Tutorial
I hope this flowchart tutorial will help you to come up with awesome flowcharts. Flowcharts are a great way to present complex processes in a simple-to-understand manner and they are used all over the world in many industries. If you have a question about drawing flowcharts or have any suggestions to improve this post, feel free to mention in the comments section.

