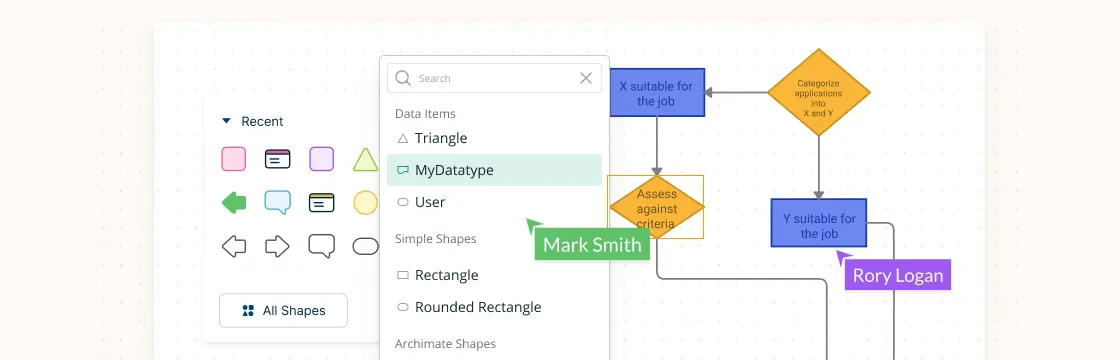
Quick answer: a flowchart shows the steps, decisions, and direction of a process in a simple visual sequence. Start by defining the process scope, list the main steps, choose standard flowchart symbols, connect them with arrows, and review the chart with the people who own or use the process. So you want to learn flowcharts? Well, This flowchart tutorial will teach you all you need to know. It will cover the history of flowcharts, flowchart symbols, how to create flowcharts, flowchart best practices and we’ve also included a section to answer frequent questions about flowcharts. Best of all you can use our flowchart software.
History of Flowcharts
Frank Gilberth introduced flowcharts in 1921, and they were called “Process Flow Charts— at the beginning. Allan H. Mogensen is credited with training business people on how to use flowcharts. Wikipedia has a great summary of the history of flowcharts, read more in this wiki section.
What Is a Flowchart
A flowchart is a visual representation of a process, system, or algorithm, typically displayed using a combination of symbols, arrows, and text. It maps out the sequence of steps or decisions that lead to a particular outcome, making it easier to understand complex processes at a glance. Flowcharts are designed to simplify communication, provide clarity, and make it easier to identify bottlenecks or inefficiencies in a process. In collaboration heavy work, better communication and collaboration can improve productivity by 20-25%, which is one reason process visuals are so useful (Keller and Meaney, 2013).
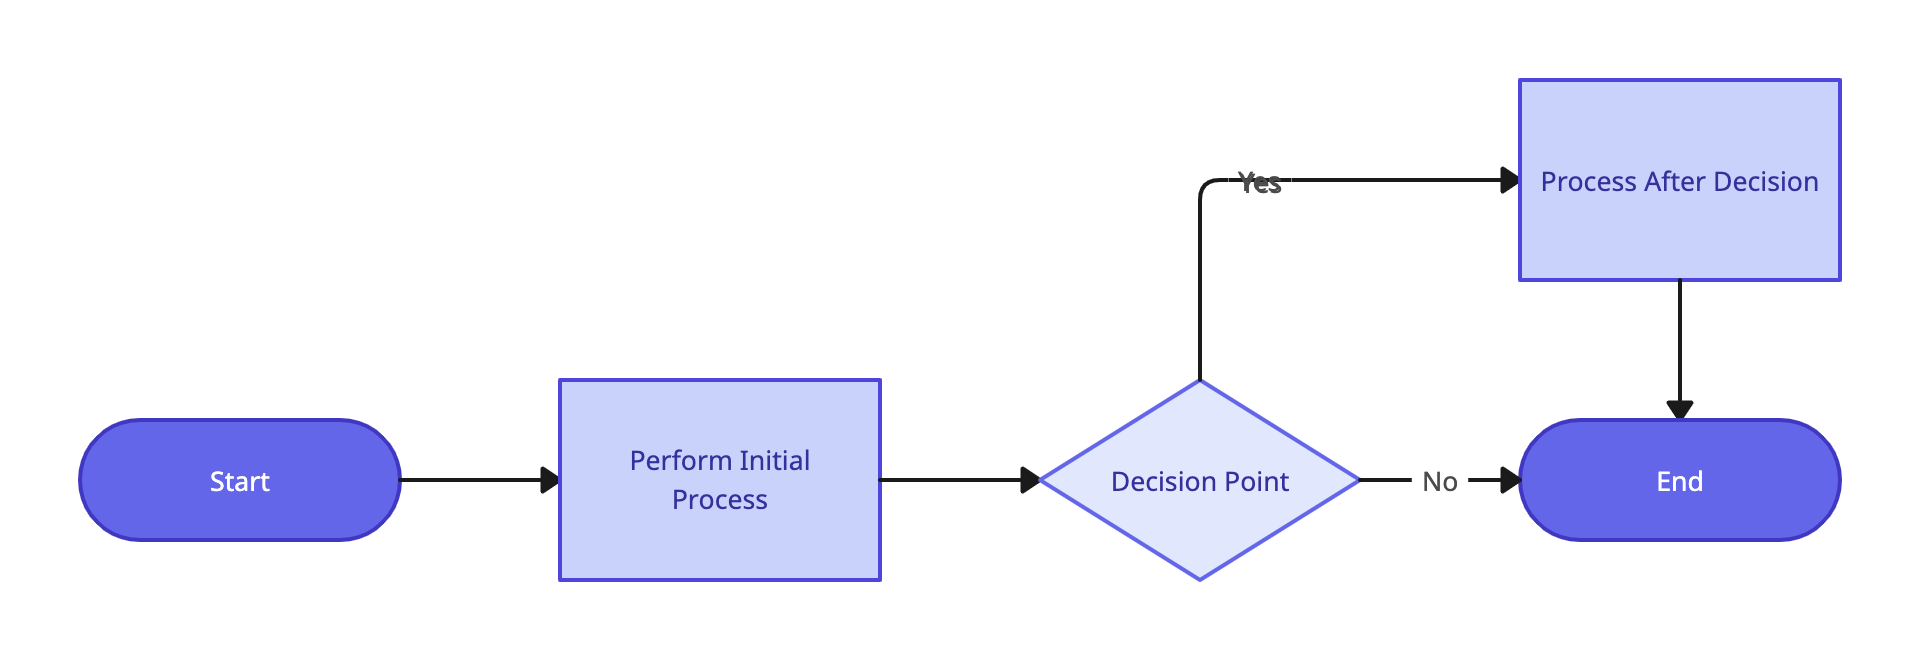
Flowcharts are commonly used in many fields:
Software Development: Developers use flowcharts to visualize program logic, algorithms, and decision making processes. This helps in debugging and planning new features.
Business: Flowcharts are often utilized to streamline operations, optimize workflows, and document standard operating procedures (SOPs).
Engineering: Engineers use flowcharts to design systems, troubleshoot issues, and ensure all components of a system function cohesively.
Education: In classrooms, flowcharts help break down complex topics into easily digestible steps, aiding both teaching and learning.
A well designed flowchart has a logical sequence of steps, making it intuitive and easy to follow. It starts with a clear beginning, follows through decision points or processes, and ends with a defined outcome.
Flowchart Benefits
Simplifies Complex Processes: Flowcharts transform complicated workflows into visual diagrams that are easy to follow.
Enhances Communication: They bridge the gap between teams, allowing non experts to understand technical processes. Better communication and collaboration in interaction-heavy work has been associated with 20-25% productivity gains (Keller and Meaney, 2013).
Improves Decision Making: By visualizing every step, flowcharts help pinpoint potential problems and areas for improvement. In highly matrixed organizations, 43% of employees report organizational complexity harms decision quality and speed, so clear process maps can reduce confusion (Marmolejo et al., 2021).
Encourages Process Optimization: Identifying inefficiencies becomes easier when the entire process is laid out visually. Organizational redesign is now mainstream, with 92% of companies saying redesign is important and 80%+ actively restructuring or having recently restructured (Deloitte, 2016).
Flowchart Symbols
Flowcharts use a variety of symbols to represent different elements of a process. Each symbol has a specific meaning, helping to clearly communicate actions, decisions, or data flows within the chart. Here’s a quick overview of the most commonly used symbols:
| Symbol | Name | Description |
|---|---|---|
 | Terminal/Terminator | Marks the start or end of a process. |
 | Process | Represents a task, action, or operation in the flow. |
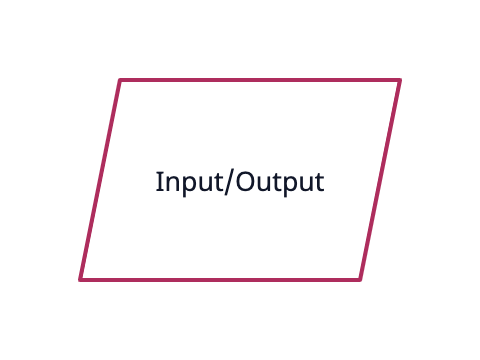 | Data (I/O) | Indicates inputs to and outputs from a process, shaped like a parallelogram. |
 | Decision | Represents a decision point, with arrows branching based on the answer (e.g., yes/no). |
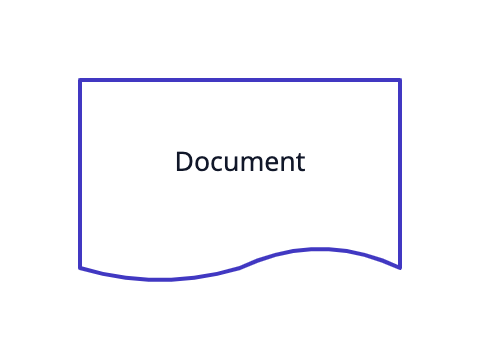 | Document | Symbolizes a report or document, shown as a rectangle with a wavy bottom. |
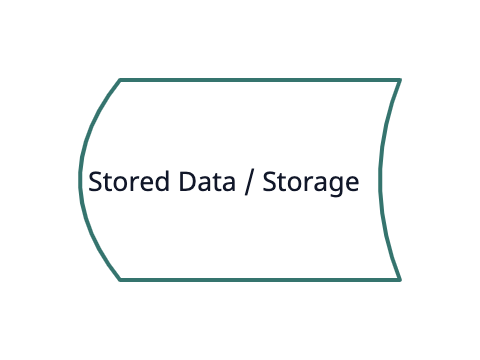 | Stored Data | Represents general data storage. |
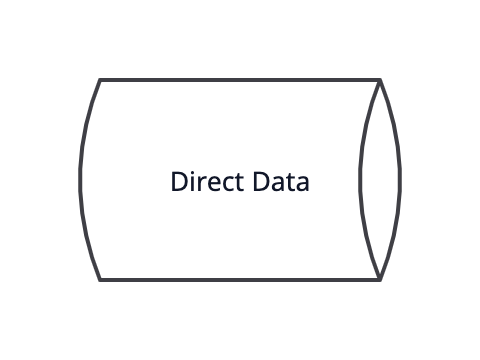 | Direct Data | Symbolizes data stored on devices like a hard drive. |
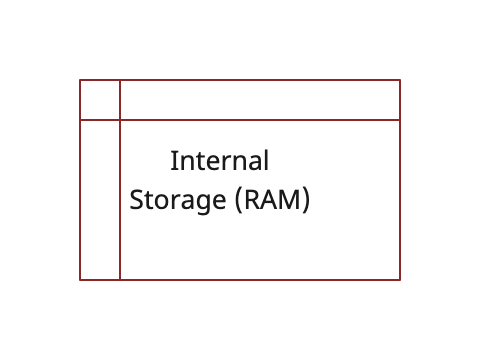 | Internal Storage | Common in programming, represents data stored in memory (RAM). |
These symbols are key to building an accurate and understandable flowchart. There are other flowchart symbols used for more complex processes and industries.
How to Draw a Flowchart
Using a flowchart tool makes the process easier, but understanding the basics first helps you create clearer and more effective diagrams. While there are different types of flowcharts, the core principles of creating them remain the same. Below are the steps you can follow to create a flowchart.
Step 1. Explain the procedure
Determine the function and boundaries of the system or process you wish to depict in the flowchart. The process’s inputs, outputs, and actions should be identified. This upfront clarity matters because only 45% of younger workers say they clearly know what is expected of them at work (Gallup, 2024).
Step 2. Choose the shapes and symbols
To represent the many process components such as the start and end points, inputs, outputs, actions, decisions, and loops—choose the right symbols and shapes. Rectangles, diamonds, circles, and arrows are the most often utilized shapes in flowcharts. To access all shapes, enable Creately’s flowchart shapes library.
Step 3. Organize the flow
Determine the order of the steps in the process and the different paths that can be taken. This will help you organize the flow of the flowchart. Use Creately’s Plus Create to add the next shape and the connector in a single click.
Step 4. Review and revise
Check that the flowchart accurately depicts the procedure and is simple to read and understand. If required, revise it to make it more precise and understandable. Share feedback using Creately’s contextual comments.
Step 5. Share the flowchart
Distribute the flowchart to coworkers, stakeholders, or clients who will need to use it or refer to it easily with a workspace link. Strong onboarding is often missing in organizations, with only 12% of employees strongly agreeing their company does onboarding well, so sharing clear process visuals early helps new joiners ramp faster (Gallup, 2018).
Don’t want to start from scratch? Check our AI flowchart generator which allows you to create flowcharts using natural language prompts.
Flowchart Templates and Examples
You can draw flowcharts from scratch, but using templates is faster and helps you avoid mistakes. Just pick a flowchart from the examples section, click “Edit this Template,— and start customizing.
Meeting Flowchart Template
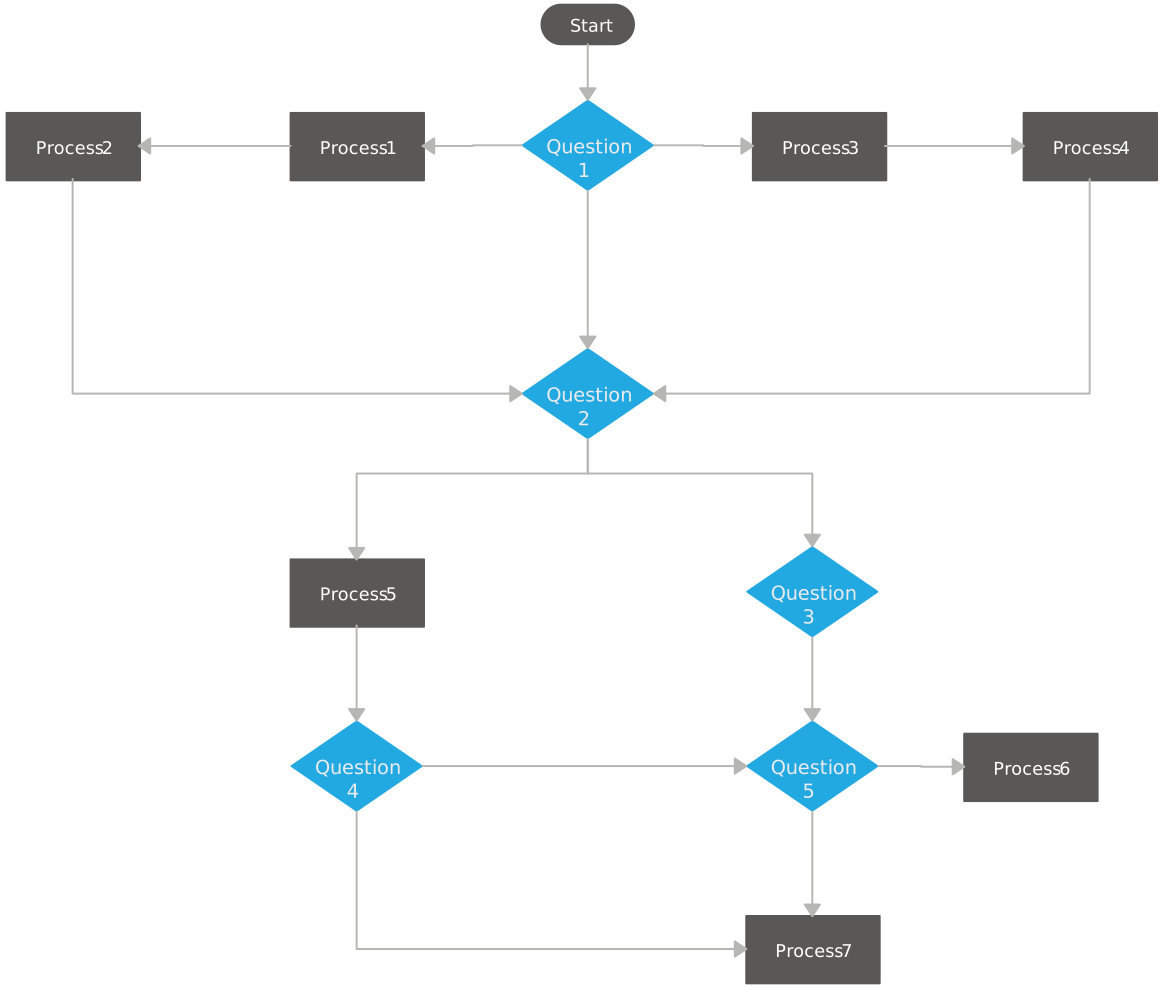

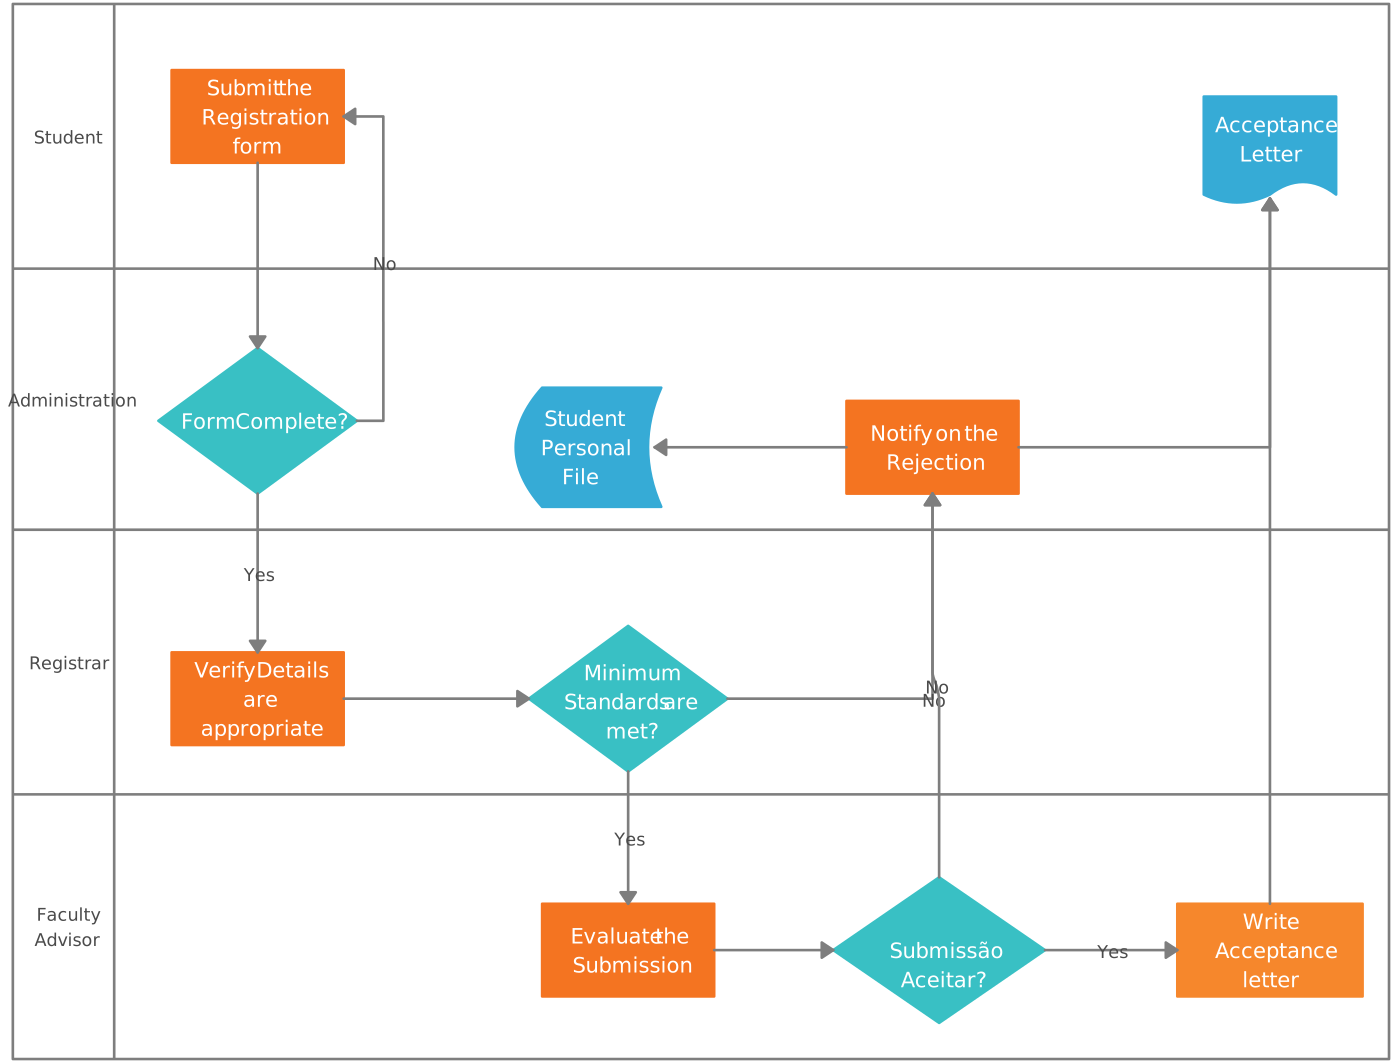
Student Application Process Flowchart
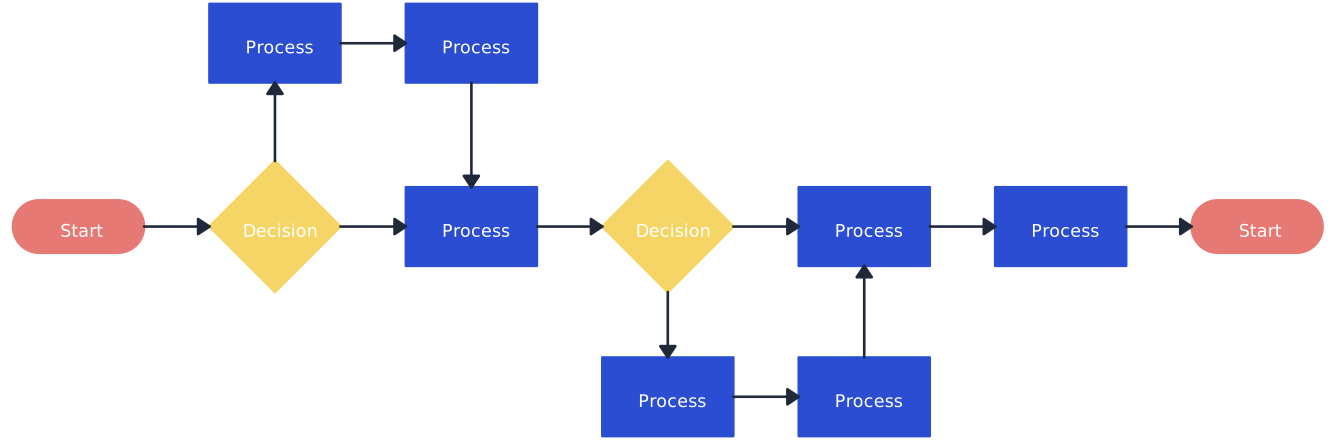
Horizontal Flowchart Template
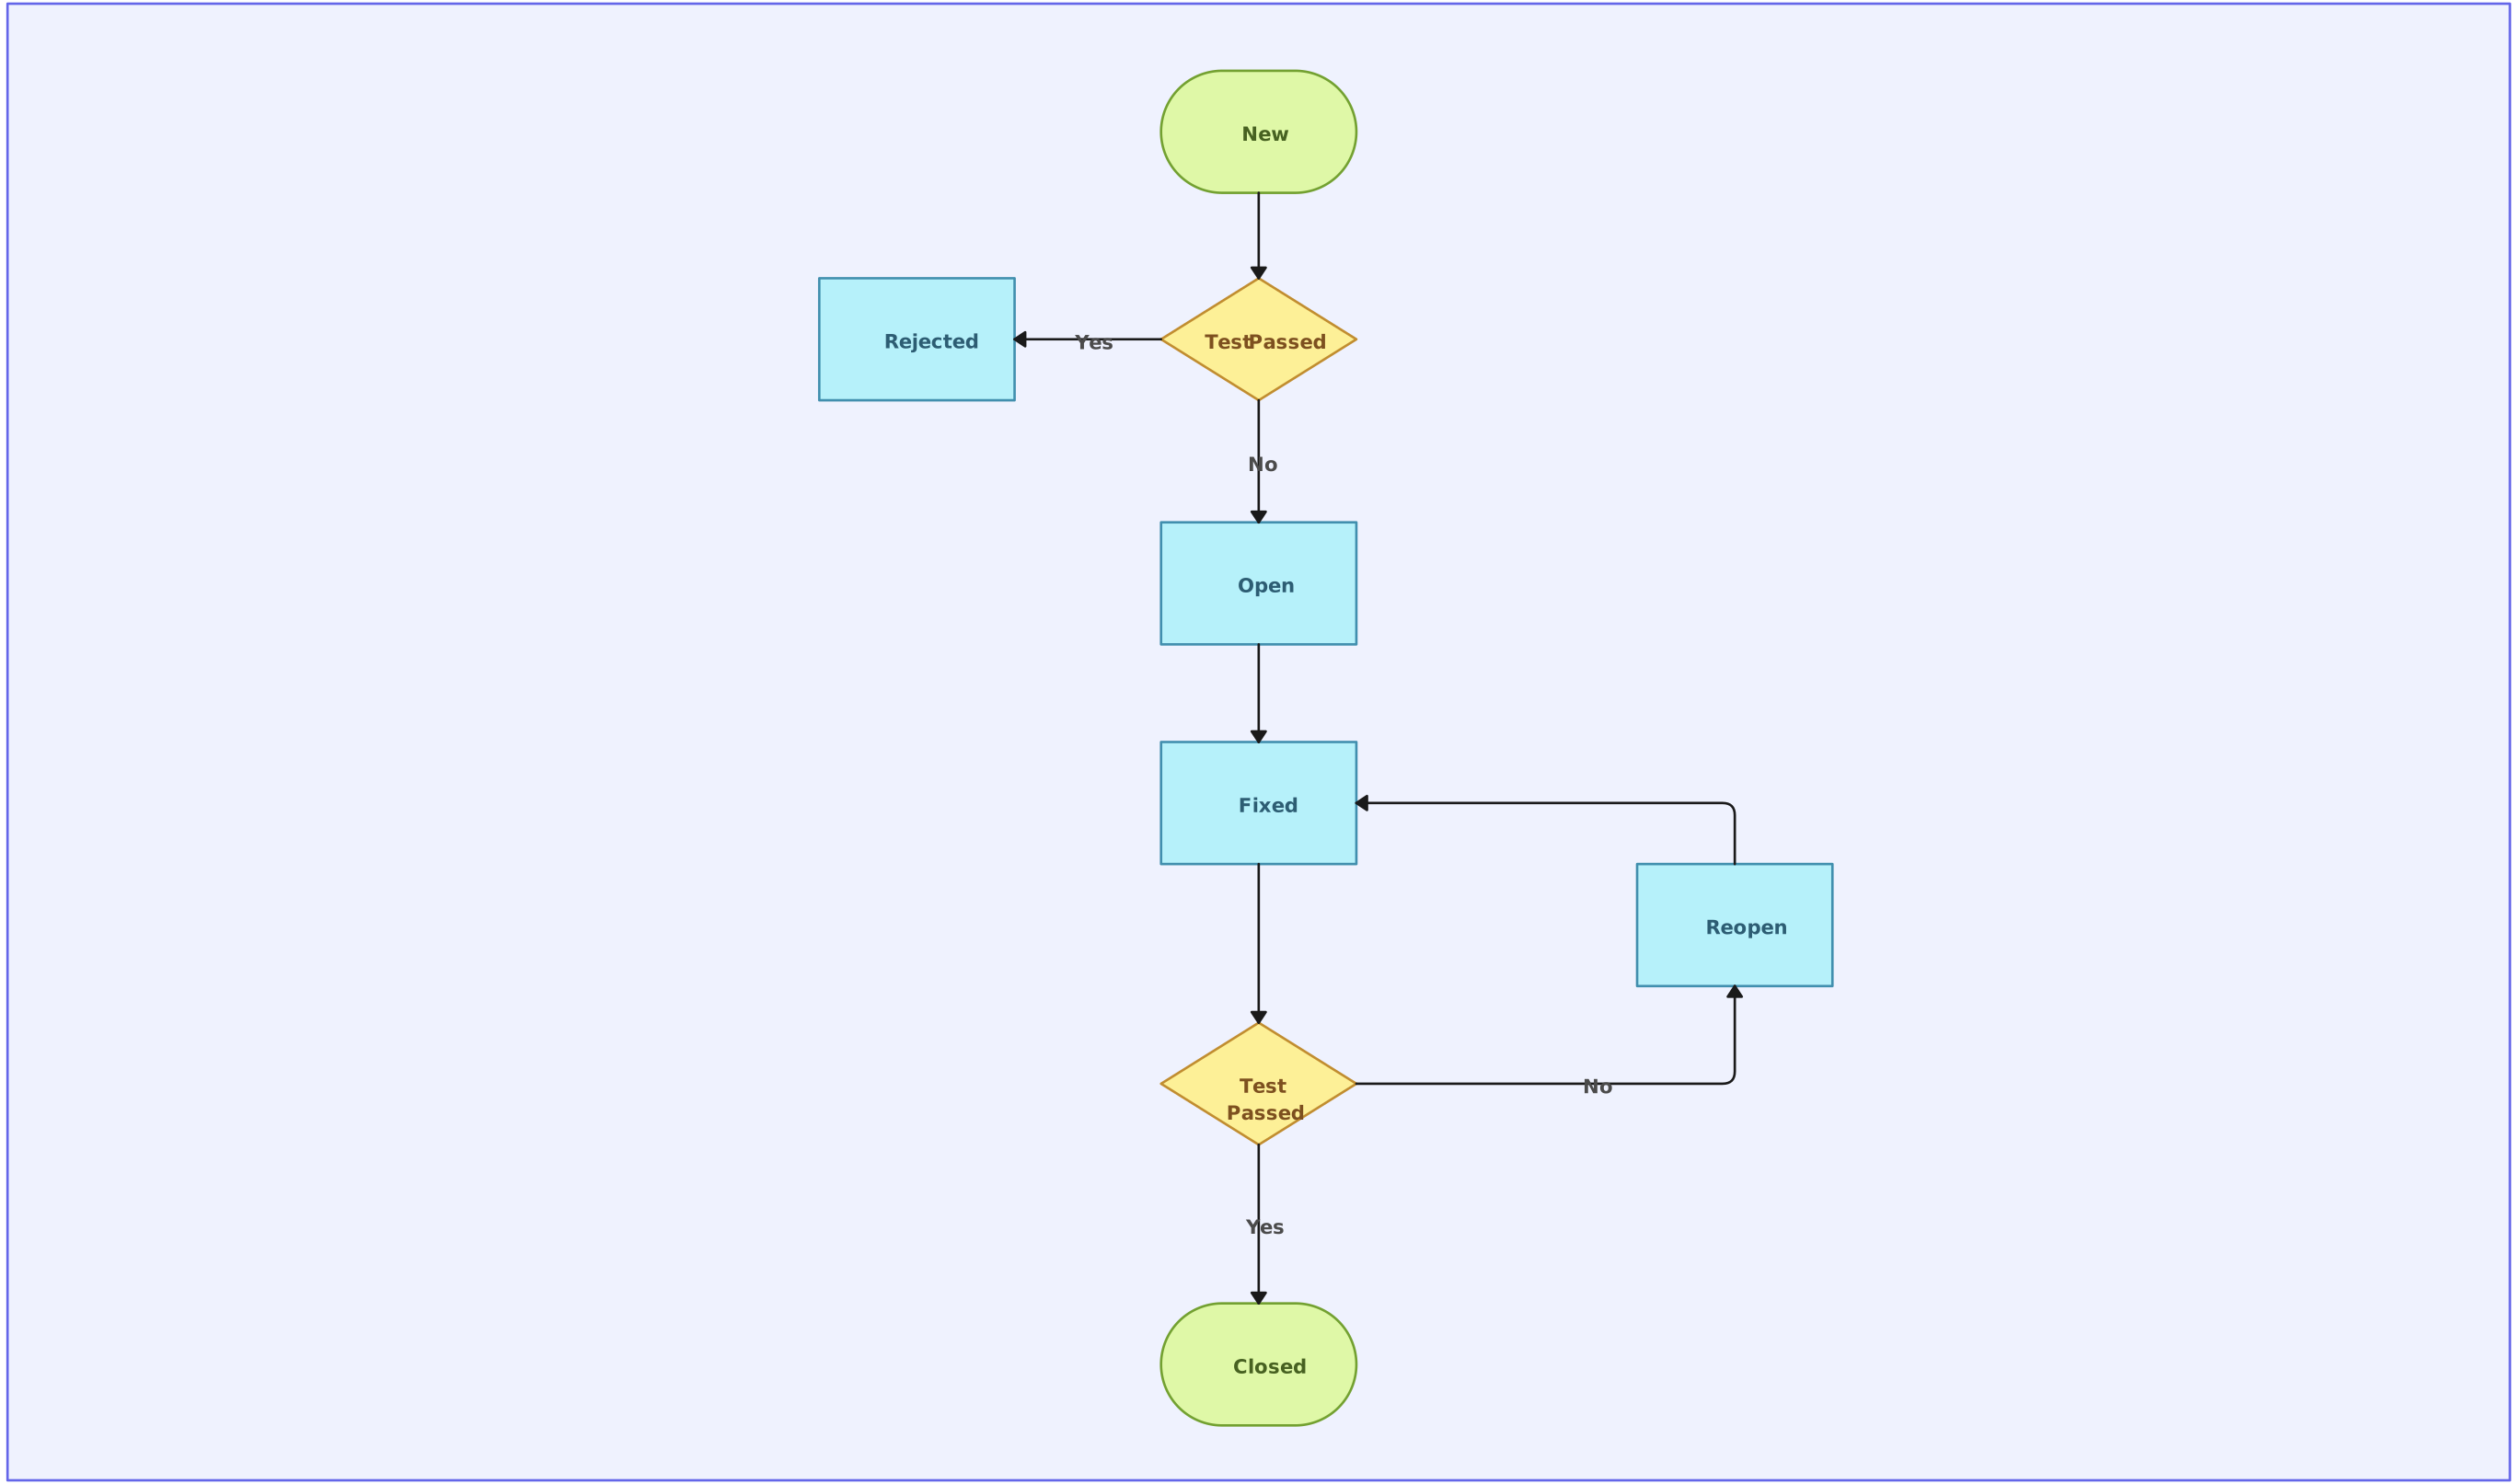
Defect Bug/Life Cycle Flowchart
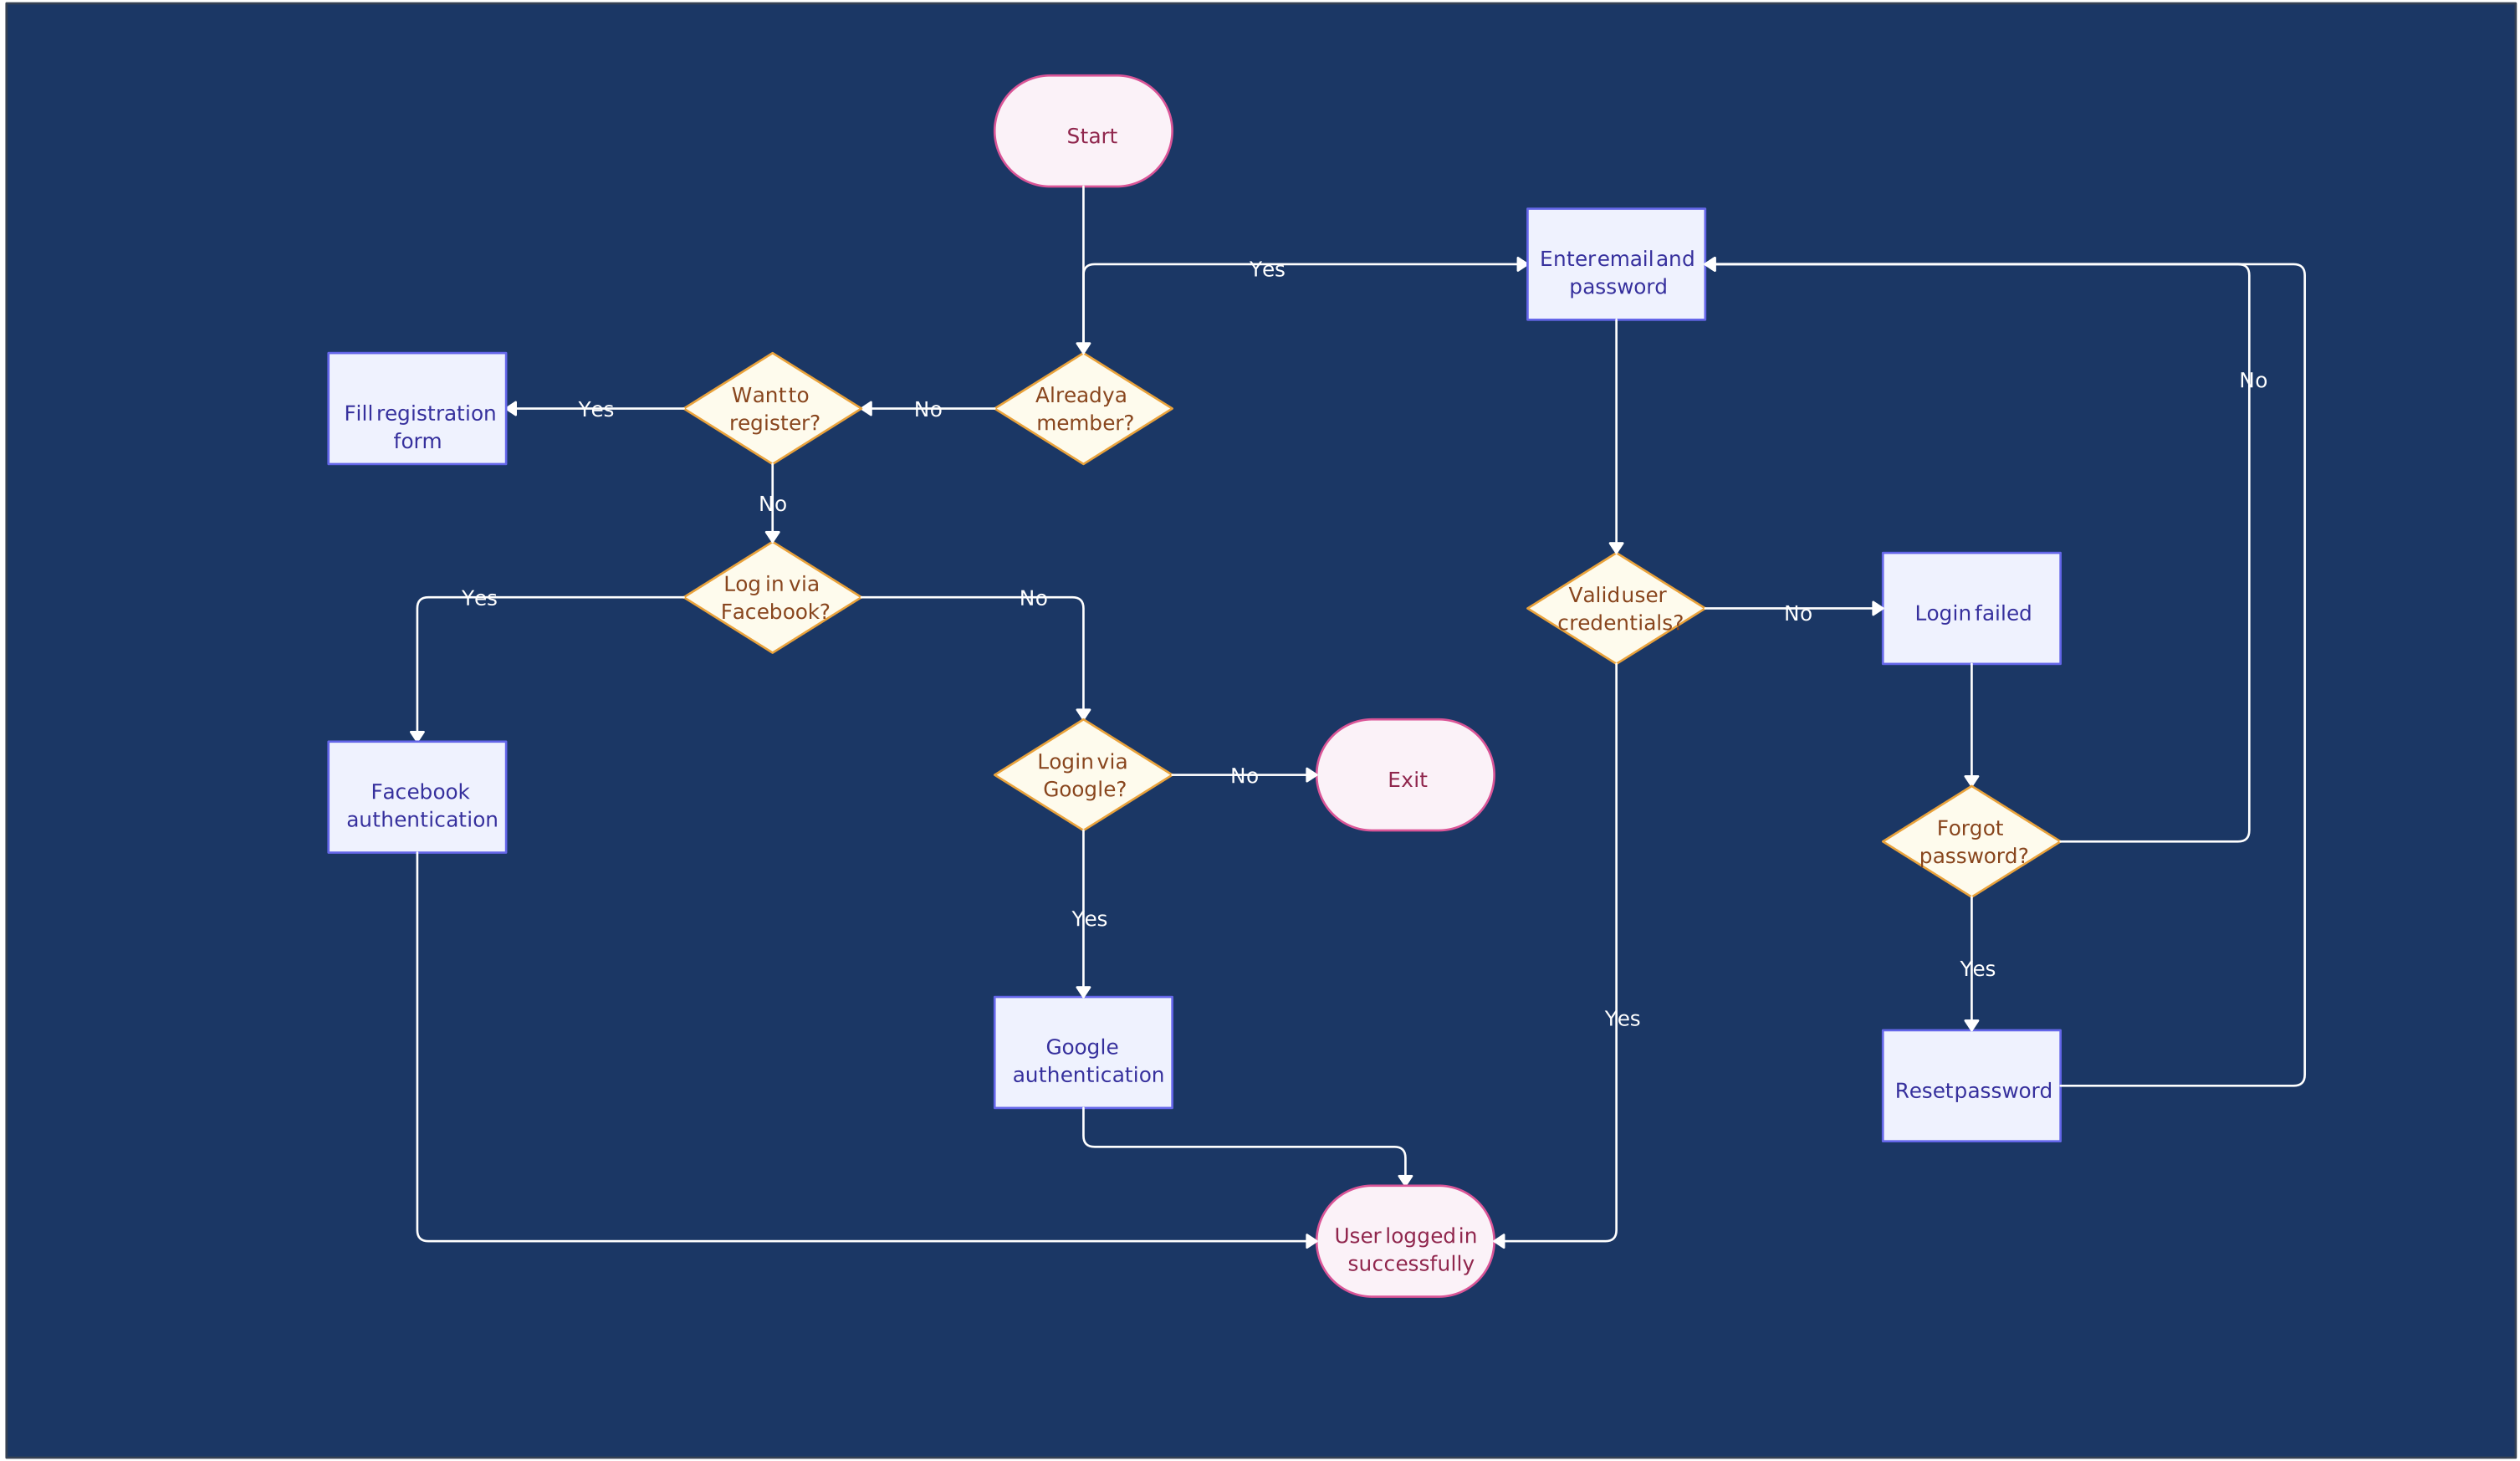
User Registration Flow Diagram
Flowchart Best Practices
There are a few things you can do to make your flowchart universally accepted. And there are some things that you can do to make it visually pleasing to others as well.
If you’re planning to share your flowchart or hoping to use it on a presentation etc. then it’s wise to use standard symbols. However, it is important to remember that the idea is to give out information in an easy to understand manner. It is perfectly acceptable to use an alternative image instead of the document symbol as long as the audience understands it.
Keeping the arrow flow to one side, using the same size symbols, naming the decision blocks, processes, arrows, etc. are a few things you can do to make it better. The common mistakes section covers most of these practices in detail.
What to Do and Avoid When Drawing Flowcharts
Even experienced diagrammers can make small mistakes when creating flowcharts. While these errors don’t necessarily make a flowchart “wrong,— avoiding them can make your diagrams clearer, easier to understand, and more professional.
| Dos | Don’ts |
| Keep the flowchart simple and easy to follow | Overcomplicate with too many shapes or details |
| Use consistent shapes and symbols | Mix different shapes for the same type of step |
| Arrange the flow logically from top to bottom or left to right | Create confusing or circular flows |
| Label all shapes clearly | Leave shapes or connectors unlabeled |
| Use swimlanes for multiple responsible parties | Ignore responsibilities, making the chart hard to read |
| Keep connectors straight and organized | Cross lines unnecessarily or clutter the diagram |
| Start with a clear process scope | Jump into drawing without defining the process |
| Review and test the flowchart | Assume it’s correct without checking for errors |
Frequently Asked Questions About Flowchart
What is a subprocess in a flowchart?
How are flowcharts used in computer programming?
What are the 5 basic symbols of a flowchart?
The five basic flowchart symbols are:
- Oval: Start or end of a process
- Rectangle: A process or task
- Diamond: A decision point
- Parallelogram: Input or output
- Arrow: Direction of flow
What are the basic rules to create a flowchart?
- Use standard symbols consistently
- Connect shapes with arrows to show flow
- Keep the flowchart simple and logical
- Start with a clear process scope
- Avoid crossing lines or clutter
What is the difference between a flowchart and a diagram?
Is a workflow the same as a flowchart?
What is the easiest way to create a flowchart?
Comments and Feedback on the Flowchart Tutorial
I hope this flowchart tutorial will help you to come up with awesome flowcharts. Flowcharts are a great way to present complex processes in a simple-to-understand manner and they are used all over the world in many industries. If you have a question about drawing flowcharts or have any suggestions to improve this post, feel free to mention in the comments section.